WATER QUALITY AND SOCIO-ECONOMICS FACTORS AFFECTING FISH PRODUCTION IN CIRATA RESERVOIR, WEST JAVA, INDONESIA
Nadia Istiqomah 513M122
MASTER THESIS
Laboratory of Economic System of Bioresources Department of Sustainable Social System Graduate School of Bioresources Faculty,
Mie University
Master Program of Environmental Science,
Padjadjaran University
WATER QUALITY AND SOCIO-ECONOMICS FACTORS AFFECTING FISH PRODUCTION IN CIRATA RESERVOIR, WEST JAVA,
INDONESIA
ABSTRACT
The study was aimed to investigate socio-economics factor affecting fish production and to estimate water quality factor affecting fish production in Cirata Reservoir, West Java, Indonesia. Data were obtained from 115 farmers spread over 3 districts in the area of study. Cross section data of socio-economics factors were obtained from the farmer and examined in the study. In addition, historical data of water quality were gathered from the institution. Cobb-Douglass production function was used to estimate the relationship among socio-economics variables and fish production. Principal Component Analysis (PCA) was used to reduce dimension of water quality dataset then examine water quality data and fish production, represented by fish kill ratio. The result revealed that socio- economics factors affecting fish production in the area of study included feed (77%, p<0.01), fingerlings (7%, p<0.1), cost of production (7%, p<0.05), number of cages (4%, p<0.05), labor (6%, p<0.05), and feeding time (10%, p<0.01). Other socio-economics factors such as educational background, experiences, location, and number of dependents, have not significant affect to fish production in the study area. Bottom measurement of water quality was used to estimate water quality and fish kill ratio. According to the Principal Component Analysis (PCA) result, the most variances of water quality parameters in Cirata Reservoir are TSS, DO, Nitrite and Turbidity. Fish kill ratio, as representative of production risk, in
the study area were examined by water quality data. The study revealed that Total Suspended Solid (TSS) and Dissolved Oxygen (DO) has similar trend with fish kill ratio. Both parameters represent water quality and fish kill occurrence in the study area. Fish production in Cirata Reservoir is mainly determined by input factors than personality background of the farmers. However, this activity also determined by environmental condition, represented by water quality, which may lead to the production risk, such as fish kill occurrences. The number of fingerling stocked and feed used revealed that farmers are overstocked and overused compare to regulated amount. Therefore, decreasing intensity of amount of fingerling stocked and feed used are necessary. Further, better management for fish farming practice is recommended due to sustainable fish production in the study area. Farmers should be involved to take a role actively in reservoir management.
ACKNOWLEDGEMENT
The author gratefully thank for financial supports from Ministry of Education Scholarship (Beasiswa Unggulan), Indonesia. The sincere thanks goes to Takahiro Matsui, Ph.D as supervisor for his guidance, assistance, and invaluable comments and suggestion, Prof. Qingxiu Chang as the head of Economic System of Bioresources Laboratory for her supports and attention during the study, and Yamada Fukuji, Ph.D for his discussion and suggestion, Sunardi Ph.D and Dr.rer.nat M. Fani Cahyandito as supervisors from Indonesia for invaluable guidance, assistance and support during the study and also all members of Economic System of Bioresources Laboratory for nice spirit and friendship.
Thanks also for Institute of Ecology, Padjadjaran University, for providing water quality data in the study area; Cirata Management Officer (BPWC), Marine and Fisheries Department for providing information about Cirata Reservoir and fish production in the study area. Thanks also for all fish farmers for their willingness to cooperate to answer the question.
TABLE OF CONTENT
LIST OF FIGURES 6
LIST OF TABLES 7
CHAPTER 1
INTRODUCTION 8
Research Background 8
Research Objectives 10
CHAPTER 2
CIRATA RESERVOIR AND FISH FARMING PRACTICE 11
Profile of Cirata Reservoir 11
Floating Net Cage Aquaculture in Cirata Reservoir 12 Water Quality Status and Fish Kill Occurrence in Cirata Reservoir 13 CHAPTER 3
RESEARCH METHODS 15
Data 15
Method 17
CHAPTER 4
RESULT INTERPRETATION OF FISH FARMING SURVEY 19 Personal Characteristics of Respondents 19
Fish Farming Practice 22
Environmental Factors 27
Problem/Constraints to Fish Production 27
CHAPTER 5
DATA ANALYSIS 29
Socioeconomics Factors Related to Fish Production 29
Water Quality and Fish Production 34
CHAPTER 6
DISCUSSION 38
CHAPTER 7
CONCLUSION AND RECOMMENDATION 42
REFERENCES 43
APPENDIX
LIST OF FIGURES
Fig 1 Trend of Fish Production and Dissolved Oxygen Concentration in
The Study Area 9
Fig 2 Map of Cirata Reservoir 16
Fig 3 Frequency of Farmers’ Age 19
Fig 4 Gender and Marital Status of Fish Farmers 20
Fig 5 Fish Farmers’ Experiences 21
Fig 6 Education Level 21
Fig 7 Number of Dependents 22
Fig 8 Fish Farmers’ Number of Cages 23
Fig 9 Ownership Status of Cages 23
Fig 10 Feeding Time Frequency 24
Fig 11 Non Aquaculture Job 25
Fig 12 Retribution Payment 27
Fig 13 Environmental Factors 27
Fig 14 Problem/Constraint to Fish Production 28
Fig 15 Utilization of Additional Materials 28
Fig 16 Trend of Dissolved Oxygen, Total Suspended Solid, and Fish Kill
Ratio 37
LIST OF TABLES
Table 1 Physical Features of Cirata Reservoir 11
Table 2 Socioeconomics and Personal Characteristics of Farmers 25 Table 3 Definition of Variables Included in Regression Model 29
Table 4 Descriptive Statistics of Variables 31
Table 5 Cobb-Douglass Production Function between Fish Production and
Several Explanatory Variables (1) 32
Table 6 Cobb-Douglass Production Function between Fish Production and
Several Explanatory Variables (2) 33
Table 7. Multiple Linear Regression between Fish Kill and Water Quality 36 Table 8 Regulated Amount of Fingerlings Stocked and Feed Used in
Cirata Reservoir 38
CHAPTER 1 INTRODUCTION
RESEARCH BACKGROUND
Cirata Reservoir, one of the biggest and important reservoirs in West Java, Indonesia, had been utilized for many purposes. Besides the main function as hydroelectric power for heavy-populated Java-Bali, Cirata Reservoir had been utilized for fish farming activity through floating net cage aquaculture.
Floating net cage aquaculture in Cirata Reservoir has contributed to fulfill freshwater fish consumption in West Java. As much as 96,07% of total aquaculture production was produced in the reservoir through floating net cage aquaculture, includes Cirata Reservoir (West Java Statistics, 2007). Two kinds of fish which is selected to be cultured, Common carp and Nile tilapia, are considered to the kind of fish mainly consumed in West Java. Over the year, the cages in Cirata Reservoir had increased fourfold more than the regulation from government (Governor, 2011). Since it was first constructed in 1988, as much as 74 units of cages are exist in the Cirata Reservoir, then the government limited the number of cages as much as 12,000 units by considering the carrying capacity of the reservoir. Recently, the number of cages exist in the Cirata Reservoir had reached 53,031 unit cages (BPWC, 2011)
The increasing of cage number in Cirata Reservoir delivered to the higher fish production; on the other hand it is delivered also to the environmental
area were opposite with the environmental condition, represented by Dissolved Oxygen concentration, which is showed decreasing trend year by year (Fig.1).
Figure 1. Trend of Fish Production and Trend of Dissolved Oxyen Concentration in Cirata Reservoir (Source : Marine and Fisheries Department and BPWC)
Some problem occurs and become one of production risk, such as fish kill occurrences in the study area. The number of studies contributed to evaluate water quality status in the reservoir has increased recently; however, it is few to find studies about socioeconomics and fish farming practices in the study area. In addition, to describe water quality condition through time series data and its relation to the production risk, such as fish kill occurrences. Examining the present status of fish farming practice and give environmental information about water quality from the past time become important. Therefore, this study attempt to concern about this issue and further to come up with potential recommendation to reduce the risk.
RESEARCH OBJECTIVES
The objectives of the study are described as follows:
a. To investigate the socio-economics factors affecting fish production in Cirata Reservoir
b. To estimate the relationship between water quality and fish production in Cirata Reservoir through time series data
CHAPTER 2
CIRATA RESERVOIR AND FISH FARMING PRACTICE
Profile of Cirata Reservoir
Cirata Reservoir is man-made lake, one of the reservoirs which have main function as hydroelectric power. Cirata Reservoir had dammed Citarum watershed together with other two reservoirs, Jatiluhur and Saguling. The construction of the reservoir had been finished since 1988, so that had some consequences such as:
changing the environment from land area into water area, more than 6000 household had to move from Cirata. However, it had provided new living resources through fish farming activities (Costa-Pierce & Soemarwoto, 1990)
The utilization of Cirata had been developed so that has additional function for fisheries activities, reservoir, and water tourism (BPWC, 2012).
Administratively, Cirata Reservoir is located widely among three districts of West Java (Cianjur, Purwakarta, and Bandung Barat), under the stewardship of BPWC (Cirata Reservoir Management Officer). Some physical features of Cirata Reservoir are showed below:
Table 1 Physical Features of Cirata Reservoir
Characteristics Cirata
Year filled (inundated) 1988
Altitude (m) 221
Area (Ha) 6,200
Catchment Area (Ha) 603,200
Volume (x106m3) 2,165
Maximum depth (m) 106
Mean depth (m) 34.9
Water level fluctuation (m) 20
Hydroelectric power (MW) 500
Original Function Hydroelectric Power
(Sembiring, undated)
Floating Net Cage Aquaculture in Cirata Reservoir
Impoundment process of Cirata Reservoir had generated new living resources and job opportunities for impacted people through fisheries activity.
There are 3 schemes of fisheries activities were conducted in Cirata reservoir in order to provide job opportunities, such as: capture fisheries, floating net cage aquaculture, and agri-aquaculture in the drawdown area (fisheries is conducted when the flood, while cropland is conducted when drawdown period) (Costa- Pierce & Soemarwotto, 1990).
Floating net cage aquaculture become one of fisheries activities which highly density in the Cirata Reservoir. The utilization of water body for floating net cage aquaculture has been regulated by the Province Governor that stated 1%
of water body is allowable for floating net cage aquaculture. The size of cages is 7m x 7m with double layer where common carp filled the upper side and nile tilapia filled in the below side. One unit of cages consists of 4 plots of 7m x 7m cage, called one unit business. Both kinds of fish which is selected to rear in Cirata Reservoir are commonly consumed, high demand and value.
Fish farming practice through floating net cage aquaculture in Cirata Reservoir had increased gradually and had contributed as much as 80,9%, 96,7%, and 54,9%, successively in 2006 – 2008 of total floating net cage production in West Java (Anonymous, 2007; Kurniawan & Kustiasih, 2011). As a result, fish production in Cirata Reservoir also contributed to other economic activities and had provided a lot of job opportunities in many sectors.
Water Quality Status and Fish Kill Occurrence in Cirata Reservoir
Cirata Reservoir is located between other two reservoirs (Saguling and Jatiluhur) in cascade unit. Therefore, one of determinants of water quality condition in Cirata Reservoir is depend on the upstream flow which has much more input from urban domestic waste. In addition, water quality of Cirata Reservoir is determined by activity in the water body itself, such as aquaculture activity. Government Regulation No.41/2002 stated that the water body of Cirata Reservoir is designed for raw drinking water and household/domestic requirement (class B), fisheries activities requirement (class C), and hydroelectric power generation (class D).
According to the input loading flow through Cirata Reservoir, the problem of eutrophication occurs in Cirata Reservoir. A number of nutrient input are contributed to increase water fertility in the reservoir and sedimentation. Fish farming activity has the highest phosphor amount contributes to the reservoir as much as 467,41 mg/m3 (Ardi, 2012). Eutrophication phenomenon is naturally phenomenon in the lake related to the age of lake and could be accelerated through intervention of human activities (Carpenter, et al., 1998).
Eutrophication phenomenon delivered to some problems such as fish kill occurrences which is regularly occurs in Cirata Reservoir. The first fish kill occurrences in Cirata Reservoir had occurred in 1990 (Abery, et al, 2005; Zainal, Undated) and delivered loss of fish farming profitability.
One of important water quality parameter is Dissolved Oxygen (DO) which is essential for aquatic life. Dissolved Oxygen concentration less than 3mg/l will
cause stress in aquatic life, especially fish. Dissolved Oxygen in the water could be a good indicator of nutrient loading in the lake (Boyd and Tucker, 1998).
CHAPTER 3
RESEARCH METHOD
Data
The data in this study are divided into two categories, primary data and secondary data. Primary data were gathered through interviewing process to the farmers, while the secondary data were gathered from government and institute that are related to fish farming practices and water quality measurement in Cirata Reservoir.
Primary data consist of current fish farming practices in Cirata Reservoir.
It is divided into 4 sections as follows : The first section is information about personal identity of farmers, the second section is information about cage culture practice, the third section is information about farmers’ perception toward environmental condition in Cirata Reservoir, and the last section give information concerning farmers’ income from fish farming and non-fish farming practice.
The secondary data consist of yearly of fish production in Cirata Reservoir which is gathered from Departement of Fisheries in every district, Technical Implemented Unit in every districts and, Departement of Fisheries, West Java Province, Indonesia. In addition, water quality monitoring data was collected from the Institute of Ecology, Padjadjaran University. The data consists of surface, 5m depth and bottom measurements of both chemical and physical parameters.
The study was conducted in Cirata Reservoir, West Java, which is widely located among three districts (See Fig2. Cianjur, Bandung Barat, and Purwakarta).
The number of respondents was divided proportionally based on total existing farmers in three districts.
Fig2. Map of Cirata Reservoir
The population of fish farmers in three districts is 2,102 fisheries households (BPWC, Report of Floating Net Cage Aquaculture Inventarisation 2011, 2011). A total of 115 farmers were selected randomly from given population developed by Lynch, et al (1974) and divided proportionally as follows: Cianjur (38 farmers), Purwakarta (29 farmers) and Bandung Barat (48 farmers).
The farmers were interviewed in their cages/farm sites. This survey was conducted using a questionnaire with mix open-ended and close-ended questions and it was pre-tested to 5 farmers to investigate the structure, easy-understanding, and ambiguity of the question (not include in the study).
The study use both descriptive and statistical analysis method. The socio- economic variables were examined using linear regression model. The dependent variable is the output of fish production per unit, including common carp and nile tilapia as kind of fish cultured by the farmer. In one unit of cage, farmers could harvest twice common carp and once nile tilapia. The definitions and measurement of variables are presented in Table 1. Data analysis was conducted using open accessed freely statistical software, R software.
For estimating and measuring the relationship between water quality and fish production, the time series data were used. A collective set of water quality data from 2002 to 2011 were used to estimate together with limited historical fish kill data. Water quality data of reservoir involved all the observation stations (in total 11 station) which were measured quarterly. There are 15 variables including both physical and chemical parameters are available to measure (not included heavy metal concentration) consist of : Temperature (oC), pH, Carbon dioxide (CO2), Dissolved Oxygen (DO), Bicarbonate (HCO3-), Biological Oxygen Demand (BOD), Nitrite (NO2-), Phosphate (PO43-), Turbidity, Total Dissolved Solid (TDS), Total Suspended Solid (TSS), Conductivity, Calcium Carbonate (CaCO3-), Phosphate (PO43-), and Nitrate (NO3- ). Principal Component Analysis (PCA) method was used in the dataset to reduce the parameters and to estimate the most variance parameter by considering multicollinearity problem among water quality parameters (Mazlum, Ozer, & Mazlum, 1999; W. Petersen, 2001;
Mishra, 2010; Nasir, et al., 2011).
Fish kill occurrence data were not published and recorded in one source.
Therefore, it is considered to collect from many sources, such as Technical
Implemented Unit, Literature research, and Newspaper Report. Fish kill occurrence in the study area measured by fish kill ratio (%) (Ratio from fish production yearly)
CHAPTER 4
RESULT INTERPRETATION OF FISH FARMING SURVEY
Personal Characteristics of Respondents
a. Farmers’ Age
The majority age of fish farmer is in reproductive age. The majority age is about 31-40 years old (39,13%), followed by farmer’s age 41-50 years old (21,74%), and 21-30 years old (20,86%). Conrad (2004) stated that productive age means a range of age when people can work for paid employment optimally. The productive age range is depending both on kind of work and country. In Indonesia, the specific range of productive age from 18-55 years old, which means people, could work optimally in that range. By this result, most of farmer doing fish farming activity in Cirata Reservoir could be categorized in young or productive age.
Fig 3. Frequency of Farmers’ Age
b. Gender and Marital Status
Based on survey data, majority fish farming activity in Cirata Reservoir is held by man (99%) compared to women (1%). This indicates that male dominance
in fish farming activity in the study area. The role of women in the study area is mainly in the household works or trading in the land. The women also participate in fish processing, such as making food from fish. The female who take a part in fish farming activity is related to the business (restaurant) in the center of reservoir. Majority the fish farmer in the study area were married (93,04%) and 6,95% of farmers are unmarried/single.
Fig 4. Gender and Marital Status Frequency of Fish Farmers
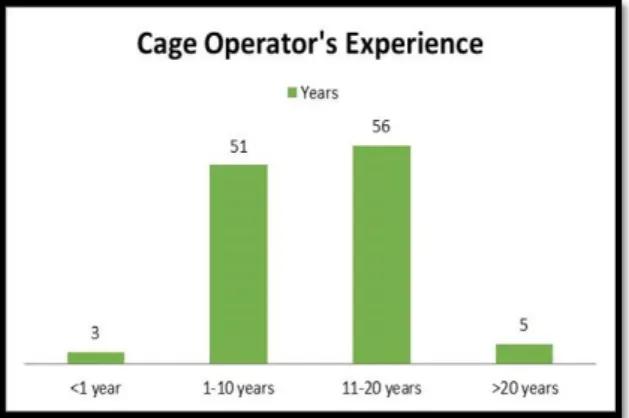
c. Fish Farming Experiences
In case of experiences, most of farmers have 11-20 years experiences (48,7%), followed by farmers whose 5-10 years experiences (44,35%), more than 20 years experiences (4,35%) and less than 1 year experiences (2,61%) in fish farming activities in Cirata Reservoir. Since it had been constructed, fish farming activity had been taken place for 24 years. The experience for doing fish farming activities is suggested to have better knowledge about fish farming activities in Cirata Reservoir.
Fig 5. Fish Farmers’ Experiences
d. Education Level
Based on surveyed data, majority of fish farmer in the 3 districts has experience for maximum 9 years schooling (secondary school or lower) as much as 78,86%. Other farmers get higher school and university, each 17,07% and 1,63% then followed by farmers who had no school as much as 2,44%
respectively. Education level is expected to have a role in aquaculture practice related to the decision making for farming activities.
Fig 6. Fish Farmers’ Education Level
e. Number of Dependents
Majority of fish farmer has 0-3 person per family (64,35%), it may consist of parents with 1-2 children, followed by farmers whose 4-7 person per family (33,91%) and 8-11 person per family (1,74%). Number of dependents could indicate the number of person in the farmers’ family who need to be fulfilled in daily life.
Fig 7. Fish Farmers’ Number of Dependents
Fish Farming Practices
a. Number of Cages
Based on surveyed data, farmers have the range of cage number ownership between less than 5 cages until 15 cages per household (95,66%), followed by farmers whose more than 25 unit cages (2,61%) and 16-25 unit cages (1,74%). In average farmers have 6-8 unit cages per household. The number of cages ownership has been regulated by Local Regulation No.7/2011 which is stated that the maximum number of cage ownership is limited only 20 cages (size 7mx7m) per household (Governor, 2011). However, practically some farmers may have
Fig 8. Fish Farmers’ Number of Cages
b. Ownership Status of Cages
Formerly, floating net cage aquaculture was provided for people who affected by reservoir construction as compensation for new living resources. The West Java Governor Decree stated that utilization of water body for fish farming activity in Cirata Reservoir was designed both for local people who lives around the reservoir as their livelihood and for outsider. Recently, due to profitable aquaculture industry, there are many people outsider who investing in floating net cage aquaculture. Some of local people take a role as hired operator to maintain and to operate the cage. In this study as much as 78,26% of respondents are the owner of cages while 21,74% of respondents are the tenant (hired operator).
Fig 9. Fish Farmers’ Ownership Status
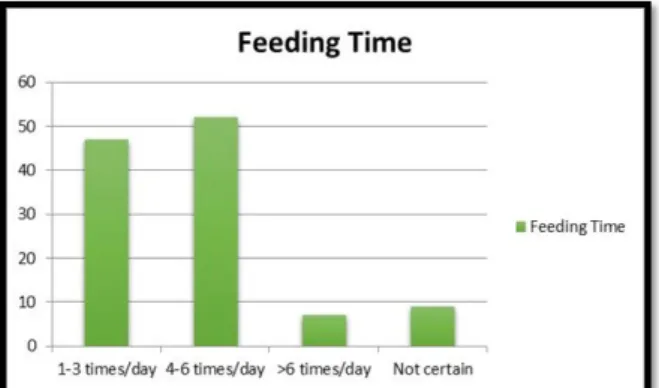
c. Feeding Practice
There are two types of feed in Cirata Reservoir, sink feed and floating feed. Mostly of farmers in Cirata Reservoir tend to choose sink feed than floating feed. Both of feed types have their own drawbacks related to uneaten fish feed.
The type of fish feed mainly used in Cirata Reservoir is sink feed type. There are many feed companies which are fulfilled the needs of feed in Cirata Reservoir. In a month, about 8-8,5 ton feed fish are used in the reservoir (Rahmani, 2012). In feeding practice, most of all farmers feed their fish manually by hand with range of feeding time mostly 4-6 times in a day (45,22%), followed by 1-3 times per day (40,87%), some farmers has not certain times to feed the fish (7,83%) and 6,09%
of farmers has more than 6 times a day for feeding the fish. Based on interview process, farmers tend to feed the fish as much as possible to increase fish production. Farmer use commercial feed which is contains 27-28% of protein. To produce 1 kg of common carp, farmers need about 2 kg of feed.
Fig 10. Feeding time frequency among Farmers
d. Non Aquaculture Job
Aquaculture and other non-aquaculture jobs could describe the potential job for local people. A number of 54,78% respondents are contributing in fish farming activity as their main occupation, while 45,22% of them have other substitute jobs, such as trading, labor in factory, and land farmer. Therefore, floating net cage aquaculture in Cirata Reservoir became the main income source for the most farmers surveyed.
Fig 11. Fish Farmers’ Non Aquaculture Job
To summarize, socioeconomics and personal characteristics of farmers are included in Table 2.
Table 2. Socioeconomics and Personal Characteristics of Farmers
Characteristics Frequency Percentage (%) Personal Characteristics
Farmer’s Age (in years)
<20 2 1,74
21-30 24 20,87
31-40 45 39,13
41-50 25 21,74
51-60 13 11,30
>60 6 5,22
Sex
Male 114 99,13
Female 1 0,87 Marital Status
Married 107 93,04
Unmarried 8 6,95
Number of Household (person)
0-3 74 64,35
4-7 39 33,91
8-11 2 1,74
Experiences (in year)
<1year 3 2,61
1-10 years 51 44,35
11-20 years 56 48,70
>20 years 5 4,35
Education Level (in years)
No school 3 2,44
Secondary school or lower 97 78,86
High School 21 17,07
University 2 1,63
Fish Farming Practice Number of Cages (unit)
>5 55 47,83
5-15 55 47,83
16-25 2 1,74
>25 3 2,61
Ownership Status
Owner as Cage Operator 90 78,26
Tenant as Cage Operator 25 21,74
Feeding Time (times per day)
1-3 47 40,87
4-6 52 45,22
>6 7 6,09
Not certain 9 7,83
Cage Culture Status
Main Livelihood 63 54,78
Not main livelihood 52 45,22
(Source : Fish farmers survey 2013)
e. Retribution Payment and Regulation
Based on survey, most of farmers do not pay the retribution to build a
farmers should pay the retribution. Otherwise, some farmers do not pay retribution because they loss in their farming activity.
Fig 12. Retribution Payment in Cirata Reservoir based on Survey
Environmental Factors (Fish Kill and Fish Disease Occurrences)
Farmers in Cirata Reservoir are threatened by both fish kill and fish disease occurrences regularly. Based on interview, the change of weather was trigger of fish kill occurrences.
Fig 13 Fish Kill and Fish Disease Occurrences in Cirata Reservoir
Another reason for fish mortality is fish disease occurrences. Some farmers experience once in a year (42,61%) , others experience more than once in a year (57,39%).
Problem/Constraints to Fish Production in Cirata Reservoir
Some questions related to the environmental impact in fish farming activities are addressed to the farmer. Some problem and constraints in fish
production are listed by farmers. Majority of farmers with multiple response assumed that the weather is the main problem related to fish production, followed by water quality, fish disease and feed price.
Fig14 Problem/Constraint to Fish Production
Basically, farmers have well understanding about environmental problem in Cirata Reservoir because they have experiences the loss of production caused by fish kill and fish disease. Conversely, they have to treat the fish by feeding more and add some inputs to increase their production. Some farmers use both commercial materials, such as vaccine, vitamin, and probiotic, while others use traditional way to increase fish growth and fish production. In contrast, most of farmers do not give additional materials for the fish, but give more feed is assumed as the best way to increase fish production.
CHAPTER 5 DATA ANALYSIS
Socio-economics Factors Related to Fish Production
The socioeconomics characteristics of the respondents include: education, number of dependents, year of schooling, year of experiences, feeding time, number of cages, and location of the cages.
Table 3. Definition of variables included in regression model
Variable Definition
Dependent Variable
Y, Output of Fish Production Output of Fish Production (kg/unit) Independent Variable
EXP, Experience Year of farmer’s in fish farming activity (years)
EDU, Education Year of schooling (years) NOC, Number of Cages Number of cages (cage units)
ND, Number of Dependents Number of dependent family (person) COST, Cost of Production Cost of fish production (Rp)
FEED, Number of feed Number of feed per unit (kg) FING, Number of fingerling Number of fingerling stocking (kg) FT, Feeding Time Times for feeding the fish (times per day) LAB, Labor Number of hired labor (person)
LOC1, Location Cianjur, 1; Otherwise, 0 LOC2, Location Purwakarta, 1; Otherwise, 0
The variables above are determining clearly as follows:
a. Output of Fish Production (Y) is the number of fish harvested in one unit of cage (measured by kg). One unit of cage represents one unit business of farmers. In one unit of cages, farmers usually harvest twice common carp and once nile tilapia.
b. Farmers’ Experience is the period of time that farmers had involved in fish farming practice, measured by year.
c. Farmers’ Education, is the period of time that farmers had done their school, measured by year
d. Number of Cages, is the number of unit cages that owned/operated by farmers, measured by unit.
e. Number of Dependents, is the number of member in farmers’ family, not include the farmers, measured by person.
f. Cost of Production, is contain of variable cost (including cost for transportation, wage of labor, and utilization of antibiotics or vitamin) g. Number of Feed, is the number of feed given by farmers in one unit of
cage, measured by kg
h. Number of Fingerlings, is the number of fingerling stocked by farmers in one unit of cage, measured by kg
i. Labor, is the number of hired labor for doing fish farming activity, measured by person
j. Feeding Time, is times of feeding practiced by farmers in a day
k. Location is the parameter to observe whether there is difference production among three districts or not. This parameter is expressed by dummy variable.
D1 1 = If the cages is located in Cianjur district
0 = If the cages is located in other districts
The descriptive statistics of variables examined is conducted to give information about frequencies, distribution, and variation of data.
Table 4. Descriptive Statistics of Variables
Variables Unit of
Measurement Mean Standard
Deviation Min Max
Output (Y) kg per unit 4916.842 2559.599 1700 14800
Fingerling
Stocked/FING (X1) kg per unit 749.1228 301.3673 270 3100
Labor/LAB (X2) Person 8.491228 2.215175 1 9
Feed (X3) kg per unit 7319.298 4568.067 1800 24000
Cost of
Production/COST (X4)
Rp per unit 12038917 5.848e+06 3440000 48500000 Number of
Cages/NOC (X5) Unit 6.867 1.004e+01 0.75 100
Number of
Dependents/ND (X6) Person 4.27 1.798e+00 0 9
Education/EDU (X7) years of
schooling 7.374 2.898e+00 0 14
Experience/EXP (X8) years of fish
farming 11.2 6.169e+00 0.3 25
Feeding Times (X9) Times per day 3.754386 1.711809 1 8
Location/LOC1 (D1X) (Cianjur =1;
Otherwise = 0) 0.2087 4.081e-01 0 1
Location/LOC2 (D2X) (Purwakarta=1
; Otherwise=0) 0.1652 3.730e-01 0 1
Therefore, the model was specified as follows:
Y=f(AGE,EXP,EDU,NOC,ND,COST,FEED,FING,LAB,LOC1, LOC2)
The production function of fish production in Cirata Reservoir is expressed by Cobb-Douglass production function as showed in the following equation:
……… (1)
Where,
Y = Yield per unit (kg)
X1 = Stocking density; Number of Fingerlings per unit (kg) X2 = Labor; Number of hired labor (person)
X3 = Feed; Number of feed per unit(kg)
X4 = Cost of Production; Amount of Cost Production per unit (Rp) X5 = Number of Cages (unit)
X6 = Number of Dependents
X7 = Education; Year of School (year)
X8 = Experience; Time of fish farming practice (year) X9 = Feeding Time (times per day)
DX10 = Location; Cianjur =1, otherwise=0 DX11 = Location; Purwakarta = 1, otherwise = 0
In this study, production function of fish in Cirata Reservoir is expected to explain by the following variables:
Table 5 Cobb-Douglass Production Function (Log-linear Regression) between Fish Production (Y) and Several Explanatory Variables
Variables Parameter Coefficient Standard Error t value p value
Intercept 1 -0.4245374 0.5994669 -0.708 0.480426
FING (lnX1) 2 0.0671420 0.0454719 1.477 0.142844
LAB (lnX2) 3 0.0655509 0.0307526 2.132 0.035422**
NOC (lnX5) 6 0.0459532 0.0201866 2.276 0.024890**
ND (lnX6) 7 -0.0235859 0.0268489 -0.878 0.381734
EDU (lnX7) 8 -0.0166764 0.0290429 -0.574 0.567087
EXP (lnX8) 9 0.0004199 0.0155485 0.027 0.978507
FT (lnX10) 10 0.1047156 0.0269696 3.883 0.000183**
*
LOC1 (DX1) 11 -0.0143611 0.0346402 -0.415 0.679311
LOC2 (DX2) 12 -0.0182588 0.0369387 -0.494 0.622147
Sign codes: *0.1 **0.05 ***0.01
Residual standard error: 0.1358 on 102 degrees of freedom Multiple R-squared: 0.9276, Adjusted R-squared: 0.9191 F-statistic: 108.9 on 12 and 102 DF, p-value: < 2.2e-16
To examine the regression model, there are three classic assumptions to conduct as follows (Kennedy, 1998):
a. Simple correlation matrix and Varian Inflation Factor (VIF) value are examined for detecting of multicollinearity.
b. Breusch-Pagan Test to examine Heteroscedacity c. Durbin-Watson Test to examine Autocorrelation
In this model, there are several variables related each other (See Appendix), so that has multicollinearity. To resolve the problem, omitting one of variables is necessary. Since variable LOC1, LOC2 and EXP do not have significant relationship to fish production, then these three variables are omitting. As a result, a new model regression is generated as follows:
Table 6 Regression measurement among variables Variables Parameter Coefficient Standard
Error t value p value
Intercept 1 -0.38498 0.57469 -0.670 0.50438
FING (lnX1) 2 0.07236 0.04217 1.716 0.08910*
LAB (lnX2) 3 0.06440 0.02925 2.201 0.02987**
FEED (lnX3) 4 0.77982 0.02278 34.240 < 2e-16***
COST (lnX4) 5 0.07488 0.03450 2.171 0.03218**
NOC (lnX5) 6 0.04631 0.01900 2.437 0.01646**
ND (lnX6) 7 -0.02500 0.02607 -0.959 0.33989
EDU (lnX7) 8 -0.01756 0.02834 -0.620 0.53676
FT (lnX10) 9 0.10610 0.02640 4.019 0.00011***
Signif. codes: *0.1 **0.05 ***0.01
Residual standard error: 0.1337 on 106 degrees of freedom Multiple R-squared: 0.9271, Adjusted R-squared: 0.9216 F-statistic: 168.5 on 8 and 106 DF, p-value: < 2.2e-16
(The results of the classical assumption test are attached in the Appendix)
Table 6 shows the estimated fish production is positively significant related to 6 dependent variables, consist of: fingerling stocked (sign at 10%), Feed (sign at 1%), Cost of Production (sign at 5%), Number of Cages (sign at 5%), Labor (sign at 5%) and Feeding Time (sign at 1%). The increasing one unit of feed will increase fish production as much as 0.7798%, the addition one-time of feeding time will increase 0.1061% of fish production, the increasing one unit of each fingerling and cost of production will increase production as much as 0.0748%
respectively, an addition of one labor will increase production as much as 0.0644%, and an addition of one unit cage will increase 0.04631% of fish production.
Fish production in Cirata Reservoir has related to the socioeconomic factors
production in the study area. By this finding, it is revealed that fish production is related to the input factors than personal characteristics of farmers.
However, fish production in Cirata Reservoir does not have significant relationship with the location to build the cage. Although every district have different densities and amount of cages, farmers who lives in different areas do not have significant different in their production.
Water Quality and Fish Production
Principal Component Analysis (PCA) method could give information about the most important parameter in a complex water quality data. Based on result from Principal Component Analysis, there are 6 components had extracted and had grouped as follow:
Component 1 : Total Suspended Solid (TSS), Nitrite (NO2-), Turbidity, Dissolved Oxygen (DO)
Component 2 : Conductivity, Total Dissolved Solid (TDS), Nitrate (NO3- ), Temperature
Component 3 : Biological Oxygen Demand (BOD) Component 4 : pH, Carbon dioxide (CO2)
Component 5 : Bicarbonate (HCO3-), Phosphate (PO43-) Component 6 : Calcium Carbonate (CaCO3-)
The group of these components based on the highest variances in each parameter. Component 1-6 explained 21.662%, 17.258%, 13.494%, 10.612%, 9.685%, and 7.773% of the variance respectively. (All the measurement of Principal Component Analysis and the Scree Plot are attached in the Appendix).
Component 1 gives information about variation of TSS, Nitrite, Turbidity, and Dissolved Oxygen which is has the highest variances.
TSS (Total Suspended Solid) describes the number of materials which are suspended in the water. As the consequences, it will reduce the clarity of the water and increase the turbidity of the water. When the clarity of the water is decreasing, the sunlight penetration will limited and it will affects to the inhibition of photosynthesis process in the water. As a result, it may affect to the Dissolved Oxygen concentration in the water (Boyd & Tucker, 1998). TSS may result from many sources, such as uneaten feed, soil erosion, and contributes to sedimentation in the reservoir. The depletion of oxygen level in the water may threat aquatic life, especially fish. Many studies revealed that oxygen depletion in the water may stimulate fish kill occurrence when turnover in the reservoir occurs (Hamdan, Kari, Othman, & Samsi, 2012) .
To estimate clearly relationship between fish kill ratio and water quality, multiple linear regression was conducted as follows, Fish kill as dependent variables (Y) and water quality as independent variables (X),:
Table 7. Multiple Linear Regression between Fish Kill (Y) and Water Quality (DO and TSS)
Variables Paramete
r Coefficient Standard
Error t value P value
Intercept 0 126.714 176.474 0.718 0.504
Number of Cages/NOC (X1)
-0.004 0.013 -0.324 0.759
Dissolved Oxygen/DO (X2)
5.309 27.332 0.194 0.853
Total Suspended
Solid/TSS (X3) 3
0.882 0.1700 5.190 0.003 ***
Residual standard error: 67.69 on 5 degrees of freedom Multiple R-squared: 0.9161, Adjusted R-squared: 0.8489 F-statistic: 13.64 on 4 and 5 DF, p-value: 0.006716
Based on multiple linear regression result, only TSS has positively significant to the fish kill occurrences. In contrast, Dissolved Oxygen has not significant affecting to fish kill occurrence. According to the result, there is weakness to interpret the result of multiple linear regressions. In order to give more information about trend of fish kill and water quality, the trend both of dissolved oxygen and total suspended solid in bottom measurement are depicted below.
Fig16 Trend of Fish Kill Ratio and Water Quality in Cirata Reservoir
The graph show that the fish kill ratio and water quality has similar trend with TSS while DO has opposite trend with fish kill ratio. High concentration of TSS followed by high fish kill ratio, while low concentration of DO followed by high value of fish kill occurrence.
CHAPTER 6
DISCUSSION
Socioeconomics factors and fish production
According to the result, fish farming practice in the study area was no need specific or conceptual skills, because it includes technical skills, therefore anyone may take a part in the fish farming activity. It is revealed that education level of farmers has no significant relationship to the fish production. In addition, farmers with longer experience also do not have different production with the farmers who has shorter experiences. This finding consistent with the statement stated by De Silva, et al (2006) in (Mims & Onders, 2012), that fish farming practice in reservoir tend to need less technical skills and lower inputs of capital for begin the activity. Fish farming activity or reservoir ranching focused on water body utilization that mostly common pool property and has many utilization.
Based on the result, the most significant influence to the fish production is feed used by the farmers. The amount of fingerling stocked and feed used by farmers had been regulated by the Decree of West Java Governor No. 45/2003 which is regulated as follows:
Table 8. Regulated amount of fingerling stocked and feed used in Cirata Reservoir.
Regulated amount of Cianjur Purwakarta Bandung Barat Fingerling Stocked/crop
cycle
1,092 ton 928.8 ton 379.200 ton
Feed/crop cycle 12,012 ton 10,216.8 ton 4171.2 ton
In average, it is regulated to stock the fingerling (both Common carp and Nile tilapia) : 200kg/cages, and feed used : 2,2 ton per cage. However, based on this study, farmers stocked the fingerlings: 516kg/cages, and feed used: 3,6 ton per cage. Farmers tend to stocked more fingerling to avoid from losing caused by fish kill occurrences.
In case of production, high stocking density may result high yield in the cage. Huang, Lin, & Chiu, (2002) stated that stocking common carp at high stocking density have disadvantage to economic profit. Based on the study result, farmers tend to feed the fish manually to increase their production. It is revealed by the variables of feeding time and feed which is both have significant relation to the fish production. The more the farmer feed their fish the more they gain fish production. Abery, et.al (2005) in his research estimated that a maximum production in Cirata Reservoir is 25,375 ton/year.
Water Quality related to Fish Production
Uneaten feed, caused by the huge amount of feeding, may release to the water and contribute the nutrient loading into the water. The result of this study shows TSS, DO, Nitrite and Turbidity as the most variance water quality parameter in Cirata Reservoir may describe that suspended solid in the reservoir has influence to the fish farming activity, one of influences is indicated by fish kill occurrences. Basically, fish kill phenomenon in the reservoir have complex mechanism, however this study try to contribute to show the most water quality parameter which could describe environmental condition in Cirata Reservoir.
Fish kill occurrence in Cirata Reservoir may occur because of several factors. BPPT (2013) reported that fish kill occurrences in Cirata Reservoir related to the weather change, from dry to rainy season. The seasonal pattern of water circulation or called “turnover” within reservoir are important factors for maintaining the oxygen level for fish production. Cirata Reservoir as categorized eutrophic reservoir which has high organic load with high bacterial affect, may result negative impact and the result of low oxygen levels. Total Suspended Solid not only describes suspended material inside the water but also related to environmental condition outside the reservoir, such as soil erosion and industrial waste (Boyd & Tucker, 1998). Fish kill occurrence is one of the risks of fish production especially in the lake. Higher nutrient loading may become one of the causes, such as reported in the Lake Victoria, Africa and Lake Taal, Philipines.
Some farmers in Cirata Reservoir had already known the time of fish kill occurrence, usually in the weather change. Based on survey and interview, farmers can adapt to the fish kill occurrence by harvesting the fish earlier.
However, the event occurs incidentally, so that farmers could not deal with it and get loss. In fish farming practice, farmers tend to continue producing and unlimited their practice through season. The rule for stocking seems necessary to applied in Cirata Reservoir to avoid bigger loss in the future.
The finding of this study revealed that although many studies has already conducted and offered some management options, farmers tend to practice fish farming as usual. Utilization of reservoir as common property resources tend to
right to culture the fish and gain the benefit from public properties, in this case reservoir, which is also utilized for many purposes.
CHAPTER 7
CONCLUSION AND RECOMENDATION
In conclusion, this study stated that:
Fish production in Cirata Reservoir has related to both environmental factors, represented by water quality, and also socioeconomics factors. Fish production is mainly influenced by input factors, such as feed, fingerlings, cost of production, number of cages and feeding practice than personal background. Farmers tend to overstock and overused feed compare to the amount regulated. Farmers have understanding about the worsening of water quality in the study area but they have misperception how to deal with.
Based on the conclusion, this study suggests some recommendation as follows:
Cirata Reservoir needs Better Practice Management (BMP) to practice fish farming activity. Integrated Management between the stakeholders which has interested in Cirata Reservoir is necessary, such as implementation of enter-exit procedure and limitation of the fish stocked and number of cages is necessary to conduct, refers to available regulation. In addition, farmers have to actively take a part in the management of reservoir as the main user especially in fish farming practice.
REFERENCES
Abery, N., Sukadi, F., Budhiman, A., Kartamihardja, E., & Koeshendrajana, S.
(2005). Fisheries and Cage Culture of Three Reservoirs in West Java, Indonesia; A Case Study of Ambitious Development and Resulting Interactions. Fisheries Management and Ecology, 315-330.
Anonymous. (2007). Statistics West Java.
Ardi, I. (2012). Dynamic Model Predictive Control Sources Activities of Phosphorus (P) in The Reservoir in The Integrated and Sustainable : A Case Study Cirata Reservoir, West Java. Bogor: IPB.
Boyd, C. E., & Tucker, C. S. (1998). Pond Aquaculture Water Quality Management. Massachussets: Kluwer Academic Publisher.
BPPT. (2013). Kesiapan Perangkat Pendukung Operasionalisasi Sistem Peringatan Kematian Massal Ikan di Waduk Cirata. Jakarta: BPPT.
BPWC. (2011). Report of Floating Net Cage Aquaculture Inventarisation 2011 (Laporan Inventarisasi Keramba Jaring Apung Tahun 2011). Bandung: PT Pembangkitan Jawa Bali (PJB).
BPWC. (2012). Laporan Hasil Pemantauan Kualitas Air Waduk Cirata Triwulan III (Water Quality Monitoring Report of Cirata Reservoir 3rd Quarter).
Bandung: PJB.
Bunting, S. W. (2013). Principle of Sustainable Aquaculture. London and New York: Routledge Taylor and Francis Group.
Cahyono, B. (2001). Budidaya Ikan di Perairan Umum. Yogyakarta: Kanisius.
Carpenter, S., Chair, Caraco, N. F., Correll, D. L., Howarth, R. W., Sharpley, A.
N., et al. (1998). Nonpoint Pollution of Surface Waters with Phosphorus and Nitrogen. Washington DC: Ecological Society of America.
Chen, J., Guang, C., Xu, H., Chen, Z., Xu, P., Yan, X., et al. (2007). A Review of Cage and Pen Aquaculture : China. In M. Halwart, D. Soto, & J. Arthur, Cage Aquaculture - Regional Reviews and Global Overview (pp. 50-68, FAO Fisheries Technical Paper No. 498). Rome: FAO.
Conrad, R. (2004). Economic Encyclopedia 3rd Edition. New Castle: Wadsworth Inc p289.
Costa-Pierce, B. A., & Soemarwoto, O. (1990). Reservoir Fisheries and Aquaculture Development for Resettlement in Indonesia. Jakarta, Bandung, Manila: PLN, IOE, ICLARM.
Governor, W. J. (2011). Local Regulation of West Java Governor No. 7.
Hamdan, R., Kari, F., Othman, A., & Samsi, S. M. (2012). Climate Change, Socio-economic and Production Linkages in East Malaysia Aquaculture Sector. International Conference on Future Environment and Energy, Vol 28.
Huang, W.-B., Lin, Y.-C., & Chiu, T.-S. (2002). Effects of Stocking Density on Growth, Survival, Production and Size Variation of The Common Carp Cyprinus carpio Linnaeus (1758) Fry within Aquarium. Journal Fish Soc.
Taiwan, 29-41.
Kennedy, P. (1998). A Guide to Econometrics 6th Edition. MIT Press.
Kordi, M. G., & Tancung, A. B. (2007). Pengelolaan Kualitas Air dalam budidaya Perairan. Jakarta: Rineka Cipta.
Kurniawan, M., & Kustiasih, R. (2011). Kompas. Senja Kala Lumbung Ikan Citarum, p. 1.
Mazlum, N., Ozer, A., & Mazlum, S. (1999). Interpretation of Water Quality Data by Principal Component Analysis. Journal of Engineeing and Environmental Science, 19-26.
Mims, S. D., & Onders, R. J. (2012). Chapter 8 : Reservoir Ranching. In Aquaculture Production System First Edition Edited by :James Tidwell (pp. 158-171). John Willey & Son, Inc.
Mishra, A. (2010). Assesment of Water Quality Using Principal Component Analysis: A Case Study of River Ganges. ISSN 0204-3556 Technology and Chemistry Water (in Rusia Химия и технология воды), 32 No.4.
Nasir, M. F., Samsudin, M. S., Mohammad, I., Awaluddin, M. R., Mansor, M. A., Juahir, H., et al. (2011). River Water Quality Modeling Using Combined Principle Component Analysis (PCA) and Multiple Linear Regression (MLR) : A Case Study at Klang River, Malaysia. World Applied Sciences Journal, 73-82.
Sembiring, S. (n.d.). Water Quality in Three Reservoirs on Citarum River, Indonesia. Institute of Water Resources Development.
Shlens, J. (2005). A Tutorial of Principal Component Analysis. San Diego:
University California.
Silva, S. S., & Phillips, M. J. (2007). A Review of Cage Aquaculture : Asia (excluding China). In M. Halwart, & D. S. Arthur, Cage Aquaculture - Regional Reviews and Global Overview (pp. 18-48 FAO Fisheries Technical Paper No. 498). Rome: FAO.
W. Petersen, L. B. (2001). Process Identification by Principal Component Analysis of River Water-Quality Data. Elsevier Ecological Modelling, 193-213.
Zainal, S. (Undated). FAO Corporate Document Repository : Inland Fishery Enhancement. Implementation of Extension for Net-Cage Aquaculture in Indonesian Reservoirs : Pitfalls and Prospects.