DISCUSSION PAPER No.161
研究費属性と大学の技術開発の関係について
Funding Sources and the Academic Contribution to Technological Knowledge Development:
Evidence from Japan
2018 年 10 月
文部科学省 科学技術・学術政策研究所 第 1 研究グループ
カン ビョンウ 元橋 一之
本 DISCUSSION PAPER は、所内での討論に用いるとともに、関係の方々からの御意見を頂くことを 目的に作成したものである。
また、本 DISCUSSION PAPER の内容は、執筆者の見解に基づいてまとめられたものであり、必ず しも機関の公式の見解を示すものではないことに留意されたい。
The DISCUSSION PAPER series is published for discussion within the National Institute of Science and Technology Policy (NISTEP) as well as receiving comments from the community.
It should be noticed that the opinions in this DISCUSSION PAPER are the sole responsibility of the author(s) and do not necessarily reflect the official views of NISTEP.
【執筆者】
カン ビョンウ 一橋大学イノベーション研究センター 専任講師
文部科学省科学技術・学術政策研究所 客員研究官
元橋 一之 東京大学大学院工学系研究科 教授
文部科学省科学技術・学術政策研究所 客員研究官 独立行政法人経済産業研究所 ファカルティフェロー
【Authors】
Byeongwoo Kang Assistant Professor, Institute of Innovation Research, Hitotsubashi University Affiliated Fellow, National Institute of Science and Technology Policy (NISTEP),
MEXT
Kazuyuki Motohashi Professor, Graduate School of Engineering, The University of Tokyo
Affiliated Fellow, National Institute of Science and Technology Policy (NISTEP), MEXT
Faculty Fellow, Research Institute of Economy, Trade and Industry (RIETI)
本報告書の引用を行う際には、以下を参考に出典を明記願います。
Please specify reference as the following example when citing this paper.
カン ビョンウ・元橋一之 (2018) 「研究費属性と大学の技術開発の関係について」,NISTEP DISCUSSION PAPER,No.161,文部科学省科学技術・学術政策研究所.
DOI: http://doi.org/10.15108/dp161
Byeongwoo Kang and Kazuyuki Motohashi (2018) “Funding Sources and the Academic Contribution to Technological Knowledge Development: Evidence from Japan,” NISTEP DISCUSSION PAPER, No.161, National Institute of Science and Technology Policy, Tokyo.
DOI: http://doi.org/10.15108/dp161
研究費属性と大学の技術開発の関係について
文部科学省 科学技術・学術政策研究所 第1研究グループ カン ビョンウ 元橋 一之
要旨
大学はイノベーションを起こす重要な主体の一つである。長い間、科学技術開発に対する大学の貢 献は、政府機関から交付される研究費によって支えられてきた。しかし、近年、交付型研究費が減少 し、結果的に大学は産業等からの外部研究費への依存度を高めている。しかし、既存の研究からは そのような研究費依存度のシフトが大学で行われている研究活動に与える影響についてはあまり知ら れていない。本研究では、大学に与えられる研究費が大学発明特許に及ぼす影響を調査している。
具体的には、本論文では、大学発明を支える研究費を運営費交付金から割り当てられる研究費、企 業から受ける研究費、競争的研究資金の 3 つに分け、それらが大学発明の「先駆的特許」と「普及度」
の 2 つの指標に対して与える影響を分析する。日本を事例として、特許データベースと他のデータベ ースを組み合わせたデータセットを用いる。分析から、競争的研究資金は「先駆的特許」を生み出す 可能性が最も高いのに対し、企業からの研究費は「先駆的特許」を生み出す可能性が最も低いことが 分かった。対照的に、競争的研究資金から生まれた大学発明は普及効果が最も低いが、企業から受 けた研究費から生まれた大学発明は普及効果が最も高いことが分かった。本分析結果は、大学に投 入される研究費の在り方についてインプリケーションを与える。
Funding Sources and the Academic Contribution to Technological Knowledge Development: Evidence from Japan
First Theory‐Oriented Research Group, National Institute of Science and Technology Policy (NISTEP), MEXT
Byeongwoo Kang and Kazuyuki Motohashi ABSTRACT
Universities are an important actor for innovation. Their contributions to technological and scientific knowledge development have been supported by block funding from the government for a long time. However, recent years we observe that block funding has declined and universities have consequently increased their reliance on industry funding.
Sometimes decreased government block funds are replaced with competitively funds.
However, consequences of such shifts have not been addressed. The current study investigates the impacts of academic research funding sources on academic patents. We measure the impacts with two indicators—creation of a progenitor invention and diffusion—, and classify funding sources into three types—block, industry, and competitive. Focusing on Japan as a case, we use a unique dataset that combines a patent database with other databases.
We find that competitive funding is the most likely to produce progenitor inventions while industry funding is the least likely to produce progenitor inventions. By contrast, inventions produced from competitive funding are the least likely to diffuse while industry funding those produced from industry funding are the most likely to diffuse. Our findings provide implications on consequences of replacement of block funding with industry funding and competitive funding.
[空白のページ]
概要
1. 背景・目的
大学はイノベーションを起こす重要な主体の一つである。長い間、大学による科学技術 開発への貢献は、政府機関から交付される研究費によって支えられてきた。しかしながら、
近年、交付型研究費が減少し、結果的に大学は外部からの研究費、特に企業からの外部研 究費への依存度を高めている。
これまで,交付型研究費の減少が大学の研究活動に与える影響等について議論が行われ てきた。しかしながら、外部研究費が増える現状や大学によるイノベーション活動が活発 になる現状を踏まえ、研究費の属性が大学のイノベーション活動に与える影響を包括的に 議論されたことはなかった。
そこで、本研究では、大学の研究費の属性が大学のイノベーション活動に与える影響に ついて実証分析を行う。大学によるイノベーション活動のうち、本研究では大学発明特許 に注目する。具体的に、大学発明を支える研究費を「政府から交付された研究費」、「企 業からの研究費」、「競争的研究資金」の3つに分類し、それらが大学発明の「先駆的発 明」と「普及度」の2つの指標に対して与える影響を分析する。本研究で想定している分 析対象の位置づけを概要図1に示す。
概要図1 本研究で想定している分析対象の位置づけ
2. データ・分析方法
本研究の分析対象は、日本の大学発明特許である。主なデータソースである「IIP パテ ントデータベース(知的財産研究所)」から出願人が大学名で登録されてある特許データ を抽出した。
上記のデータを用いて回帰分析を行った。被説明変数のうち、「先駆的特許」を「技術
軌跡 (technological trajectory) の始祖となる特許」とし、後方引用がないまま登録された特
許を1とするダミー変数として定義した。また、被説明変数のうち,「普及度」は「後発 発明に与えた影響度」とし、出願年度と技術分野で正規化した前方引用数により定義した。
説明変数は、「企業からの研究費」と「競争的研究資金」であり,それぞれダミー変数と して定義する。具体的に,大学発明特許の中で、特許の出願人に企業が含まれる特許デー
Basic research Applied research
KAKENHI
(Grants‐in‐Aid for
Scientific Research) Block funding
Industry funding
Introduced to encourage scientific research
Average funding per proj.: ~33 kUSD
Basic research allowance for academic researchers
Can be consumed as a recipient wishes (for basic research and for application research)
The average funding per prof. is <10 kUSD.
Increasing lately
Aimed for applied research (for commercialization)
Average funding per proj.: ~21 kUSD
タを1にした変数を「企業からの研究費」、科研費データベース上で研究成果に登録され ている特許データを1にした変数を「競争的研究資金」として定義した1。コントロール 変数は、過去の産学連携経験者ダミー、発明者数、請求項数、研究大学ダミー、技術分野 ダミー、及び出願年ダミーを考慮した。
3. 本研究の分析結果とその政策的含意
本研究で得られた主な分析結果は次のようにまとめられる。まず、「競争的研究資金」
は「先駆的発明」を生み出す傾向が最も高いが、「普及度」が最も低い。次に、「企業か らの研究費」は「競争的研究資金」と正反対の結果を示した。つまり、「企業からの研究 費」は「先駆的発明」を生み出す傾向が最も低いが、「普及度」が高い。最後に、「政府 から交付された研究費」は両者のバランスを取る傾向があることが分かった。
上記の分析結果から得られる政策的含意を要約すると、次のようにまとめられる。第 1 に、「競争的研究資金」の役割の重要性である。「先駆的発明」の高い研究成果は、新し い技術軌跡を作り、新しいパラダイムを創り出す潜在性がある。しかし、企業はものにな りそうなもの、つまり技術軌跡がある程度出来上がっていて、成功が保証されやすいもの に取り組むインセンティブがあるが、萌芽的技術に取り組むインセンティブは少ない。そ のため、「先駆的発明」において「競争的研究資金」が果たす役割は重要である。
第 2 に、運営費交付金削減による負の影響である。2004 年の国立大学の法人化以降、
運営費交付金が削減されており、大学が外部からの研究費、特に、企業からの研究費を求 めるようになっている。そのシフトの結果として、大学によるイノベーション活動の成果 の先駆性が低くなることが懸念される。そのような事態が発生しないように、萌芽的技術 を継続して生み出し、管理できるようにする必要がある。
1本研究で扱う競争的資金は,日本学術振興会 (JSPS) による科学研究費助成事業(科研費)に限られる。し たがって,本研究の結果が競争的資金全般の特徴だけではなく,科研費に特有の制度の影響を受けているこ とに留意が必要である。
Funding sources and the academic technology development: Evidence from Japan
Byeongwoo Kang 1, 3 and Kazuyuki Motohashi 2, 3
1 Institute of Innovation Research, Hitotsubashi University, Naka 2-1, Kunitachi City, Tokyo 186-8603, Japan
2 Department of Technology Management for Innovation, The University of Tokyo, Hongo 7-3-1, Bunkyo ku, Tokyo 113-8654, Japan
3 National Institute of Science and Technology Policy, Kasumigaseki 3-2-2, Chiyoda ku, Tokyo 100-0013, Japan
Abstract: Universities are an important actor for innovation. Their contributions to technological and scientific knowledge development have been supported by block funding from the government for a long time. However, recent years we observe that block funding has declined and universities have consequently increased their reliance on industry funding. Sometimes decreased government block funds are replaced with competitively funds. However, consequences of such shifts have not been addressed. The current study investigates the impacts of academic research funding sources on academic patents. We measure the impacts with two indicators—creation of a progenitor invention and diffusion—, and classify funding sources into three types—block, industry, and competitive. Focusing on Japan as a case, we use a unique dataset that combines a patent database with other databases. We find that competitive funding is the most likely to produce progenitor inventions while industry funding is the least likely to produce progenitor inventions. By contrast, inventions produced from competitive funding are the least likely to diffuse while industry funding those produced from industry funding are the most likely to diffuse. Our findings provide implications on consequences of replacement of block funding with industry funding and competitive funding.
Keywords: Technological trajectory; research funding; academic patents; Japan
JEL classification: O30; I28; H40
1. Introduction
Academia has been attracting attention from scholars, as universities are an important actor in the national innovation system (Nelson, 1993). Universities are most conducive to creating new scientific knowledge, and have consequently been regarded as contributors to both technological and scientific knowledge development.
Innovation activities in academia have been supported by various funding sources, which can be roughly classified as block funding from the government, industry funding, and competitive funding. However, government funds for universities have decreased since the early 2000s (Geuna & Nesta, 2006). As the government is one of the largest sources of funds for universities, this decline in government block funds has compelled universities to look at other revenue sources.
The consequences of such efforts have resulted in a rapid increase in not only patent applications (Colyvas et al., 2002; Sampat, 2006; Geuna & Rossi, 2011), but also university-industry collaborations, or “UICs” (Lee, 2000; Perkmann et al., 2013), thereby replacing decreased government block funds with competitively funds (Geuna, 2001).
The current study’s research question involves how different types of academic research funding contribute to the development of technological trajectories. This question is based on a
“funding effect” (Krimsky, 2012), which refers to bias in research activities caused by ties with the funding source. Bias can occur in the selection of a research method, data collection, data analysis, or the interpretation of results. While the original funding effect concept challenged the research activity’s reliability, the current study simply focuses on how funding sources impact research characteristics and their outcomes. As will be reviewed in the next section, this paper assumes that the individual nature of each funding source determines the characteristics of research outcomes.
This study attempts to answer the research question by using academic patents, and focuses on Japan as an example. Academic patents are primarily incorporated because patent citations are often used to map technological trajectories (Verspagen, 2007). Further, three reasons exist for focusing on Japan. First, and as the following section will elaborate, most universities in Japan rely on these three funding sources. Second, Japanese universities’ patent applications have increased since 2004 (Center for National University Finance and Management, 2008). This allows us to investigate how academic contributions have led to the development of a technological trajectory. Third, the necessary data can be easily obtained. This paper answers its research question with a unique dataset that combines a patent database with other databases.
The current study provides two contributions to the field. First, it focuses on a technological trajectory’s evolutionary process through academic funding. The current study compares the effects of funding on the development of a technological trajectory among block, industry, and competitive funding, as well as their outcomes. Although many prior studies have investigated academic funding’s impacts, they either focused on only one type of academic funding source, or
only compared two funding types. The only paper that has an approach similar to the one adopted by the current study is that of Guerzoni et al. (2014), which investigated how block, industry, and government funding affected academic patent outcomes. However, their study was limited, although admittedly insightful, as they focused only on the originality of academic patent outcomes. Thus, our study contributes new knowledge to their study.
The current study’s second contribution involves providing insights regarding the Japanese academic system. Most prior studies on academic funding systems and publications’ and patents’
research performance were concentrated in the United States and Europe (Geuna & Martin, 2003;
Gulbrandsen & Smeby, 2005; Goldfarb, 2008; Himanen et al., 2009; Tammi, 2009; Auranen &
Nieminen, 2010; Muscio et al., 2013; Hottenrott & Lawson, 2017). Hence, not much is known regarding Japan in this context. As previously mentioned, more than a decade has passed since Japanese universities experienced substantial reforms. One such case involves the introduction of a Japanese version of the Bayh-Dole Act, which has significantly increased academic patenting in Japan since 2004. As outcomes from the new policy are available and large enough to empirically analyze, this is the proper moment to review the results of this policy change.
The remainder of this paper is structured as follows. Section 2 reviews the literature on which the current study is based, and establishes the hypotheses to test in the current study. Section 3 explains the research data, and Section 4 presents our data analyses. Section 5 discusses the findings, and concludes with remarks on this study’s policy implications and limitations.
2. Literature review and hypothesis
This section reviews the academic funding system, particularly in the Japanese context. We establish our hypotheses based on this theoretical development.
2.1 Academic funding
The current study investigates how different types of academic research funding affect research outcomes. This subsection reviews prior studies on the topic. As the academic funding system, methods, and environments vary among countries (Geuna & Martin, 2003; Himanen et al., 2009; Auranen & Nieminen, 2010), it is difficult to harmonize all academic research funding sources. Nonetheless, prior studies have studied roughly three research funding sources in a university setting: (1) block funding, (2) industry funding, and (3) competitive funding. Each funding source differs from the others in many aspects.
First, block funding is funded by the government, and aims to be conducive to new scientific research with less pressure for immediate, tangible results. Thus, block funding supports stable, long-term research, and has the largest degree of freedom for research: for example, a research project can start when a researcher wants to initiate it, in any direction that the researcher prefers.
Even if a current block-funded research project ultimately results in an error, the next year’s block funding is guaranteed. Errors and failures are largely allowed as a part of the experience and in training the next generation of researchers. The allocation of block funding is justified, as scientific research aims to benefit both people and the nation (Bush, 1945). However, the research field is limited to topics that the researcher is aware about and can access.
Industry funding is subsidized by the private sector and is often observed in university- industry collaborations (Lee, 2000; Perkmann et al., 2013). Further, industry funding has a clear purpose in terms of industrial usage and applications (Blumenthal et al., 1996; Gulbrandsen &
Smeby, 2005). Hence, an industry-funded project’s direction is largely led by the funder.
Research members are often a combination of academic and industrial researchers, which allows for the continuous exchange of ideas with an industry, such as feedback from research practices (Van Looy et al., 2006). In this sense, industry funding can cover broader knowledge than block funding. However, equal opportunities for industry funding do not exist for all academic researchers; these opportunities are typically concentrated in prestigious research groups and universities, which the industry can easily discover (Hemmert et al., 2014). If an industry-funded project concludes with successful outcomes, the researcher is likely to eventually embark on additional industry-funded projects sponsored by the same source. Research outcomes are often protected as patents as the first choice (Lawson, 2013), and publication is allowed conditionally.
Such a decision consequently decreases publications by researchers who maintain ties with the industry (Goldfarb, 2008).
Competitive funding is a competition-based fund from the public sector (Tammi, 2009;
Hottenrott & Lawson, 2017), and is introduced to rectify failures in research systems (Geuna, 2001). This funding type is anticipated to increase research efficiency and result in superior outcomes by awarding funds to the best-performing researchers. Accordingly, competitive funding provides an incentive for better research performance, and sometimes reflects funders’
strategic intentions to improve current innovation performance and develop new academic fields.
Researchers must conduct research projects that satisfy the funder’s intentions, and only qualified projects are chosen through peer reviews. The direction of a competitively funded project cannot be perceived to be as dynamic as block funding, as peer reviewers may sometimes suppress unorthodox ideas (Boudreau et al., 2016). Additionally, as with industry funding, competitive funding is not always equally bestowed upon all researchers. Researchers with past superior achievements tend to receive more competitive funding than those with fewer achievements (Stephan, 2012).
2.2 The academic funding system in the Japanese context
This subsection describes the academic funding system in Japan as well as Japanese university systems. Research funding in Japanese universities can roughly be attributed to three
sources. Since the implementation of the National University Corporation Law in 2004, the Japanese university system has changed significantly (Oba, 2007); our main discussion is developed based on the post-2004 situation.
2.2.1 Block funding
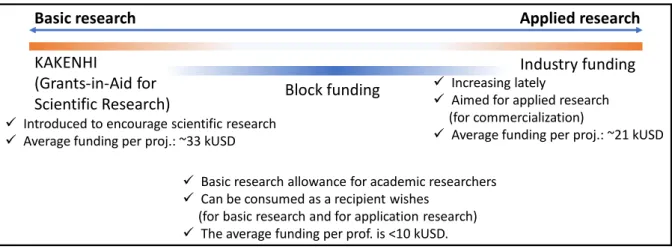
The first funding source is block funding from the government. The Japanese national university system before its incorporation in 2004 was often modeled on the German chair system, in which a “chair” typically consisted of a full professor and assistant, or associate professors (Wang et al., 2018). In general, a certain amount of the block-funded budget was allocated to each chair, and each chair managed its research group within the budget. However, since 2004, the Japanese system has become different from the German chair system , in that the block fund is allocated to each professor, whether full, associate, or assistant. All professors regardless of their rank are independent and have autonomous research activities. This block funding is used for research as well as to pay the salaries of all faculty and staff; teaching; the maintenance costs for the university’s buildings and facilities; utilities; and operating costs. The research allowance per person from block funding varies by the university type, rank, and academic field (Figure 1), and ranges between thousands and tens of thousands of US dollars. Most professors under any criteria receive less than 10 thousand USD from block funding for their research, and each recipient can freely decide whether to use their block funding to conduct fundamental or applied research.
The block funding research allowance can be spent freely, as per the recipient preference. If a recipient wishes to conduct fundamental research, the funding can be used to support this research in the long term. Further, if the recipient wants to conduct short-term applied research aimed toward commercialization, the funding can be spent on commercialization activities. Block funding is considered a basic subsidy to conduct fundamental research on prior studies, but in the context of Japan, how to judge each block fund depends on each recipient.
Figure 1. Research allowance per person from block funding2
2 “Questionnaire on actual status of individual research expenses (Outline of survey results)”
reported on August 1st, 2016. available at
http://www.mext.go.jp/b_menu/shingi/gijyutu/gijyutu4/037/shiryo/__icsFiles/afieldfile/2016/0 8/16/1375827_04.pdf (Last accessed on April 27th, 2018)
(a) all
(b) per university type
(c) per rank
(d) per academic field
2.2.2 Industry funding
The second funding source is industry. Table 2 and Table 3 display recent funding revenues from industries to Japanese universities. Table 2 reveals that the revenues from UICs have increased for any university type, which can be attributed to various UIC policies. Table 1 reviews the history of UIC promotion policies in Japan since 1995. These policies are aimed at promoting UICs with the belief that technology transfers from universities can drive further innovation in
high-tech industries (Motohashi & Muramatsu, 2012). As academic patenting is one method to facilitate technology transfers from universities (Arora et al., 2001), reforms relevant to academic patenting were enacted in Japan.
Table 1. History of UIC promotion policies in Japan
Year Action 1995 Formulation of the Basic Act on Science and Technology
→ Formulation of Science and Technology Basic Plan
1998 Formulation of the Act on the Promotion of Technology Transfer from Universities to Private Industry (the TLO Act)
→ Promoted the establishment of TLOs (Technology-Licensing Organizations) 1999 Creation of the Small Business Innovation Research Program (“Japanese SBIR”)
Formulation of the Act on Special Measures for Industrial Revitalization
→ Japanese version of the Bayh-Dole Act; licensing fee halved for approved TLOs
Establishment of the Japan Accreditation Board for Engineering Education 2000 Formulation of the Industrial Technology Enhancement Act
→ Enabled the free use of national university facilities by approved/certified TLOs, and allowed university researchers to serve concurrently as TLO directors, board directors of companies commercializing research results, and statutory auditors of stock corporations
2001 “Hiranuma Plan” announced as a “plan for a thousand university-originated ventures in three years”
2002 The first University-Industry-Government Collaboration Promotion Meeting 2003 Formulation of the Intellectual Property Basic Act
→ Obligated universities to voluntarily and actively seek to develop human resources,
research activities, and disseminate research results
Amendment of the School Education Law
→ Created special emphasis on graduate school systems and increased flexibility in establishing university faculties/departments
The first Industry-University-Government Collaboration Contributor Commendation
→ Established a Prime Minister Prize to honor achievements in excellent, successful cases that significantly contributed to promoting university-industry- government collaborations
2004 Implementation of the National University Corporation Law
→ Status of university researchers: “non-civil servant type” capital contributions to approved TLOs
Implementation of an act to partially revise the Patent Act
→ Revision of patent-related charges relating to universities and TLOs 2005 Achievement of 1,000 university-originated ventures (1,112 firms) 2006 Revision of the Fundamentals of Education Act
→ Clarified “Contribution to Society (university-industry-government collaborations, etc.)” as a role of universities
Since
2008 Establishment of advanced innovation, technology-bridging, and various clusters
→ Established facilities in which universities, industries, and the government can closely collaborate
2013 Establishment of the Industrial Competitiveness Enhancement Act
→ National universities can invest in venture capital, among other functions.
Source: “History of university-industry-government collaboration,” translated from the Ministry of Economy, Trade, and Industry’s website.3
Table 3 illustrates other types of industry funding, such as contract research, clinical trials, and license revenues from academic intellectual property rights; this indicates that all types of industry funding sources have generally increased. Table 2 and Table 3 imply that UICs have become increasingly active in Japan each year (Motohashi, 2005). The average funding from UIC projects and contract research was approximately 2.11 million Yen (= 64.12 billion Yen / 30,340) per project in 2016. Therefore, the research budget per project from industry funding is also similar to block funding.
Table 2. Funding from UIC projects and contract research (unit of fund: billion Yen) National
University
Public University Private University Total Year # of
projects
Fund # of
projects
Fund # of projects
Fund # of projects
Fund 2011 14,578 29.40 1,621 2.29 5,863 10.41 22,062 42.10 2012 15,036 30.80 1,690 2.19 6,357 10.85 23,083 43.83 2013 15,802 34.85 1,774 2.47 6,982 12.25 24,558 49.57 2014 16,631 37.68 1,968 2.73 7,424 12.26 26,023 52.69 2015 18,041 40.62 2,024 3.15 7,901 13.91 27,966 57.68 2016 19,717 45.11 2,121 3.69 8,502 15.33 30,340 64.12 (Source4: MEXT Report. “FY2017 on Academic-Industry Partnership Activities at Universities,”
reported on February 16th, 2018.)
Table 3. Total industry funding (unit of fund: billion Yen)エラー! ブックマークが定義されて いません。
Year UIC Contract research
Clinical trials, etc.
Intellectual property rights
Sum
2011 33.43 8.67 15.16 1.71 58.97
2012 34.15 9.68 16.81 2.20 62.84
2013 39.02 10.54 17.21 2.74 69.51
2014 41.60 11.07 15.19 2.62 70.49
2015 46.72 10.96 15.24 3.50 76.41
2016 52.56 11.56 17.08 3.55 84.75
(Source3: MEXT Report. “FY2017 on Academic-Industry Partnership Activities at Universities,”
reported on February 16th, 2018.)
3 http://www.meti.go.jp/policy/innovation_corp/sangakukeifu.html (last accessed on April 19th, 2018)
4 Available at http://www.mext.go.jp/a_menu/shinkou/sangaku/1397873.htm (Last accessed on April 27th, 2018).
Accordingly, industry funding cannot be utilized as freely as block funding. As industry funds are intended for applied research aimed to promote commercialization and industrial usage, the funds must be utilized for applied research, and cannot be used for fundamental long-term research.
2.2.3 Competitive funding
The third revenue source is competitive funding, and many competitive funding sources in Japan focus on various objectives. However, the largest competitive funding source in Japan has been the Grants-in-Aid for Scientific Research, or “KAKENHI” (Shibayama, 2011), which accounts for a majority of all competitive funds in Japan and is also a focus of this study.
A competitive research funding program, the KAKENHI is designed to encourage all types of scientific research, both basic and applied, ranging from the humanities and social sciences to the natural sciences. The grants financially support creative, pioneering research projects expected to contribute to, and provide a foundation for scientific and societal development. These research projects are selected using a peer review-screening process, in which multiple researchers with fields of specialization close to that of the applicants screen all submissions.
Various grant programs exist depending on the objective and nature of the research. The KAKENHI program was initiated in 1939, and has been administered by the Ministry of Education, Culture, Sports, Science and Technology (MEXT) for most of its history. Beginning in 1999, some functions of the KAKENHI program have been transferred from MEXT to the Japan Society for the Promotion of Science (JSPS), which will eventually assume responsibility for the remaining functions. As Table 4 indicates, the average KAKENHI funding per project in 2017 was approximately 3.30 million Yen—or (52.54 + 4.62 + 15.94 + 10.52) / (13,578 + 1,911 + 6,883 + 2,941)—per project.
Table 4. KAKENHI funding (unit of fund: billion Yen)5 National
University
Public University Private University Miscellaneous* Year # of
projects
Fund # of projects
Fund # of projects
Fund # of projects
Fund
2011 15,190 60.49 1,877 5.06 6315 16.26 2,788 10.91
2012 14,290 55.82 1,907 5.12 6167 15.69 2,754 9.87
2013 13,765 45.22 1,760 4.38 6119 13.95 2,795 8.76
2014 14,521 52.28 1,921 4.57 6637 14.82 2,924 9.66
2015 14,623 53.03 1,896 4.37 6825 14.69 3,038 10.56
2016 14,610 53.33 1,959 4.80 7037 15.63 3,070 10.58
2017 13,578 52.54 1,911 4.62 6883 15.94 2,941 10.52
5 Authors’ arrangement, from the Japan Society for the Promotion of Science’s website https://www.jsps.go.jp/j-grantsinaid/27_kdata/index.html (Last accessed on April 27th, 2018).
*“Miscellaneous” includes public research institutes, private research institutes, and independent researchers.
As previously mentioned, the KAKENHI aims to promote scientific research, or activities to expand human knowledge by discovering new fundamental principles and laws that explain all phenomena occurring in nature, humanity, and society. Accordingly, research projects funded by the KAKENHI are curiosity-driven, and this competitive funding in Japan supports fundamental, long-term research more than block funding.
Based on the Japanese context, Figure 2 illustrates the research supported by each funding source. The KAKENHI supports the most fundamental research, and industry funding supports the most applied research. As recipients of block funding have the largest degree of research freedom, this funding is positioned between the KAKENHI and industry funding.
Figure 2. Research supported by each funding source in Japan
2.3 Hypothesis
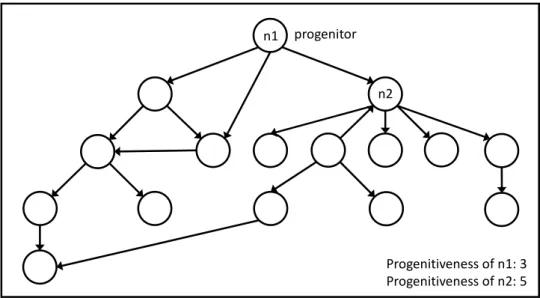
Dosi (1982) refers to a technological paradigm as a model and pattern of solutions for selected technological problems, based on selected principles from the natural sciences and select material technologies. Technologies under such a paradigm develop in certain directions that the paradigm largely governs; this development is the technology’s trajectory. Further, the development of a technological trajectory depends on two components. One is the emergence of the first invention, which this paper calls a “progenitor” invention, and the other is the degree of diffusion, which this paper calls “progenitiveness.” The progenitor invention is the technological solution based on scientific knowledge, and does not rely on any other technological knowledge.
An invention with significant progenitiveness creates the technological trajectory’s direction.
We consider a case involving the development of the steam engine (Nuvolari, 2004), which has a scientific basis in the use of atmospheric pressure. Based purely on scientific knowledge, many attempts had been made to develop steam engines, which can be considered progenitor
Basic research Applied research
KAKENHI
(Grants‐in‐Aid for
Scientific Research) Block funding
Industry funding
Introduced to encourage scientific research
Average funding per proj.: ~33 kUSD
Basic research allowance for academic researchers
Can be consumed as a recipient wishes (for basic research and for application research)
The average funding per prof. is <10 kUSD.
Increasing lately
Aimed for applied research (for commercialization)
Average funding per proj.: ~21 kUSD
inventions. Some of these progenitor steam engines were abandoned soon after their creation, while others developed various trajectories, whether long or short, or broad or narrow. A critical change in the steam engine’s technological trajectory occurred with James Watt’s steam engine, as this invention improved upon Thomas Newcomen’s steam engine by enhancing the possibilities to apply steam as a universal power source in the emerging manufacturing industry (Verspagen, 2007). Although Watt’s invention was not a progenitor invention, it exhibits a substantial degree of progenitiveness.
Figure 3. Example of a technological trajectory
Thus, we develop hypotheses regarding the “progenitor” and “progenitiveness” concepts.
The first criterion involves the progenitor invention, which is an attempt to solve technological problems with purely scientific knowledge, and does not rely on any past or current inventions.
Essentially, the progenitor invention is dissimilar from prior and from current inventions, and does not necessarily influence future inventions. Further, such inventions can be created in a proper research environment. To create a progenitor invention, academic researchers must have a technological problem to solve, and can experiment with new thoughts without limiting them under conventional conditions, while challenging uncertainty. Clearly, a long-term investment must be guaranteed to continue new trials, regardless of errors.
On the one hand, competitive funding that supports scientific research in our context provides a long-term research investment, sets no conditions for outcomes, and tolerates failure better than block and industry funding. On the other hand, industry funding by nature is far from a long-term investment, sets conditions for its outcomes, and has the least tolerance for failure. Thus, we assume that competitive funding provides a suitable environment for creating progenitor inventions, while industry funding does not. Accordingly, we set a hypothesis as follows:
n
1 progenitor n1
n2
Progenitiveness of n1: 3 Progenitiveness of n2: 5
H1-1: Competitive funding is likely to produce more progenitor inventions than the other funding types.
H1-2: Industry funding is likely to produce less progenitor inventions than the other funding types.
The second criterion is an invention’s progenitiveness; as can be observed from James Watt’s case, a progenitor invention is not necessarily progenitive. Progenitiveness is a knowledge- diffusion process that involves selection. When diffusing, knowledge passes a researcher network selection stage, and when this knowledge is accepted, it develops technological trajectories through improvement. Otherwise, new knowledge remains abandoned, and fails to develop technological trajectories. Further, knowledge must travel in researcher networks to be progenitive. Knowledge must also be embedded in a large, extended social network, as this embedded knowledge diffuses better than knowledge outside such a network (Fleming, 2007).
In our context, industry funding has a network important for knowledge to be embedded. As a patent outcome aims at industrial usages, it is critical for the patent outcome to be embedded in a network connected to the industry. Meanwhile, competitive funding that primarily supports academic research is far from the industry network. Therefore, we assume that competitive funding does not provide a proper environment to create inventions with substantial progenitiveness, while industry funding does. Accordingly, we set the following hypothesis:
H2-1: Competitive funding is less likely than other funding types to produce progenitive inventions.
H2-2: Industry funding is more likely than other funding types to produce progenitive inventions.
3. Data
This section explains how we constructed our dataset. Our analysis primarily used the IIP Japanese patent database (Goto & Motohashi, 2007) to retrieve academic patent data in Japan.
We used three additional databases to generate a unique dataset for our regression analysis: the KAKENHI database, the Japanese inventor disambiguation database, and THE-QS World University Ranking.
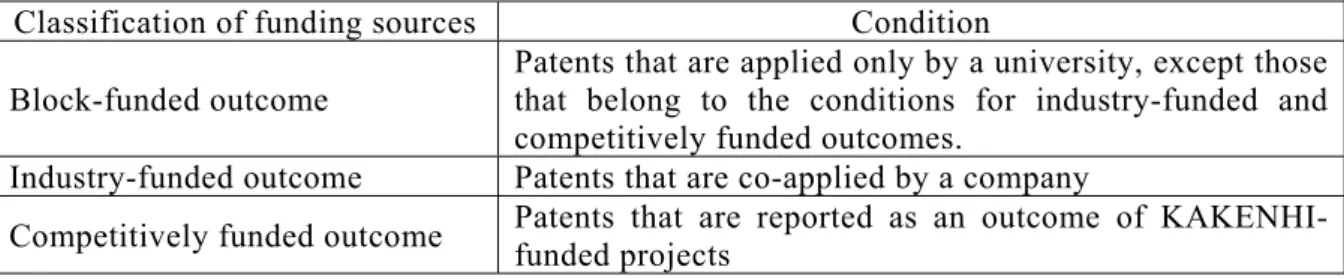
We constructed the dataset for our analysis by identifying academic patents through a search of patent applicants that include universities, then identified each academic patent’s funding source. The first classification is industry-funded patent outcomes; a patent is classified as an outcome of an industry-funded project if its co-applicants include a company. The second classification is competitively funded patent outcomes. A patent is classified as such if it is an outcome of a project funded by KAKENHI. As previously mentioned, the KAKENHI is the major competitive funding source for academic researchers in Japan to continue their research activities
(Nishizawa et al., 2007; Shibayama, 2011). We used a publicly available database6 of KAKENHI- funded projects to search the full list of patent outcomes reported in KAKENHI-funded projects.7 The last classification is block-funded patent outcomes, and we classified the remaining patents as block-funded. Table 5 summarizes the results from this classification.
We confirmed that our classification is acceptable due to the share of patent outcomes for each funding source (Figure 6), which nearly matched other sources in Japan, such as surveys to TLOs and official documents from the Japanese government.8
Table 5. Classification method of funding sources Classification of funding sources Condition Block-funded outcome
Patents that are applied only by a university, except those that belong to the conditions for industry-funded and competitively funded outcomes.
Industry-funded outcome Patents that are co-applied by a company
Competitively funded outcome Patents that are reported as an outcome of KAKENHI- funded projects
Table 6 displays the retrieved dataset.
Table 6. Data summary
Patent type Number of observations
Patents by Japanese universities 26,437
Of which, block-funded patents 9,262
Of which, industry-funded patents 13,449
Of which, competitively funded patents 3,726
Our analysis only focuses on patent outcomes, applicants of which include universities. We are aware of patent outcomes before the National University Corporation Act in 2004 in which the applicants are inventors and not their affiliations (Appendix B). However, we do not use these patent outcomes in our analyses for two reasons. First, no inventors applied for patent outcomes in the KAKENHI documents. Figure 4 indicates the number and share of KAKENHI-funded projects that reported patent outcomes, and it can be observed that major patent outcomes began
6 Grants-in-Aid Scientific Research Database (the KAKEHNHI database): https://kaken.nii.ac.jp/en/
7 As the patent outcomes from KAKENHI-funded projects are declared by researchers, concerns might exist regarding an excessive disclosure of their outcomes (reporting patent outcomes produced from other sources as outcomes of KAKENHI-funded projects). Appendix A analyzes this issue, and we assume that excessive disclosure is not a critical concern in the current study.
8 For example, a report, “Comprehensive Survey on Patent Applications Based on Inventions by National University Researchers,” by the National Institute of Science and Technology Policy (NISTEP), Japan.
Available at http://www.nistep.go.jp/wp/wp-content/uploads/NISTEP-RM266-FullJ.pdf.
to be reported in 2004, and national universities were already incorporated at that time, as all academic patent applications included university names. Second, it is difficult to identify Japanese academic inventors before 2004, as most Japanese academic inventors did not apply for patent outcomes through their affiliations. Further, no other information sources exist to identify each academic inventor. For example, an inventor’s address could be the address of his or her university office, but it also could be his or her home address or the office address of the UIC partner.
Figure 4. KAKENHI projects reporting patent outcomes
4. Findings and discussion 4.1 Academic patents in Japan
Figure 5 illustrates the number of patents by universities in Japan. Although Japanese universities applied for patents prior to 2004, the number of academic patents has significantly increased since then.
0 2 4 6 8 10 12 14 16 18 20
0 100 200 300 400 500 600 700 800
2000 2001 2002 2003 2004 2005 2006 2007 2008 2009 2010 2011 2012 2013 2014 2015 2016 2017
[left axis] A: Projects that report patent outputs [left axis] B: Projects that report no patent outputs [right axis] A/(A+B)(%)
# of projects
The last year of a project
share
Figure 5. Patents by Japanese universities (Source: Authors’ calculation)
We further observe the number of patents by funding type, with Figure 2 displaying the results. We observe that until 2004, patent outcomes were produced from sources other than industry and competitive funding. However, patent outcomes from industry-funded projects have outnumbered those from the other funding sources since 2005, which implies that incorporating universities compelled them to actively work with industries. Although there are fewer patent outcomes from competitively funded projects than the other two sources—until 2001, no patent outcomes were reported in KAKENHI documents—these have prominently increased since 2004.
Figure 6. Patents by all Japanese universities per funding type (Source: Authors’ calculation)
4.2 Applicants
Table 7 notes the top 20 university applicants in Japan; in our sample, 253 universities had filed for patents. However, the top 20 universities account for more than 60% of all patent applications by Japanese universities. As Table 7 reveals, most of the top 20 applicants are
0 500 1000 1500 2000 2500 3000 3500
Univ patents
# of patents
Application Year
0 200 400 600 800 1000 1200 1400 1600 1800 2000
Block funding UIC Competitive
# of patents
Application Year
national universities, which further confirms that national universities in Japan are research institutions. Specifically, Japan’s academic patent applications are concentrated in seven former Imperial universities: Tohoku, Tokyo, Osaka, Kyoto, Nagoya, Kyushu, and Hokkaido. The current finding implies that producing patent outcomes from academic research projects correlates with the research capability and environment.
Table 7. Top 20 applicant universities in Japan (1992-2013) University Name (*: private
university) No. of patents
Tohoku University 1,560
University of Tokyo 1,463
Tokyo Institute of Technology 1,139
Osaka University 1,061
Kyoto University 1,054
Nagoya University 868
Kyushu University 706
Hiroshima University 678
Nihon University* 586
Waseda University* 546
Chiba University 515
Shinshu University 499
Okayama University 452
Kyushu Institute of Technology 414 Nagoya Institute of Technology 410 Tokyo University of Agriculture and
Technology
399
Tokai University* 398
Yamaguchi University 383
Hokkaido University 364
Osaka Prefecture University 361 (Source: Authors’ calculation)
4.3 Forward citations
This subsection compares forward citations, as counting forward citations is often used as a proxy for a patent’s technological advancement (Jaffe & Trajtenberg, 2002). This study uses the forward citation as a proxy of progenitiveness; more progenitive patents are more often cited by subsequent patent documents.
However, there are three biases to consider for a fair assessment. First, older patent documents have had longer to receive citations than younger patent documents. Second, the average number of patent citations per patent differs by technological field. Third, an applicant tends to cite his or her own patent documents (self-citation). We correct these biases by using the normalized number of non-self forward citations. This normalization involves dividing a patent’s number of forward citations by the average number of forward citations from the patent’s same technological field and application year (Nagaoka et al., 2010).
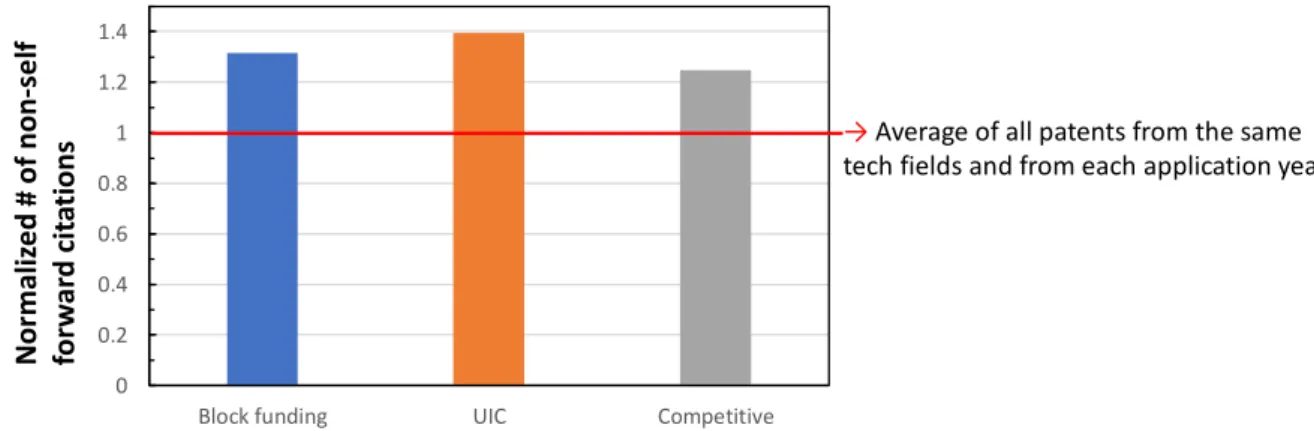
Figure 7 illustrates the results, and exhibits the similarities and differences in technological advancement between the funding types; all patent outcomes demonstrate values above the norm (normalized number of non-self forward citations = 1). As the norm is the average of all patents from the same technological fields and from each application year, the figure indicates that academic patents are more progenitive than patent outcomes from the entire industry.
A comparison of funding types reveals that the patent outcomes produced as a result of UICs are likely to receive more forward citations than the other two. We attribute this finding to the fact that industry interactions better diffuse academic researchers’ knowledge to inventors.
Sapsalis et al. (2006) also indicated that academic patents tend to receive more forward citations when they are co-applied with an industry. This finding implies that a network between academia and industry facilitates knowledge diffusion (Breschi & Catalini, 2010).
Figure 7. Average of normalized number of non-self forward citations per funding type
4.4 Regression model
We then define two independent variables for funding sources: (1) an industry funding dummy and (2) a competitive funding dummy. This inherently indicates that block funding is the baseline for our regression analysis.
In addition to independent variables, we added control variables for each observation that may impact the dependent variable: (1) inventors who have experienced UIC;9 (2) the number of inventors; (3) the number of claims; (4) a research-intensive organization dummy as a proxy for an organizational condition to properly conduct research, which includes not only infrastructure, but also incentives and pressure; (5) technological fields, defined by the sub-class level from the International Patent Classification (IPC) code; and (6) application year.
9 We used the Japanese inventor disambiguation database to disambiguate different inventors with the same names (Ikeuchi et al., 2017), as using this database increases reliability.
0 0.2 0.4 0.6 0.8 1 1.2 1.4
Block funding UIC Competitive
Normalized # of non‐self forward citations
→Average of all patents from the same tech fields and from each application year.
The regression analysis focuses on the years from 2004 to 2011. As mentioned in Section 1, Japanese universities first began filing patents in 2004 as an outcome of their research activities.
Figure 5 demonstrates that the number of academic patents has significantly increased since 2004, a phenomenon similar to that in the United States, in which academic patenting activity increased with the passage of the Bayh-Dole Act in 1980 (Mowery & Ziedonis, 2002). Additionally, we omit samples from 2012 to obtain reliable patent statistics, as mentioned in Section 4.3.
Ultimately, 24,988 samples were selected.
Table 8 and Table 9 reveal the basic statistics and correlation between the variables.
Table 8. Summary of variable definitions and the empirical analysis model
Variable Definition
Independent variable
(Base:
Block)
Industryi Industry funding dummy of patent i:
1 if a patent is co-applied by a university and a firm Competitivei
Competitive funding dummy of patent application i:
1 if a patent is reported as an outcome of a KAKENHI-funded project
Control
UIC inventori Inventor who have ever experienced UIC:
1 if an inventor has ever experienced UIC patenting Inventorsi Number of inventors in patent i
Claimi Number of claims in patent i ResUi
Research-intensive organization dummy of patent i:
1 if the applicant university is ranked in THE-QS World University Ranking in the focal patent’s application year TechFieldi Technological field (defined by the sub-class level of the IPC
code) dummy of patent i
Yeari Application year dummy of patent i
Observations Patents with application years from 2004 to 2011 Table 9. Variables’ basic statistics
Variable Obs Mean Std. Dev. Min Max
Industryi 24,988 0.4488154 0.497383 0 1
Competitive
i 24,988 0.172243 0.377599 0 1
UIC inventor
i 24,988 0.753322 0.431087 0 1
Inventorsi 24,988 3.509845 1.901574 1 24
Claim
i 24,988 9.568993 6.709639 1 143
ResUi 24,988 0.406875 0.491261 0 1
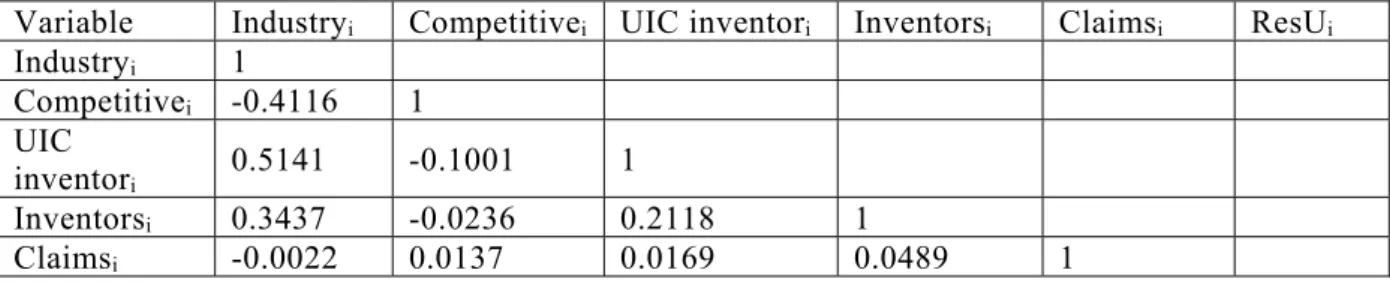
Table 10. Correlation between variables
Variable Industryi Competitivei UIC inventori Inventorsi Claimsi ResUi
Industryi 1
Competitivei -0.4116 1 UIC
inventori 0.5141 -0.1001 1
Inventorsi 0.3437 -0.0236 0.2118 1
Claimsi -0.0022 0.0137 0.0169 0.0489 1
ResUi 0.1348 0.0267 0.1232 0.1941 0.1039 1 4.5 Testing hypotheses H1-1 and H1-2: Radical invention of academic patenting
We employ a regression model as indicated in Table 8, and define the dependent variable as an indicator of a breakthrough invention. We consider a patent as a “breakthrough” invention if the patent is granted without any backward citations. Accordingly, the dependent variable is set to one if a patent is granted without any backward citations, and zero otherwise. We also employ a logit regression due to the nature of this dependent variable.
Our setting of the dependent variable is logical according to how citations are added when a patent application is examined. Applicants in the United States must disclose all prior art to the U.S. Patent and Trademark Office as a duty of candor, and any failure to disclose as such can result in the loss of patenting rights. However, the Japan Patent Office does not mandate the disclosure of prior literature, and examiners are the dominant source of citations. The primary reason for adding citations in patent documents or in a search report is to identify prior works, which are relevant in evaluating the invention’s patentability in terms of novelty and innovation (Nagaoka et al., 2010). Thus, patent examiners rather than patent applicants are ultimately responsible for the citations made for this objective. Accordingly, a patent granted without any backward citations indicates that the patent is a breakthrough, and irrelevant to any prior invention.
Table 11 notes the results, including the coefficients and t-statistics. The first independent variable Industryi has negative effects, with statistical significance at the 1% level in all regression models. This indicates that patent outcomes from industry-funded research projects are likely to produce technologically inferior outcomes than those from block-funded research projects.
Alternatively, the second independent variable Competitivei has positive effects, with statistical significance at the 1% level in all models. This result indicates that competitively funded research projects are likely to produce technologically superior outcomes than patent outcomes from block-funded research projects.
Accordingly, we conclude that Hypotheses H1-1 and H1-2 are supported.
---
Table 11. Testing radical inventions H1-1 and H1-2 (DV: Grant with no backward citations, Model: logit)
---
We provide further analysis by focusing on the technological fields with active patenting.
We calculate the number of patents per technological field, and denote technological fields as active if they have 500 or more patents.
Table 12 displays the results, including coefficients and t-statistics. In technological fields with active patenting, the first independent variable Industryi has negative effects and statistical significance, while the second independent variable Competitivei has positive effects with statistical significance in all regression models. The results in Table 12 are more apparent than in Table 11, which further supports our hypotheses.
---
Table 12. Testing radical invention in IPC subclasses with > = 500 patents ---
4.6 Testing hypotheses H2-1 and H2-2: Diffusion impact of academic patenting
We employ a Tobit regression model and use the variables as indicated in Table 8. The dependent variable is the normalized number of non-self forward citations, with the interpretation that the more a patent is cited by subsequent patent documents, the more technologically impactful it is.
Table 13 reveals the results, including coefficients and t-statistics. On the one hand, the first independent variable Industryi loses its statistical significance when control variables are not added, but exhibits negative effects with statistical significance at the 1% level in the other regression models. This result indicates that patent outcomes from industry-funded research projects are likely to produce technologically inferior outcomes than those from block-funded research projects.
On the other hand, the second independent variable Competitivei displays negative effects, with statistical significance at the 1% level in all models. This result indicates that competitively funded research projects are likely to produce more technologically inferior outcomes than the patent outcomes from block-funded research projects.
We employ the same regression with a different base to compare the coefficients of Industryi
and those of Competitivei. However, no statistical significance exists between them.
---
Table 13. Testing impact H2-1 and H2-2 (DV: normalized no. of non-self forward citations, Model: tobit)
---
A further analysis focuses on the technological fields with active patenting; we calculate the number of patents per technological field, and choose technological fields with 500 or more patents as the active patenting fields.
Table 14 displays the results, including coefficients and t-statistics. In technological fields with active patenting (Table 14), the first independent variable Industryi loses its statistical significance, while the second independent variable Competitivei demonstrates negative effects with statistical significance in all regression models.
Accordingly, we conclude that Hypothesis H2-1 is partially supported, and Hypothesis H2-2 is fully supported.
--- Table 14. Testing impact in IPC subclasses with > = 500 patents
---
5. Discussions and policy implication
The current study investigates the impacts of academic research funding sources on academic patents. We classify funding sources into three types—block, industry, and competitive—and compare their impacts on academic patenting.
Table 15 summarizes our findings.
Table 15. Summary of findings
Outcome measurement Probability of producing outcomes in the measurement of interest
Radical invention (non-recombinant invention)
competitive funding > block funding > industry funding Diffusion block funding > industry funding, competitive funding
block funding, industry funding > competitive funding
Our findings provide several implications. First, industry funding is the least likely to produce progenitor inventions, but these inventions diffuse well. Progenitor inventions can create new technological trajectories and paradigms, but are substantially likely to remain un- commercialized and forgotten. Accordingly, it is risky for industry funding to produce progenitor inventions. As the industry implements such inventions, these industry inventions have the largest chance of diffusion in a network of users and implementers. Accordingly, academic researchers’
proximity to the industry increases the chances of diffusion.
Second, competitive funding is the most likely to produce progenitor inventions, but these inventions do not diffuse well. In our study, competitive funding is completely opposite to industry funding, as the former supports long-term research and imposes the least conditions for research and outcomes in the Japanese context. Such environmental conditions facilitate researchers’ progenitor inventions. As progenitor inventions can create new trajectories and paradigms, it is important to support research activities that produce progenitor inventions, but industry funding cannot invest in them. Thus, competitive funding plays a key role in forming technological trajectories and new paradigms. A remaining issue is that progenitor inventions produced from competitive funding do not diffuse well; consequently, it is better to introduce a mechanism to diffuse these progenitor inventions.
Third, in our study indicates that block funding plays an intermediate role between competitive and industry funding, although block funding from the government has declined and universities have consequently increased their reliance on industry funding. However, as previously indicated, industry funding tends to create fewer progenitor inventions that diffuse well, which is undesirable. Policymakers well understand the consequences of declining block funding, and must find mechanisms to avoid universities’ excessive reliance on industry funding.
Finally, the nature of the funding source influences patent outcomes. When introducing a new funding method, it is important to understand what kind of outcomes are expected from the funding method.
Appendix A
The current study uses patent outcomes from the KAKENHI-funded projects declared by researchers. As academic researchers are involved in many simultaneous projects and conduct all research projects in parallel, concerns may exist that the patent outcomes reported in KAKENHI- funded projects might be research outcomes from other funding sources.
This appendix confirms whether such concerns are applicable by analyzing how many patent outcomes invented by the KAKENHI recipients were actually reported as outcomes of KAKENHI-funded projects.
Among all the patent applications by Japanese universities, nearly all (46,308 out of 48,646) were invented by academic researchers who have received the KAKENHI funds. This may imply that academic researchers receiving these funds conduct most of their applied research in Japan.
Among the 46,308 patent applications by these academic researchers, 10,048 were filed by academic researchers who did not receive KAKENHI funds, while 36,260 were filed by academic researchers who received these funds. Further, among the patent applications filed when the KAKENHI funds were granted, only a small portion (6,262 out of 36,260 patent applications)
were reported as outcomes of KAKENHI-funded projects. In other words, most were not reported as outcomes of these projects.
From this analysis, we conclude that the KAKENHI recipients have properly reported their research outcomes, and patent outcomes in our study do not exaggerate the KAKENHI reports.
Table A. Patent outcomes reported by researchers who have received KAKENHI funding
Patent type Number of
observations Patent applications by Japanese universities 48,646
Of which, patent applications invented by researchers who have received KAKENHI funding
46,308 (1) Of which, filed when the KAKENHI was not funded 10,048 (2) Of which, filed when the KAKENHI was funded 36,260 (2-1) Of which, reported as outcomes of the KAKENHI-funded
projects
6,262 (2-2) Of which, not reported as outcomes of the KAKENHI-funded
projects
29,998
Figure A. Patent outcomes between KAKENHI funding recipients and others
Appendix B
Academic patenting is not a recent phenomenon in Japan. Before 2004, academic patenting in Japan had adopted an “inventorist” approach, in that the entity that held the rights to its employee inventions should be deemed the inventor. This way of thinking had been adopted in Japan since Japanese patent law was revised in 1921. All private sectors consider the interests of users and employers who directly or indirectly subsidized the invention activity, and the rights to an employee’s invention were assigned to the employers to a certain extent. However, the rights to academic patents in the academic sector were not automatically assigned to employers, whether
0.0 10.0 20.0 30.0 40.0 50.0 60.0 70.0 80.0 90.0 100.0
0 1000 2000 3000 4000 5000 6000 7000
Patents by non recipients Patents by Kaken recipients Ratio (%)
# of patent applications
Application Year
Ratio
this involved the government or the university.10 For example, only around 15% of all patent outcomes in national universities were assigned to the government before 2004 (Table B).
Consequently, most academic patent applicants during this period were inventors themselves.
Additionally, even if UIC projects during this period resulted in patent outcomes, universities did not appear as applicants on patent documents; instead, firms were listed as the only applicants on patent documents, and the academic researchers as well as firms’ employee inventors involved in UIC projects appeared as the inventors.
Table B. Assignment of patent applications in Japanese national universities Year Reviewed patent
applications*
Assigned to the
government Assigned to the inventor Count Share (%) Count Share (%)
1993 417 68 16.3 349 83.7
1994 377 44 11.7 333 88.3
1995 435 45 10.3 390 89.7
1996 448 66 14.7 382 85.3
1997 650 109 16.8 541 83.2
1998 1059 234 22.1 825 77.9
1999 1725 281 16.3 1444 83.7
2000 2391 359 15.0 2032 85.0
2001 3040 414 13.6 2626 86.4
2002 3832 682 17.8 3150 82.2
2003 6787 1071 15.8 5716 84.2
Source: Author’s arrangement based on MEXT reports
* All (domestic and international) patent applications from universities were reviewed by the invention committee in each university to determine whether they should be assigned to the employer. Accordingly, the numbers in their patent families should be smaller.
Acknowledgements
The authors would like to thank Dr. Kenta Ikeuchi and Dr. Naotoshi Tsukada for their advice.
The authors would also like to thank participants at the NISTEP workshop for their constructive comments and suggestions. All remaining errors are the authors’ own.
10 Before 2004, academic researchers in Japanese national universities were treated as employees of the Japanese government. Therefore, patent outcomes from national universities were occasionally assigned to the government. Alternatively, academic researchers in public and private universities were university employees, and therefore, patent outcomes in public and private universities were assigned to these institutions.