九州大学学術情報リポジトリ
Kyushu University Institutional Repository
中国における穀物需給政策のインパクト分析
銭, 加栄
https://doi.org/10.15017/1398433
出版情報:Kyushu University, 2013, 博士(農学), 課程博士 バージョン:
権利関係:Fulltext available.
SIMULATIONS ON THE IMPACTS OF AGRICULTURAL POLICIES ON GRAIN SUPPLY AND DEMAND IN CHINA
JIARONG QIAN
2013
I
SIMULATIONS ON THE IMPACTS OF AGRICULTURAL POLICIES ON GRAIN SUPPLY AND DEMAND IN CHINA
A Dissertation by
JIARONG QIAN
September 2013
Laboratory of Food and Agricultural Policies, Department of Agricultural and Resource Economics, Graduate school of Bioresource and Bioenvironmental Sciences,
Kyushu University, Fukuoka, Japan
II ABSTRACT
China’s economic development entered a new phase. Large scale funding supports are available for agricultural development. Facing the decreasing food production situation, agricultural subsidy policies and grain price support policies have been implemented under the guideline of “offering more, taking less and loosening control” since 2003, aiming to mobilize farmers’ enthusiasm for agricultural production, thus enabling grain production to rebound. The total amount of subsidies keep rapid increase annually and the grain minimum purchasing prices rise year by year. Those great support measures may show some influences not only on grain production but also on consumption, imports and exports.
However, few studies have examined those impacts both on grain supply and demand. This study, therefore, attempts to evaluate the effects of agricultural policies on grain price, production, consumption, import and export employing a simultaneous equations model.
In the model, grain production is determined by the area and yield response functions. Area is specified as a function of the area and producer price of previous year, subsidies and trend variable. Yield is specified as a function of the yield and producer price of previous year, subsidies and grain planted areas. Grain food and feed consumption are modeled as a function of grain market price, per capita income and meat price. Import is specified as a function of grain market price, production, consumption and the exchange rate of Chinese yuan to US dollar. Export is specified as a function of grain market price, production, consumption and the exchange rate of Chinese yuan to US dollar. For subsidy policy simulation, the producer price is specified as function of production costs, subsidies and a dummy variable. Note that the subsidies show positive influence on grain prices in recent years in China. While for minimum purchasing policy simulations, grain price is
III
modeled as a function of minimum grain prices because grain prices are strongly influenced by the grain minimum purchasing price policy in China. For market clearance, grain ending stocks are a residual of total supply minus total demand.
The simulation results indicate some key factors. First, agricultural subsidies positively impact grain production, and show a bigger influence on the next year’s production than that of current year. Second, subsidies have negative influences on grain consumption but the influences are very tinny. Third, for grain minimum purchasing price policy, increasing grain minimum purchasing price will promote the next year’s grain production and can reduce grain consumption in only the current year. Fourth, subsidies can reduce imports and increase exports for rice and wheat, but decrease both imports and exports for corn. Grain minimum purchasing prices can increase grain imports and reduce grain exports. Finally, both policies can result in a rise in grain ending stocks both in the current and the next year.
Generally, the influences from agricultural subsidy policies are rather small, while price support policy shows very significant impacts on grain supply and demand. Thus, continuing efforts should be made to design appropriate minimum purchasing prices for grains.
IV
TABLE OF CONTENT
ABSTRACT ... II TABLE OF CONTENT ... IV LIST OF FIGURES ... VI LIST OF TABLES ... VII
CHAPTER 1 INTRODUCTION... 1
1.1 Backgrounds ... 1
1.2 Objectives ... 3
1.3 Justifications ... 4
1.4 Organization... 5
CHAPTER 2 LITERATURE REVIEW ... 6
2.1 Studies on Supply Responses ... 6
2.2 Studies on Effects of Price Support Policy ... 7
2.3 Studies on Effect of Subsidies ... 8
2.4 Studies on Modeling Efforts on Grain Supply and Demand ... 9
CHAPTER 3 SITUATIONS OF GRAIN SUPPLY AND DEMAND IN CHINA ... 13
3.1 Grain Production ... 13
3.2 Grain Consumption ... 16
3.3 Grain Trade ... 19
3.4 Ending Stocks ... 25
CHAPTER 4 MAJOR AGRICULTURAL POLICIES IN CHINA ... 28
4.1 Agricultural Subsidy Policies ... 28
4.2 Grain Minimum Purchasing Price Policies ... 38
CHAPTER 5 EFFECTS OF AGRICULTURAL POLICIES ... 43
5.1 Subsidies and Agricultural Supply Responses... 43
5.2 Subsidies and Grain Prices ... 53
5.3 Minimum Purchasing Prices and Grain Prices ... 63
CHAPTER 6 CHINA GRAIN SUPPLY AND DEMAND MODEL ... 73
6.1 Production Sector ... 73
6.2 Grain Consumption ... 75
V
6.3 Trade Sector ... 84
6.4 Price Linkages ... 87
6.5 Market Clearance ... 89
CHAPTER 7 SIMUNATIONS ON CHINA’S GRAIN SUPPLY AND DEMAND ... 91
7.1 Scenarios Setting for Policy Simulation ... 91
7.2 Simulations for Agricultural Subsidy Policy ... 92
7.3 Simulations for Grain Minimum Purchasing Price Policies ...106
7.4 Elasticities to Agricultural Policies ...116
CHAPTER 8 CONCLUSIONS AND POLICY IMPLICATIONS ...119
8.1 Conclusions ...119
8.2 Policy Implications ...124
8.3 Suggestions for Further Research ...126
REFERENCES ...128
APPENDIX ...132
Appendix 1 Rice balance of supply and demand (thousand tons) ...132
Appendix 2 Wheat balance of supply and demand (thousand tons) ...133
Appendix 3 Corn balance of supply and demand (thousand tons) ...134
LIST OF PUBLICATIONS...135
VI
LIST OF FIGURES
Figure 1.1 Decreasing grain production in China from 1997 to 2003 ... 1
Figure 1.2 Increasing GDP and national revenue in China (trillion yuan) ... 2
Figure 3.1 Total grain production and price in 1990-2010 ... 14
Figure 3.2 Changes in production of rice, wheat and corn ... 15
Figure 3.3 Changes in China’s grain consumption ... 17
Figure 3.4 Import and export of rice in China during 1990-2012 ... 20
Figure 3.5 Import and export of wheat in China during 1990-2012 ... 22
Figure 3.6 Import and export of corn in China during 1990-2012 ... 24
Figure 3.7 Ending stocks of grains in China during 1990-2012 ... 26
Figure 4.1 Changes in agricultural subsidy scales in China ... 29
Figure 4.2 Total fine seed subsidies in 2003-2011 ... 33
Figure 4.3 Grain direct subsidies in 2004-2011 ... 34
Figure 4.4 Total Farm Machinery Subsidies in 2004-2011 ... 36
Figure 4.5 Total comprehensive subsidies in 2006-2011... 37
Figure 4.6 Producer prices under protective price policy in China ... 39
Figure 5.1 Rice yields in China and world since 1960 ... 44
Figure 5.2 Wheat yields in China and world since 1960 ... 44
Figure 5.3 Corn yields in China and world since 1960 ... 44
Figure 5.4 Grain yields and fine seed subsidies for principal grains in China ... 45
Figure 5.5 Harvested areas and agricultural subsidies for grains in China ... 50
Figure 5.6 Agricultural subsidies and grain prices under the price support policy ... 56
Figure 5.7 Total grain production in China from 2003 to 2010 ... 63
VII LIST OF TABLES
Table 4.1 Evolution of fine seed subsidies for rice, wheat and corn in China ... 31
Table 4.2 Fine seed subsidies for rice, wheat and corn in China (billion yuan) ... 32
Table 4.3 Changes in main producing areas covered by GMPP policy (million tons) ... 40
Table 4.4 The implemented periods and announced time of GMPP policy ... 41
Table 4.5 Changes in grain minimum purchasing prices (yuan/50kg) ... 42
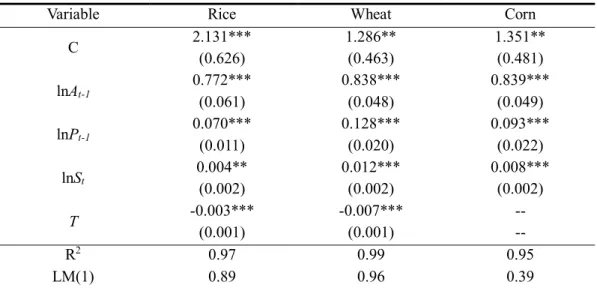
Table 5.1 Estimated results of yield response model ... 47
Table 5.2 Estimated results of acreage response model ... 52
Table 5.3 Changes in agricultural subsidy scales in China ... 55
Table 5.4 Granger causality test for rice price and production ... 55
Table 5.5 Changes in average usage of main agricultural inputs (million tons/year) ... 57
Table 5.6 Changes in factor prices and rice prices ... 58
Table 5.7 Unit root testing for LNP, LNC and LNS ... 59
Table 5.8 Unit root testing for residual ... 61
Table 5.9 Granger causality test for rice price production costs and subsidies ... 61
Table 5.10 Grain market prices and minimum prices in China (yuan/50kg) ... 64
Table 5.11 Increase rates of minimum prices and market prices for each grain (%) ... 66
Table 5.12 Raw data of rice and wheat ... 69
Table 5.13 Average-value processing for raw data ... 70
Table 5.14 Grey relational grades between crop price and its influencing factors... 71
Table 6.1 Grain consumption structures in China (%)... 75
Table 6.2 Annual grain consumption in China (Million tons) ... 76
Table 6.3 Recent wholesale prices of meat in China (yuan/kg) ... 77
Table 6.4 Prices of meat and the per capita consumption of meat and grains in China ... 78
VIII
Table 6.5 Estimated results of consumption models ... 80
Table 6.6 Contribution of meat prices to grain consumption (2006-2010, Kg per capita) .. 81
Table 6.7 Estimated results of grain import models ... 85
Table 6.8 Estimated results of grain export models... 87
Table 6.9 Estimated results of grain producer price models ... 88
Table 7.1 Shock scenarios for subsidies and minimum purchasing price policies ... 91
Table 7.2 Simulation results of subsidy policies for rice (%) ... 94
Table 7.3 Simulation results of subsidy policies for wheat (%) ... 99
Table 7.4 Simulation results of subsidy policies for corn (%) ...104
Table 7.5 Simulation results of rice minimum purchasing price policy (%) ...108
Table 7.6 Simulation results of wheat minimum purchasing price policy (%) ...114
Table 7.7 Elasticities to agricultural policies for price, marketing and stocks ...117
1
CHAPTER 1 INTRODUCTION
1.1 Backgrounds
China is the largest agricultural country with a biggest population in the world. Its agricultural GDP was 4748.6 billion yuan in 2011, accounting for 10% of the total economy. The population of China in 2011 was 13.47 billion, among which 65656 million were agricultural population occupying 48.73% of the total population. Also, China is a big food consumption country, accounts for approximately 30 percent, 17 percent and 21 percent of the rice, wheat and corn demanded in the world market. Thus, food issues appear particularly important to China, and since 2004 the Central No.1 Document, which often pays attention to the most important social issues, has continuously focused on agricultural issues for 10 years.
Figure 1.1 Decreasing grain production in China from 1997 to 2003
Source: USDA, PSD Online 2013.
60 70 80 90 100 110
200 250 300 350 400 450 500 550
1996 1997 1998 1999 2000 2001 2002 2003 2004 2005 2006 2007 2008 2009 2010 2011 million tones %
grain production rice self-sufficeincy rate
2
Grain production plays a critical role in maintaining China’s food security and social stability. Thus, to increase grain production becomes an important objective of the government. But since 1998, grain production had decreased, and met a historical low level of 374.29 million tons in 2003, and also the grain self-sufficiency rate, rice self-sufficiency rate touched a bottom of 85.1% in the same year.
Figure 1.2 Increasing GDP and national revenue in China (trillion yuan)
Source: China Statistical Yearbook 2012.
China’s economy has experienced a rapid growth since the late of 1970s and came to a new phase in 2000s. The economy scale of China jumped over 10 trillion yuan in 2001 and increased to nearly 50 trillion yuan in 2011. Also, national revenue has kept rapid growing, it priced 2 trillion yuan in 2003 and increased to more than 10 trillion in 2011, nearly 10 times that in 2000. Now large scale funds are available to support agricultural development.
For a long time, agriculture supports industrial development since the building of new China. Now China’s economy development, especially the industrial development, has
1.34 1.64 1.89 2.17 2.64 3.16 3.88 5.13
6.13 6.85 8.31
10.39
0 2 4 6 8 10 12
0 5 10 15 20 25 30 35 40 45 50
2000 2001 2002 2003 2004 2005 2006 2007 2008 2009 2010 2011 Revenue GDP
Revenue GDP
3
entered into a new stage, it is high time to implement the industry - nurturing – agriculture policy. Facing these backgrounds, in 2003 the government made a new guideline of
“offering more, taking less and loosening control” for agricultural development. It dramatically increased support to agriculture, the rural economy and rural areas, and took practical measures to ensure that priority is given to agriculture, the rural economy and rural areas in its work. Among the policies and measures the agricultural subsidy polices and grain minimum purchasing price policy achieved best results, aiming to mobilize farmers’ enthusiasm for agricultural production, thus enabling grain production to rebound.
The subsidy policies for grains started from 2003, and the grain minimum purchasing price policy enforced in 2004.
1.2 Objectives
Since the agricultural policies were implemented, a great amount of fund supports have been provided for agricultural development. Much attention has been paid to the effects of these polices. The total amount of subsidies keep rapid increase annually and the grain minimum purchasing prices rise year by year. Those great support measures may show influences not only on grain production but also on consumption, imports, exports and ending stocks.
However, few studies have examined the impacts of these support policies both on grain supply and demand. Therefore, this study attempts to evaluate the effects of these two main agricultural policies on grain prices, production, consumption, imports, exports and ending stocks employing a simultaneous equations model. To achieve this final objective, some sub studies need to be done to check the direct effects of these policies. The objectives of this study can be summarized as follows:
1. Describe the current situations of grains supply and demand in China.
4
2. Introduce the implementation of the main agricultural policies in China, the agricultural subsidy policies and the grain minimum purchasing price policy.
3. Examine the direct effects of agricultural policies, the direct effects mainly focus on grain market prices, planted area and yield.
4. Develop a partial equilibrium model of China grain supply and demand based on the studies of direct effects of these policies.
5. Evaluate the impacts of agricultural policies on grain supply and demand using three scenarios. The supply sectors include grain production, grain imports and ending stocks, the demand sectors are grain consumption, grain exports and the.
6. Finally, present the main conclusions and policies implications according to the previous studies.
1.3 Justifications
Agricultural policies cover an extremely extensive range. The main purpose of our study is to examine the policy effects on grain supply and demand, thus, the agricultural policies involved in two policies, they are agricultural subsidy policy and grain minimum purchasing price policy, both are correlated to grain supply and demand directly.
The support policies are mainly focused on these three grains (rice, wheat and corn) which are the most important food grains in China relating to the country’s food security.
Therefore, grains in this study only refer to rice, wheat and corn. In this study, they are studied separately in individual models.
5 1.4 Organization
This study contains 8 chapters. Chapter 1 states the backgrounds and justifications, objectives and organization of this study; in chapter 2, a review of a representative studies on evaluating agricultural supply response, effects of agricultural subsidy policies. Some studies on partial and general equilibrium models for food supply and demand are also reviewed; chapter 3 describes the current situations of grain supply and demand in China, three main grains, rice, wheat and corn, are introduced separately from the production, consumption, imports, exports and ending stocks; in chapter 4, we introduce the implementations of the two main agricultural policies, they are subsidy policies and grain minimum purchasing price policies. The subsidies include fine seed subsidies, grain direct subsidies, farm machinery subsidies, and comprehensive subsidies. For the grain minimum purchasing price policy, it only covers rice and wheat in current stage, corn is not covered by this price support policy; in chapter 5, the effects of these policies are evaluated. We estimate the yield and area response for three grains using Nerlove model in which a subsidy variable is incorporated. The impact of subsidies on grain prices is also examined in this chapter using cointegration analysis, and the effect of minimum purchasing price policy is also assessed using the grey relational analysis; in chapter 6, a simultaneous equations model is built to link agricultural policies and the sectors of grain supply and demand; in chapter 7, the simulation analysis has been conducted to evaluate the impacts of agricultural policies on grain prices, production, consumption, imports, exports and ending stocks; and finally, in chapter 8, we present our conclusions and policy implications.
6
CHAPTER 2 LITERATURE REVIEW
2.1 Studies on Supply Responses
Nerlove (1958) included expectation theory into the study of agricultural response and developed Nerlove model. The adaptive expectation can be expressed as follows,
Pt* Pt*1(Pt1Pt*1), 0 1 (1)
where Pt* and Pt*1 are expected prices at year t and t-1, respectively, β is the coefficient of expectation, which lies between zero and one. Nerlove (1958) hypothesized farmers react in terms of the expected price. Then the acreage response function can be written as follows:
Xt 01Pt*ut (2)
where Xt is the acreage in year t, Pt* is the expected price in year t, 0and 1 are the coefficients to be estimated. Pt* is unobservable, so it cannot be estimated. In particular, last year’s expected price,Pt*1, can be represented by last year’ acreage, Xt1. This means that expected price this year is a function of last year’s actual price and last year’s acreage.
We can replace last year’s expected price in equation (1) by a linear function of last year’s acreage. If we now substitute this new expression for expected price into the acreage response function, equation (2), we obtain a new relation between acreage this year and last year’s actual price and last year’s acreage. The relationship is expressed as:
Xt 01Pt12Xt1vt (3)
where 0turns out to be equal to 0, 1 equals 1 , and 2 equals 1. Equation (3) is called Nerlove model, and it has been applied extensively in researches on agricultural supply response. According to the survey of Askari and Cummings (1977), more than 100 empirical studies employed Nerlove’s concept. Braulke(1982) made a note on Nerlove
7
model and gave some advices on using this model. Khalid (2003) evaluated the yield response in Pakistan agriculture with cointegration approach. Jeffrey (2009) estimates the supply response of cotton and cereal crops in smallholder production systems in Mali. In China, Wang xiuqing(1998), Si wei(2006), Ma wenjie(2009), Wang Hong(2010) use Nerlove model to estimate the supply response of vegetable, sugar, wheat, and corn of China, respectively. Also some researchers use other methods to estimate the supply response, for example, Ito (1999) employed implicit revenue functions to evaluate rice supply response.
2.2 Studies on Effects of Price Support Policy
The effects of price support policy (Minimum purchasing price policy) have received much attention from academics and policy makers since its implementation, and the studies on this topic are many. Qu (2006) introduced grain minimum purchasing price policy in details, and pointed out the differences between the protective price policy implemented before and minimum purchasing price policy. Yang (2006), Wang (2006), Huang (2006) and Yun (2010) concluded that the minimum purchasing price policy enhance farmers’ income and stabilize grain market prices effectively based on studying annual income and price data. Liu (2009) analyzed the policy effects from economic theory, they concluded that in theory the GMPP policy is helpful to protect farmer’s interest and to keep grain price and production stable. Wang (2010) found that food price policy is a major factor influencing food market prices, and he summarized the influence of different price policy on food market prices in different periods. Li (2011) pointed out that under the background of agricultural product prices decline 6.2% in the first half year of 2009, the prices of rice and wheat increased by 4.9% and 8.7%, respectively, after the
8
implementation of minimum purchasing price policy for rice and wheat. However, those researches most are based on theoretical or descriptive analyses, up until now, no empirical study on evaluating the effect of MPPP is found due to a short policy implementing period.
In order to fill this gap in the literature, we attempt to employ grey relational analysis method which only requires a very limited data sample to empirically examine how significant this policy factor is among the determinates of grain market prices, and seek to provide more convincing information for policy making. This part will be discussed in chapter 5.
2.3 Studies on Effect of Subsidies
Wang and Xiao (2006) have employed the Positive Mathematical Programming (PMP) Model to study the effects of agricultural subsidies on grain production and agricultural income based on investigated data of 5 counties in China, and their conclusion is the impact on grain production is not so large but farmers’ income has been increased with the implementation of subsidy policy. Mu and Koike (2009) simulated the impacts of agricultural subsidy policy on outputs of agricultural sector and non-agricultural sectors employing the SCGE model, and their results suggest that agricultural subsidies promote the outputs of both agricultural and non-agricultural sectors, but the income levels didn’t change so much after the implementation of subsidy policies. Huang et al (2010) simulated the impacts of agricultural subsidies on Chinese food security based on the China agricultural CGE model, and results show that agricultural subsidies play an important role in ensuring the country’s food security, and promote the increase in investments, GDP and exports. Huang et al (2011) evaluated the impacts of agricultural subsidies on agricultural production using descriptive and multiple regression analysis based on panel data in 6
9
provinces, the conclusion is the subsidies in China are actually an income transfer payment, they did not show significant impacts on agricultural production, and did not distort market prices, so the current agricultural subsidy policies do not break the rules of WTO.
2.4 Studies on Modeling Efforts on Grain Supply and Demand
IFPRI developed the International Model for Policy Analysis of Agricultural Commodities and Trade (IMPACT), in which the effects of population, investment, and trade scenarios on food security and nutrition status, especially in developing countries, were analyzed. IMPACT covers 36 countries or country groups and 16 commodities, including all cereals, soybeans, roots and tubers, meats, and dairy products (accounting for virtually all of the world’s food and feed production and consumption). The model is specified as a set of country-level demand and supply equations linked to the rest of the world through trade. Food demand is a function of commodity prices, per capita income, and population growth. It includes fresh and processed food. Feed demand is a function of livestock production, feed prices, and feeding efficiency. Crop production is determined by the area and yield response functions. Area is projected as a function of crop price, investment in irrigation, and estimated rates of loss of land to urbanization and land degradation. Crop yield is a function of crop price, input prices, investments in irrigation, and yield growth due to technological change. Growth in productivity due to technological change is in turn estimated by its component sources including advances in management research and, in the case of food crops, plant-breeding research. Other sources of growth considered in the model include private-sector investments in agricultural research and development, agricultural extension and education, markets, infrastructure, and irrigation.
10
Rosegrant et al (2001) projected world food supply and demand, trade, prices, and food security to the year of 2020 based on an updated version of IMPACT.
The Arkansas Global Rice Model (AGRM) is based on a multi-country econometric framework. The model consists of six sub regions. These regions are the U.S., South Asia, North Asia and the Middle East, the Americas, Africa and Europe. Major components of a sub-model include a supply sector, a demand sector, trade, price linkage equations and market clearance. The supply sector is determined by harvested acreage and yield. The harvested acreage is specified as a function of harvested acreage one year lagged, expected price received by producers and expected input price. Yield is generally specified as a function of expected output, input price and technological change. For demand sector, the per capita rice demand is generally specified as a function of per capita income in real terms, rice retail price and wheat price. The demand for exports is a function of the difference between domestic production and consumption and export price. For price linkages, farm price is generally modeled as a function of retail price, retail price is generally a function of deflated FOB price and a time trend that captures the improvement in marketing efficiency. Export price is generally modeled as a function of Thai price (5%
broken). The market clearance, ending stocks are a residual of total supply net of total demand. Production is defined as total harvested area multiplied by yield, total consumption is per capita demand multiplied by population.
Huang and Li (2003) developed a China’s agricultural policy simulation and projection model (CAPSiM). CAPSiM is a partial equilibrium model composed of 13 sub- models. It is one of the most comprehensive models for analyzing China’s agricultural policy and projection. The model can be used in both short- and long-run projection or policy simulation. Price can be determined either endogenously or exogenously. Most of
11
the elasticity and parameters used in CAPSiM are estimated econometrically with imposition of theoretical constraints. In CAPSiM, acreage is a function of various input and output prices, including crop prices, fertilizer price, labor price and land rent. Yield is defined as a function of crop price, agricultural technology, water stocks, ratio of erosion area to total area and ratio of salinity area to total area. Total production equals acreage times yield. For demand sector consists of food consumption, feed consumption, other consumption (including seed consumption, industry consumption and waste), food per capita consumption is made up of urban food consumption and rural food consumption, urban food per capita consumption is a function of food price and real income, rural food per capita consumption is specified as a function of food price, real income and market development rate. Total food demand equals food per capita consumption times population.
Feed consumption and other consumption are an equation of last year amount times annual growth rate. Total demand sums food consumption, feed consumption and other consumption. Ending stocks are expressed as follows:
tD stock G t
G t stock t
G t
t B D D B lp
B 1 (1 1) 1
Where BGis ending stocks, DGis demand, l is the marginal changes due to commodity prices, pD is commodity prices. If =0, for long-run analysis; if =1, for short-run analysis. For trade sector, the equations are as follows:
t import t t import
t P P Q
X ( )
ort t t ort t
t P P Q
Xexp ( exp )
where is an import or export elasticity with respect to domestic demand obtained from FAO with a value of 2.2. P is the domestic commodity price, Pimport is the import price and
12
Pexport is the export price, Q indicates domestic demand. The market clearance equation is as follows:
1 exp
t ort t t t t
import
t X S D B B
X
where Ximport, imports; Xexport,exports; S, total production; D, demand; B, ending stocks, B-1 , beginning stocks.
Chen and Liu (2008) developed a partial equilibrium model to simulate China’s coarse grain supply and demand. Due to some data is not available, they assumed the ending stocks of the coarse grains remain unchanged and used coarse grain producer prices to instead of consumer prices. The model consists of 7 structural equations: production equation, price equation, export equation, import equation, price linkages and market clearance equation. Production is a function of production one year lagged, last year’s coarse grain price, corn price, agricultural input price index and disaster rate. Coarse grain price is specified as a function of per capita coarse grain demand, ratio of GDP to last year GDP, corn price and a dummy variable. Export equation is a function of export one year lagged, export price, and exchange rate between Chinese yuan and U.S. dollar. Import equation is a function of coarse grain price, and last year’s coarse grain production. For prices linkages, export price is defined as a function of domestic price and exchange rate;
corn price is modeled as a function of corn price one year lagged and domestic coarse grain price. the market clearance is total demand (per capita demand times population) equals production plus import, and minus export. In their model, per capita GDP, population, disaster rate, exchange rate, input price index are exogenous variables, the others are endogenous variables.
13
CHAPTER 3 SITUATIONS OF GRAIN SUPPLY AND DEMAND IN CHINA
3.1 Grain Production
From 1990 to 1995 China’s grain production remained stable, in 1996, it began to increase and touched a historical high level of a value of 512.30 million tons in 1998, after that the production began to decrease. The production declined from 508.39 million tons in 1999 to 462.18 million tons in 2000, decreased by 46.21million tons or 9.1% in one year.
In 2003, the production touched a historical low level, the planted area in 2003 was 99.41 million hectares, which was 4.48 million hectares less than in 2002, and the grain production was 430.70 million tons, down 5.8% from 2002, which was the biggest drop in three years. Summer grain production dropped by 2.7% to 29.48 million tons, and autumn grain production was down by 7% to 304.83 million tons. Except for the provinces of Shandong, Guizhou, Yunnan, Jinlin, Shanxi, Hainan and Gansu and the municipality of Chongqing, all other producing areas reported a contraction in grain production, of which 13 major producers reported an 88.6% decline, or 23.35 million tons. The main reason resulting in the big decline in grain production was a low grain price. Figure 3.1 shows the movements of grain price and grain production. Generally, the current year’s production is determined by the last year’s price. The real grain prices were relatively low in 2000- 2003.
But it rebounded in 2003 as a result of the balance in supply and demand following a drop in the output of grains and the support policies for agricultural development. Under the new guideline of “offering more, taking less and loosening control”, more policy supports and
14
money are provided to grain production. Farmers’ enthusiasm for grain production was greatly stimulated, and grain production had begun to rise year by year.
Figure 3.1 Total grain production and price in 1990-2010
Source: China Agricultural Development Report 2011.
Grain production witnessed a significantly favorable turn for the better in 2004 due to favorable policies, higher prices and good weather conditions, reversing five consecutive years of decline in the areas planted to grains and realizing a historic recovery of grain production. Grain acreage increased to 101.61 million hectares, 2.2 million hectares more than the previous year, reversing five consecutive years of slide. Total grain production reached 469.47 million tons, increasing by 38.77 million tons or 9% over the level in 2003, the biggest increase in the past 60years. With the yield reaching a record high of 308kg/mu, an increase of 19.2 kg over last year. Rice production was 125.4 million tons, up 12.9 million tons or 11.5% from 2003, and wheat production was 92.0 million tons, an increase of 5.5 million tons or 6.4%, bringing to an end of four successive years of fall in its
10 20 30 40 50 60 70 80 90 100 110
300 350 400 450 500 550
199019911992199319941995199619971998199920002001200220032004200520062007200820092010
price index(real) million tons Grain production Grian Price
15
production. Corn production was 130.3 million tons, grew 14.5 million tons or 12.5% over that of 2003. All provinces except Tibet, Hainan, Guangdong and Guangxi, which reported a slight decline in the production, recorded increases in grain production, with 13 major producing areas increasing by 35.37 million tons, or 11.6%, making up 91.2% of the total increase.
Figure 3.2 Changes in production of rice, wheat and corn
Source: USDA, PSD Online 2013.
In 2008 grain production made a historic breakthrough, reached a historical high and realized an increase for the fifth consecutive year, for the first time in the past 40 years.
In addition, grain yield had set a record for the fifth successive year, for the first time since 1950s. In 2008 grain production realized increase and set record in both total output and yield. Grain production made another breakthrough on the basis of increases in the previous four consecutive years. Total grain production and yield both achieved growth for the fifth successive year and reached a historical high. The year also marked the first time in eight
20 40 60 80 100 120 140 160 180 200 220
1990 1992 1994 1996 1998 2000 2002 2004 2006 2008 2010 2012 million tons
Rice Wheat Corn
16
years that grain supply and demand stuck a rough balance, thus effectively relieving the pressure of supply vs demand. Planted area of grains totaled 106.79 million hectares in 2008, 1.15 million hectares more than in the previous year. They produced a total amount of 528.71 million tons, up 27.11 million tons of 5.4% from the previous year, and an increase of 3.2% over 1998, when the previous production record was set. Grain yield reached 4951.5kg/hectare, 201kg or 4.2% more than the record in 2007. Higher yield made a contribution of over 80% to the increase in total production, the biggest in the past five years. In 2008, rice production was 134.3 million tons, up 4.1 million tons or 3.1% from 2007, wheat production was 112.5 million tons, an increase of 3.2 million tons or 2.9%, compared with the 2007’s, and corn production was 165.9 million tons, went up 13.6 million tons or 8.9% over that of 2007. The growth trend kept continued after 2008. In 2012 the total grain production stood at a new historical high, realized an increase for the ninth consecutive year, reached 589.6 million tons, up 158.9 million tons or 36.9% over that of 2003, the lowest level since 1990s. The production of rice, wheat and corn reached 143.0 million tons, 120.6 million tons and 208.0 million tons, an increase of 30.5 million tons, 34.1 million tons and 92.2 million tons or 27.1%, 39.4% and 79.6% over that of 2003 for rice, wheat and corn, respectively.
3.2 Grain Consumption
China accounts for approximately 30 percent, 17 percent and 21 percent of the rice, wheat and corn supplied and demanded in the world market, indicating even a small change in grain production and consumption patterns in China could have a big influence on world food supply and demand.
17
Rice total consumption had kept continuous growth with the developing of economy since 1980s, and in 2001 touched its summit of 136.5 million tons, and then changed to decline, but in 2006 the decrease stopped at a level of 127.2 million tons, which was down 6.8% from the historical high in 2001. From 2007 rice consumption began to increase again, which seems to be unnormal. Wheat consumption showed the same situation with rice, it had experienced a stable growth since 1990s and reached a record high of 110.3 million tons in 2000. Then stated to decline, in 2006 it was down to a low level of 102.0 million tons, and had rebounded since 2007, in 2011 a new record was set at a value of 120.0 million tons.
Figure 3.3 Changes in China’s grain consumption
Source: USDA, PSD Online 2013.
From 1980s to 2000s, the income level of Chinese was still low, with consumers becoming rich due to the economic development, they will increase grain consumption to improve their living quality, at this stage grains are normal food for them; when income
20 40 60 80 100 120 140 160 180 200 220
1980 1982 1984 1986 1988 1990 1992 1994 1996 1998 2000 2002 2004 2006 2008 2010 2012 million tons
Rice Wheat Corn
18
level rises to a certain extent, other high quality foods such as meat, dairy, are available for them, they change to consume more meat and dairy and reduce food consumption, at this stage the grains are inferior food. China’s economy still kept rapid growth after the middle 2000s, but the consumption in rice and wheat during this period rebounded, rather than decline or stayed at a low level. Generally, the consumption structure has changed with the economic development and earning increase. But the new increase trend is really out of our expectations.
Corn is not a staple food and most is used for feed. Corn consumption had experienced a long and stable growth; it increased from 59.7 million tons in 1985 to 137 million tons in 2005, up more than two times at an annual average rate of 4.2%. But in 2006 the increase started to become faster than before, went up 8 million tons or 5.8% over the last year, and increased by 7.8% in 2009, 9.1% in 2010 and 10.1% in 2011. These increases were attributed to rapid economic growth in China’s economy expanding caused high demand in corn for industrial use and feed use.
Generally, in recent years, new trends in grain consumption are observed in China.
The consumption of rice and wheat showed a downward trend in early 2000s but it starts to rise since mid-2000s (Figure 3.3). The consumption of corn grew steadily until mid-2000s but shows a sharp increase now. These new trends in grain consumption in China attract extensive concerns from academics. The high meat prices mainly contribute to these new changes in grain consumption, high meat prices lead to grain consumption substitutes meat consumption for rice and wheat, and call for high feed demand to produce more meat for wheat and corn, the details will be discussed in chapter 6.
19 3.3 Grain Trade
China exported 1.35 million tons of grains in 2012, down from 1.51 million tons in 2011, a drop of 11.9%, while importing 9.10 million tons of grains, a cut of 8.5% from 9.95 million tons in 2011. Thus, net grain export came to -7.75 million tons, China has become a grain net importer for four years. The import amount increased from 1.39 million tons in 2009 to 7.75 million tons in 2012, more than 5 times the amount in 2009.
Rice
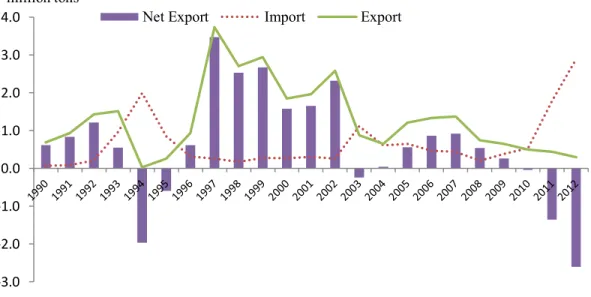
From 1992 to 2003, normally, rice import was sustained at a level of less than 0.3 million tons per year, but except the period of 1993-1995 and 2003, during which rice import fluctuated drastically. China imported 0.97 million tons of rice in 1993, a jump of 3.6 times from the previous year. It increased to 2 million tons in 1994, up 106.2% over 1993, and went down by 57.5% from 2 million tons in 1994 to 0.85 million tons in 1995.
These dramatic fluctuations in 1993-1995 are attributed to reductions in rice production. In 1993 China produced 124.39 million tons rice, decreased 5.96 million tons or 4.6% from 1992. In 1994 rice production came to a minimum of 123.15 million tons, down 1.24 million tons from the previous year, while rice import reached a maximum of 2 million tons in 1994. Also, in 2003 rice production dropped by 8.0% over the last year, and rice import increased by 330% from 0.26 million tons in 2002 to 1.12 million tons in 2003. After 2003 China increased rice imports from international market, in 2004-2010, the average was 0.47 million tons per year, in 2012 the import was 2.90 million tons, which was much larger than less than 0.3 million tons per year the average level before 2003 (Figure 3.4).
20
Figure 3.4 Import and export of rice in China during 1990-2012
Source: USDA, PSD Online 2013.
Rice export is also affected by production. In 1994 China’s rice export shrank from 1.52 million tons in 1993 to 30 thousand tons in 1994 due to the reduction in rice production. In 1997 with rice production went to a maximum of 140.49 million tons, a 8.3%
increase from 1995, the exports also went up to its maximum of 3.73 million tons, 4 times larger than the last year. From 1997 to 2002, the export had sustained at a relatively high level with an average of 2.63 million tons per year until meeting a sharp decline in rice production in 2003. In 2003, the export was 0.88 million tons, down 65.9% from 2.58 million tons in 2002. It was reduced to 0.66 million tons in 2004. In 2005 -2007, it recovered moderately to above 1 million tons per year. Note that with domestic demand increasing, export was decreasing, it was reduced from 1.37 million tons in 2007 to 0.3 million tons in 2012 (See Figure 3.4).
For 1990 to 2009, Except for those years in which rice production decreased dramatically, for example 1993, 1994 and 2003, China was a net rice exporting country,
-3.0 -2.0 -1.0 0.0 1.0 2.0 3.0 4.0
million tons
Net Export Import Export
21
and the export quantities were much higher than that of imports. But in recent years, due to the increasing domestic demand, rice import showed an increasing trend while exports are in decline. Note that in 2010, China’s rice imports were 0.54 tons, up from 0.39 million tons in the previous year, an increase of 38.5%. Rice exports were 0.50 million tons, down from 0.65 million tons in 2009, a cut of 23.1. As a result, there was a net rice import of 40 thousand tons, which was the first time since 2004 and under a background of a bumper harvest. In 2012 the amount of rice net import increased to 2.6 million tons (See Figure 3.4).
Wheat
China was a net wheat import country since 1990s. From 1990 to 1995 the imports were much higher, especially in 1991, 1994 and 1995. In 1991 China imported 15.86 million tons from foreign countries, a jump of 68.5% from 9.41 million tons in 1990, which touched a summit of wheat imports. In 1994 and 1995, wheat imports had witnessed sharp increases, they were 10.26 million tons in 1994, up 5.94 million tons or 137.5% from the previous year, and further increased from 10.26 million tons in 1994 to 12.53 million tons in 1995, went up 2.2%, meeting a maximum again in such a short time (Figure 3.5). As the same with rice, the production played an important role in these big fluctuations. Generally grain production may show negative impacts on grain imports, as wheat production came to a low level of 96 million tons in 1991, Chinese government had to increase wheat supply by importing more wheat from international markets to ensure the food security, resulting in the jump in wheat import in 1991. Likewise, in 1994 the production was 99.30 million tons, went down 7.09 million tons from the last year and met a minimum value, in 1995 it had a moderate recover, up to 102.22 million tons, while wheat imports went down to a peak in the same years. Similar situation was also witnessed in 2004. From 1996 to 2002
22
the imports had stayed at a low level, but wheat production was at a high level in this period. And also, after 2004 the imports returned to low levels with an average of 0.73 million tons per year, but wheat production was increasing annually from 97.4 million tons in 2005 to 120.4 million tons in 2012 (See Figure 3.5). Obviously, wheat production and import had shown simultaneous and opposite movements, suggesting that wheat production may shows negative influences on wheat import.
Figure 3.5 Import and export of wheat in China during 1990-2012
Source: USDA, PSD Online 2013.
China’s wheat exports were very small, from 1990 to 2000, the average was 0.51 million tons per year. From 2001 to 2007, exports had become relatively large, the average amount was increased to 2.03 million tons during this period. Big increase was observed in 2003 with an amount of 2.82 million tons, and in 2006, 2007 the wheat export was 2.78 million tons and 2.84 million tons, respectively. After 2007 with domestic consumption increasing, more wheat was transferred to domestic use, and export started to decrease, in
-20.0 -15.0 -10.0 -5.0 0.0 5.0 10.0 15.0 20.0
19901991199219931994199519961997199819992000200120022003200420052006200720082009201020112012
million tons
Net Export Import Export
23
2008 it’s dropped 74.6% from the peak in 2007 to 0.72 million tons in 2008. In 2008-2012, wheat exports sustained at low levels with an average of 0.91 million tons per year due to the great increasing domestic demand in China. For most years from 1990 to 2012, China was a net wheat importing country, especially in the earlier 1990s, now China tends to import more wheat from international market (See Figure 3.5).
Corn
China imported small amount of corn from international market for most years. The record high during 1990-2008 was in 1994 with a value of 4.29 million tons, this was mainly due to the high corn prices, in 1994 corn prices jumped 60% from 30.17 yuan/50kg in 1993 to 48.22 yuan/50kg in 1994, high corn prices forced corn industries to change to international market so as to reduce their production cost. In 1995 corn import decreased to 1.48 million tons, went down by 65.6%. From 1996 to 2008, the corn imports went back to low levels with an average of 80 thousand tons per year. But as domestic consumption increase, China had to import more corn from foreign countries. Corn import jumped from 0.05 million tons in 2008 to 1.30 million tons in 2009, an increase of 1.25 million tons. In 2011 it increased to 5.23 million tons, more than 5 times larger than that of 2010 (See Figure 3.6).
In 1990- 1993, the corn export was increased from 6.88 million tons in 1990 to 11.59 million tons in 1993 or by 68.5%. But in 1994 it sharply decreased to 1.33 million tons, down 10.26 million tons or 88.5% over the last year. The key reason causing this sharp reduction was corn prices in domestic market, which jumped 60% from 30.17 yuan/50kg in 1993 to 48.22 yuan/50kg in 1994. Facing high corn prices in China domestic market, producers or sellers tended to sell their products in domestic market rather than
24
international market, so corn for exports were reduced. When corn price touched a summit of 67 yuan/50kg in 1995, corn exports also moved to a minimum of 0.16 million tons, went down by 88% over the previous year. In 1996 corn prices began to decline, and corn exports had rebounded and stood at a historical high of 15.24 million tons in 2002. Corn exports are also impacted by domestic consumption, the decline since 2003 might be attributed to the rapid increasing domestic demand in China, in particular for industrial use and feed use. Corn consumption had increased from 128.4 million tons in 2003 to 207.0 million tons in 2012, an increase of 61.2%, and corn export had shrank from 7.55 million tons in 2003 to 0.05 million tons in 2012, went down 7.5 million tons or 99.3% (See Figure 3.6).
Figure 3.6 Import and export of corn in China during 1990-2012
Source: USDA, PSD Online 2013.
In 2009 corn production was 163.97 million tons, but the consumption increased to 165 million tons, 1.03 million tons larger than production, in 2010 the gap extended to 2.75
-10.0 -5.0 0.0 5.0 10.0 15.0 20.0
19901991199219931994199519961997199819992000200120022003200420052006200720082009201020112012
million tons
Net Export Import Export
25
million tons. This also changed the structure of corn imports and exports. In 2009, corn imports were 1.30 million tons, up 1.25 million tons from 0.05 million tons in the previous year, an increase of 96.2%, while corn exports decreased to 0.15 million tons. As a result, there was a net corn import of 1.15 million tons, in 2011 the corn net import was extended to 5.14 million tons, in 2012 the amount was 2.95 million tons. (See Figure 3.6).
3.4 Ending Stocks
Grain ending stocks are increasing in recent years, in 2012 the ending stocks of rice, wheat and corn were 46.62 million tons, 58.75 million tons and 63.29 million tons, respectively, increased 1.85 million tons, 0.76 million tons and 4.29 million tons or by 4.1%, 1.3% and 7.3% over that of 2011, respectively. As it is shown in movements of grain ending stocks, they were highly correlated to each other and moved simultaneously. From 1990 to 2012, the movements of grain ending stocks can be divided into 4 periods.
The first period is from 1990 to 1999, in this period the ending stocks had experienced rapid growth, and set high records for each grain in 1999, rice ending stocks increased by 3.6% from 94.00 million tons in 1990 to 97.35 million tons in 1999, wheat ending stocks increased from 49.94 million tons in 1990 to 102.94 million tons in 1999 by 106.1%, corn ending stocks were 123.80 million tons in 1999, an increase of 40.98 million tons or 49.5% over the level in 1990, we believe the high grain production contributes to these increases, the grain production in this period reached historical high in this period, the records were 140.5 million tons in 1997, 123.3 million tons in1997 and 133.0 million tons in 1998 for rice, wheat and corn, respectively; the second period is from 1999 to 2003, in which the ending stocks had exhibited dramatic and continuous declines, the ending stocks of rice decreased by 54.9% from 97.35 million tons in 1999 to 43.92 million tons in 2003,
26
wheat ending stocks were reduced from 102.94 million tons in 1999 to 43.29 million tons in 2003, a decrease of 57.9%, corn ending stocks were 44.85 million tons in 2003, a reduction of 78.95 million tons or 63.8% from that of 1999, these big decreases in grain ending stocks were mainly attributed to reductions in grain production. The production of rice, wheat and corn were 112.5 million tons, 86.5 million tons and 115.8 million tons, down 20.0%, 29.8% and 12.9% from their high records in 1997 or 1998 (See Figure 3.7).
Figure 3.7 Ending stocks of grains in China during 1990-2012
Source: USDA, PSD Online 2013.
The third period is from 2003 to 2007, when grain ending stocks remained at low levels, the averages were 38.66 million tons, 38.85 million tons and 38.33 million tons in this period for rice, wheat and corn, respectively; the fourth period is from 2007 to 2012, in which the grain ending stocks had experienced growth again, the ending stocks of rice, wheat and corn in 2012 were increased 8.86 million tons, 19.67 million tons and 24.89 million tons over the levels in 2007, up 23.5%, 50.3% and 64.8%, respectively, as we know,
0 20 40 60 80 100 120 140
1990 1991 1992 1993 1994 1995 1996 1997 1998 1999 2000 2001 2002 2003 2004 2005 2006 2007 2008 2009 2010 2011 2012
million tons
Rice Wheat Corn
27
grain production had showed significant increases in this period, this may promote grain ending stocks to increase (See Figure 3.7).
28
CHAPTER 4 MAJOR AGRICULTURAL POLICIES IN CHINA
Since middle 1990s, the grain prices have been on a sustained decline, resulting in a continuous drop in grain production, and a slowdown in the growth of farmers’ earnings for years and a widening of the gap between urban and rural residents in their incomes. This situation has an impact on the supply of farm produce and the country’s food security, thus affecting the development of the entire national economy and social stability. Therefore, the central government has persisted in the principle of “offering more, taking less and loosening control”. It dramatically increased support to agriculture, the rural economy and rural areas. Among the policies and measures, agricultural subsidy policies and grain minimum purchasing price policies are mainly for grain production, aiming to mobilize farmers’ enthusiasm for agricultural production, thus enabling grain production to rebound and enhancing farmers’ incomes.
4.1 Agricultural Subsidy Policies
Since China’s development entered a new phase, large scale fund supports are available for agricultural development. Since 2003 a series of agricultural subsidy policies has been paid to farmers under the guideline of “offering more, taking less and loosening control”. The subsidies include fine seed subsidies, grain direct subsidies, farm machinery subsidies, and comprehensive subsidies. To further consolidate the foundation of agriculture and increase the income of farmers, the central government decided in January 2005 to increase the effort to carry out the subsidy policy. In Opinions on a Number of Policies for Strengthening Rural Work and Raising the Overall Production Capacity of Agriculture, the CPC Central Committee and the State Council pointed out that these
29
effective policies should remain unchanged; the benefits given to farmers should not be reduced; and the support offered to agriculture should be continuously increased.
Figure 4.1 Changes in agricultural subsidy scales in China
Source: China Agricultural Development Report 2004- 2012.
Under this government’s guideline, the subsidy amount keeps increasing year by year, in 2003 it was 0.3 billion, only provided for wheat fine seed subsidies, in 2004 the fine seed subsidies were expanded to rice and corn, and grain direct subsidies and farm machinery subsidies came into enforce, the total subsidy amount jumped to 14.52 billion yuan; in 2005 the amount increased to 17.37 billion yuan, an increase of 2.85 billion yuan or 19.6% from that in 2004; in 2006 the comprehensive subsidies were started to be implemented with a value of 12 billion yuan, the total subsidies were increased to 30.95 billion, up 78.2% over the total amount in 2005; in 2008, the prices of agricultural inputs, such as fertilizer, diesel, were very high, increasing agricultural production costs for farmers, in order to make farmer still can gain from grain production, the central government decided to enhance the amount of comprehensive subsidy, the comprehensive
0 200 400 600 800 1000 1200 1400 1600
0 20 40 60 80 100 120 140 160
2003 2004 2005 2006 2007 2008 2009 2010 2011
yuan/ha billion yuan
Agricultural Subsidies Average subsidyies
30
subsidy was increased from 27.6 billion yuan in 2007 to 71.6 billion yuan in 2008, went up 159.4%. As a result, the total subsidies increased to 103.04 billion yuan in 2008, a big increase of 51.68 billion or 100.6% from that in 2007. In 2011 the total subsidy amount was 138.1 billion yuan, a historical high level, compared with 2008 and 2004, up 34% and 851.1%, respectively. Table 4.1 shows the rapid increases in total agricultural subsidies.
4.1.1 Fine Seed Subsidy
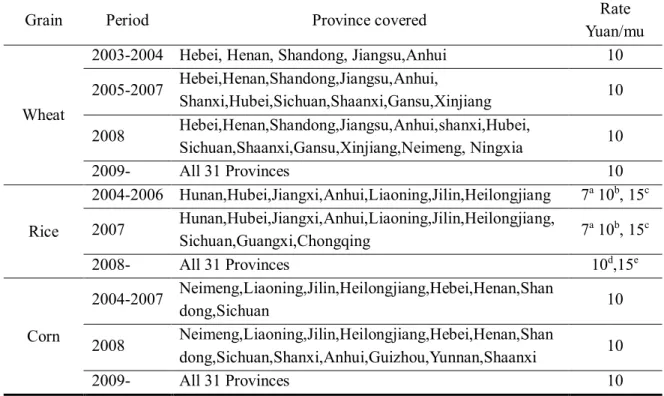
Fine seed subsidy for grains went into force in 2003. It is a direct payment to farmers and aims to encourage them to adopt fine seeds to enhance grain yields and qualities. For main grains, subsidies for fine seeds were first enforced in 2003 for wheat implemented in provinces of Hebei, Henan, Shandong, Jiangsu, and Anhui. In 2004 the scope and scale of experiments on subsidies for fine seeds were expanded to rice in the main producers of Hunan, Hubei, Jiangxi, Anhui, Liaoning, Jilin, Heilongjiang and corn in Neimeng, Liaoning, Jilin, Heilongjiang, Hebei, Henan, Shandong, Sichuan. In 2005, the covered areas for wheat were expanded to 11 main producing areas, 6 new provinces were included, they were Shanxi, Hubei, Sichuan, Shaanxi, Gansu, and Xinjiang provinces. In 2008 the covered areas were expanded to 13 provinces, Neimeng and Ningxia were newly included. In 2009 all 31 provinces and areas were covered by wheat fine seed subsidies.
The subsidy rate was 10 yuan per mu for each province.
For rice, the coverage of fine seed subsidies was expand to 10 provinces in 2007, three new areas were referred to Sichuan, Guangxi, and Chongqing and reached to all rice producers in 2008. The subsidy rate was 15yuan per mu for rice in Heilongjiang, Jilin, and Liaoning provinces; in Hunan, Hubei, Jiangxi and Anhui provinces, they were 10 yuan per mu for early season rice and 15 yuan per mu for middle grain rice and mid-season long
31
grain rice while those for late long grain rice were yet to be announced in 2004. The coverage of corn fine seed subsidies was increased to 13 provinces in 2008 from 8 provinces in 2004-2007, the newly implemented areas were Shanxi, Anhui, Guizhou, Yunnan, Shaanxi. Finally, all corn producing areas were subsidized in 2009. The subsidies were 10yuan per mu for corn in all implemented areas and remained unchanged since this policy went in enforce in 2004.
Table 4.1 Evolution of fine seed subsidies for rice, wheat and corn in China
Grain Period Province covered Rate
Yuan/mu
Wheat
2003-2004 Hebei, Henan, Shandong, Jiangsu,Anhui 10 2005-2007 Hebei,Henan,Shandong,Jiangsu,Anhui,
Shanxi,Hubei,Sichuan,Shaanxi,Gansu,Xinjiang 10 2008 Hebei,Henan,Shandong,Jiangsu,Anhui,shanxi,Hubei,
Sichuan,Shaanxi,Gansu,Xinjiang,Neimeng, Ningxia 10
2009- All 31 Provinces 10
Rice
2004-2006 Hunan,Hubei,Jiangxi,Anhui,Liaoning,Jilin,Heilongjiang 7a 10b, 15c 2007 Hunan,Hubei,Jiangxi,Anhui,Liaoning,Jilin,Heilongjiang,
Sichuan,Guangxi,Chongqing 7a 10b, 15c
2008- All 31 Provinces 10d,15e
Corn
2004-2007 Neimeng,Liaoning,Jilin,Heilongjiang,Hebei,Henan,Shan
dong,Sichuan 10
2008 Neimeng,Liaoning,Jilin,Heilongjiang,Hebei,Henan,Shan
dong,Sichuan,Shanxi,Anhui,Guizhou,Yunnan,Shaanxi 10
2009- All 31 Provinces 10
Source: China Agricultural Yearbook 2010. Note: a, b, c indicate subsidy rate for late season rice, early season rice and middle and medium grain rice before 2008, respectively; d and e indicate subsidy rate for early season rice and late, middle and medium grain rice after 2008, respectively.
Fine seed subsidies of wheat was first provided for farmers in 2003 at an amount of 0.1 billion yuan. In 2004, the central government also arranged 0.1 billion for fine subsidies of wheat. But in 2005 the subsidies began to show increases over the previous year, its amount jumped to 1 billion yuan, 10 times larger than that of the previous years. In 2008