九州大学学術情報リポジトリ
Kyushu University Institutional Repository
表意文字及び表音文字の読み処理における空間周波 数の異なる役割 : 高密度事象関連電位研究
堀江, 静
九州大学大学院医学系学府
https://doi.org/10.15017/21735
出版情報:Kyushu University, 2011, 博士(医学), 課程博士 バージョン:
権利関係:(C) 2011 Elsevier Ireland Ltd and the Japan Neuroscience Society.
Horie et al. 1/27
Title: Differential roles of spatial frequency on reading processes for ideograms and phonograms: A high-density ERP study
Authors and affiliations:
Shizuka Horiea, Takao Yamasakia,*, Tsuyoshi Okamotob, Taisuke Nakashimaa, Katsuya Ogataa, Shozo Tobimatsua
a) Department of Clinical Neurophysiology, Neurological Institute, Faculty of Medicine, Graduate School of Medical Sciences, Kyushu University, Fukuoka, Japan.
b) Kyushu University, Fukuoka, Japan.
*Corresponding author:
Takao Yamasaki, M.D., Ph.D.
Department of Clinical Neurophysiology, Neurological Institute, Graduate School of Medical Sciences, Kyushu University, 3-1-1 Maidashi, Higashi-ku, Fukuoka 812-8582, Japan E-mail: [email protected]
Tel.: +81-92-642-5542 Fax: +81-92-642-5545
Number of pages: 27; Number of figures: 7; Number of tables: 7
Horie et al. 2/27
Abstract
The neural substrate of the dissociation between reading Japanese ideograms (Kanji) and phonograms (Kana) is currently unclear. To test whether spatial frequency (SF) information is responsible for this phenomenon, we recorded high-density event-related potentials (ERPs) with unfiltered or spatially filtered word stimuli in Japanese-speaking subjects. Kanji (early-learned, late-learned), Kana (word, non-word), and scrambled characters served as stimuli. Fourier analysis revealed that Kanji and Kana were characterized by high-SF (HSF) and low-SF (LSF) information, respectively. In ERPs with unfiltered stimuli, bilateral occipital P100, left occipitotemporal N170 and fronto-central N400 were elicited. Scrambled characters did not evoke left-lateralized N170 or clear N400. Under the LSF condition, P100 and N170 latencies for Kanji were significantly longer than for Kana. In the HSF condition, P100 and N170 latencies for late-learned Kanji were significantly longer than for early-learned Kanji. There was no significant difference in the N400 between Kanji and Kana in both SF conditions. These results suggest that early visual responses, but not the semantic component, are
influenced by SF. This indicates a close link between Kana and LSF information, and between Kanji and HSF information. The differential effects of SF could underlie the neural basis of the differences between Kanji and Kana reading.
Keywords:
Reading; Japanese; Kanji; Kana; High spatial frequency (HSF); Low spatial frequency (LSF); Parallel visual pathways
Horie et al. 3/27
1. Introduction
The Japanese writing system consists of complex combinations of ideograms (Kanji) and phonograms (Kana) (Yamadori, 1975). Kanji is a logographic writing system using characters that directly correspond to words. In contrast, Kana is a syllabic writing system that involves direct phonetic reading. Japanese post-stroke patients sometimes show dissociative disturbances in reading between Kanji and Kana. For example, the ability to read Kanji was found to be selectively impaired by lesions of the posterior inferior temporal (IT) area, while lesions in the angular gyrus caused a
selective impairment of Kana reading (Yamadori, 1975; Iwata, 1984; Kawahata et al., 1988). Usui et al. (2009) applied electrical stimulation via subdural electrodes, revealing two functional areas for Kanji and Kana reading in the left posterior part of the basal temporal area, including the fusiform gyrus. Several neuroimaging studies have also demonstrated a Kanji-Kana dissociation in healthy subjects (Sakurai et al., 2000; Thuy et al., 2004). The activation of the lateral fusiform gyrus (BA 37) was found to be more pronounced in Kanji (Sakurai et al., 2000; Thuy et al., 2004). Conversely, Kana was found to activate the middle and inferior occipital gyri (BA 18/19) and the
temporo-parietal area (BA 40/22/21) (Sakurai et al., 2000). On the basis of these findings, a dual route model for reading has been proposed (Iwata, 1984; Sakurai et al., 2008). According to this hypothesis, there are two neural circuits between the visual and Wernicke’s areas. The ventral orthographic route consists of the inferior occipital, fusiform and posterior IT areas. This route involves the recognition of word-forms linked to semantics and processes Kanji characters/words and Kana words. In contrast, the dorsal phonological route includes inferior occipital, deep perisylvian
temporo-parietal and posterior superior temporal regions. This route contributes to the sequential letter or syllable recognition linked to phonology, and the processing of Kana characters.
Horie et al. 4/27
The neuropsychological and neuroimaging studies mentioned above have indicated that the Kanji-Kana dissociation is due to distinct neural circuits underlying each writing system. However, an alternative explanation is that the dissociation may be influenced by early visual factors as well as higher-level linguistic factors. Several lines of evidence support this alternative hypothesis. First, the visuospatial or configurational characteristics and visual features differ markedly between the two script types. Kanji ideograms are composed of multiple short strokes or lines drawn from top to bottom and left to right within the character. In contrast, Kana characters consist of simple curved lines, with the number of strokes ranging from one to four in each character (Fig.1a). Therefore, it is likely that Kanji and Kana are characterized by high-spatial frequency (HSF) and low-spatial frequency (LSF) components, respectively. Second, HSF and LSF information are distinctly processed by parallel visual pathways. The parvocellular (P) pathway projects to the IT, analyzing slow HSF information. The magnocellular (M) pathway connects to the parietal cortex, processing quick LSF information (Livingstone and Hubel, 1988; Tobimatsu and Celesia, 2006). Interestingly, the brain regions between the routes for reading and the parallel visual pathways
partially overlap. The ventral orthographic route and the P-pathway include the IT region, whereas the dorsal phonological route and the M-pathway rely on the parietal area. Third, a number of psychological and behavioral studies have established an important role of SF information in reading. For example, certain SF bands are more important than others for character recognition (Solomon and Pelli 1994; Alexander et al., 1994). Medium-SF and HSF information are important for optimal letter
identification (Majaj et al., 2002), while LSF information can provide global
information about a printed word such as length, general shape and location (Boden and Giaschi 2009). For these reasons, it is important to determine the effect of SF
information on reading to understand the neural basis of the Kanji-Kana dissociation.
Previous ERP studies of letter reading have revealed the involvement of
Horie et al. 5/27
sequential components, including the P100, N170 and N400 (Brem et al., 2006; Huber et al., 2008; Rhodes and Donaldson, 2008). Magnetoencephalography (MEG) studies have reported that the P100m originates in the occipital region and reflects basic visual feature analysis (Salmelin, 2007). The left-lateralized occipito-temporal response at approximately 200 ms (N170m) has been reported to be associated with letter-string analysis (Salmelin, 2007), while left superior temporal cortex activity at 200–600 ms (N400m) is thought to reflect lexical-semantic analysis (Pylkkanen and Marantz, 2003;
Salmelin, 2007). Only a few ERP studies have been conducted to investigate Kanji and Kana reading (Ishiwatari et al., 2002; Maurer et al., 2008). Ishiwatari et al. (2002) reported three phases of processing: the N150 for physical feature analyzing, the P200 for stimulus discrimination processing and a late positive component for semantic processing in Kanji and Kana reading. Differences in activity related to Kanji and Kana processing were found only in the late positive component (Ishiwatari et al., 2002).
Koyama (1998) investigated the sources of activity related to Kanji and Kana reading using MEG. They demonstrated that the first source (150–300 ms) was located in the posterior-inferior temporal areas, while the location of the second source (170–450 ms) was estimated in the perisylvian area regardless of whether Kanji or Kana was read (Koyama et al., 1998). To our knowledge, no ERP study has investigated the importance of SF information in reading Kanji and Kana.
We hypothesized that SF information is responsible for the dissociative
mechanisms underlying Kanji and Kana reading. To test these hypotheses, we recorded high-density ERPs in response to reading unfiltered (broad-band SF; BSF) and
SF-filtered (LSF, HSF) Kanji and Kana stimuli. The results revealed that sensitivity to distinct SF components differentially contributes to Kanji and Kana reading.
2. Materials and Methods
Horie et al. 6/27
2.1. Participants
Fourteen healthy adults (six males and eight females, mean age 22.4 years, range 20–26 years) with normal or corrected-to-normal visual acuity participated in this study. All subjects were native speakers of Japanese, and all were right-handed, as determined by the Edinburgh Handedness Inventory (Oldfield, 1971). No subject had a history of neurological or psychiatric disorders. Informed consent was obtained after the nature of the experiment had been fully explained. The experimental procedures were approved by the Ethics Committee of the Graduate School of Medical Sciences, Kyushu University.
2.2. Visual stimuli
The stimuli were generated using ViSaGe software (Cambridge Research Systems, Cambridge, U.K.) and displayed on a gamma-corrected color monitor with a frame rate of 100 Hz (Electron 22 blue IV, LaCie, Tokyo, Japan). All image processing was performed using MATLAB ver. 6.5 (The MathWorks Inc.).
Experiment 1 involved five types of BSF stimuli: Kanji (early-learned Kanji [EKj] and late-learned Kanji [LKj]), Kana (Kana word [KaW] and Kana non-word [KaN]) and scrambled word (ScW) stimuli (Fig. 1a). For all stimulus types, each
character subtended 2.0 × 2.0 degrees of visual angle. The mean luminance and contrast were controlled by normalizing the mean and standard deviation (SD) of all stimuli used (luminance, 70 ± 4 cd/m2 [mean ± SD]). The visual stimuli, including the background, consisted of 1024 × 768 pixels. To set the age of acquisition (AoA) to KaW equally, 30 EKj stimuli were chosen from the words learnt in the first and the second grade in elementary school. To evaluate the neural responses by AoA, 30 LKj stimuli were selected from the words learnt in the fifth and the sixth grade in elementary school. EKj and LKj stimuli consisted of words represented by two Kanji ideograms that could be
Horie et al. 7/27
phonetically transcribed as three Kana letters. KaW stimuli were transcriptions of the Kanji words used as LKj and EKj stimuli. KaN stimuli were produced from all KaW stimuli by changing the order of the syllables. Thus, 30 KaW and 30 KaN stimuli were created. Thirty ScW stimuli were produced from eight EKj, 7 LKj, eight KaW and seven KaN stimuli. To create ScW stimuli, EKj, LKj, KaW and KaN images were divided into four blocks per character, and each block was rotated, reversed or shuffled randomly before rejoining the blocks. Overall, each stimulus included 30 images, a total of 150 images (see Appendices 1 and 2).
In Experiment 2, to create the HSF and LSF stimuli, we manipulated the SF information of the BSF stimuli with image engineering techniques, using
two-dimensional fast Fourier transform (2D-FFT) (Nakashima et al., 2008). An 85-order Hamming window method was used for creating LSF images, while HSF images were created using a 31-order Hamming window method. The cut-off frequencies (3.6 cycles/character for LSF; 20.8 cycles/character for HSF) were determined by measuring the psychophysical threshold for the recognition of word images in 22 additional subjects (11 females and 11 males; age range, 20–40 years) prior to the ERP recordings. Thus, the LSF and HSF stimuli were suprathreshold stimuli, and were easily readable during ERP experiments. The mean luminance and contrast were controlled by normalizing the mean and SD of all stimuli (luminance, 70 ± 4 cd/m2). Representative examples of the stimuli are shown in Fig. 2a, c. The visual stimuli including the background consisted of 1024 × 768 pixels. Each word stimulus was presented using the same procedures as in Experiment 1.
The readability of spatially filtered (HSF and LSF) word stimuli (EKj, LKj, KaW and KaN) was tested by measuring reaction time (RT) in five subjects (two males and three females, age range; 26 –31 years) before we performed two ERP experiments.
Three of five subjects participated in the later ERP experiments. Each stimulus was randomly presented 30 times for 800 ms, alternating with a central fixation point
Horie et al. 8/27
presented for 1,200 ms. The subjects were instructed to press the button as quickly as possible with their right thumb when they could read the word stimuli.
2.3. Comparison of imaging properties among the stimuli
The physical characteristics (means of the power spectrum distribution) of character stimuli were evaluated using 2D-FFT. The mean distribution was estimated from each 2D-FFT of 30 stimuli used in this study. Each pixel in the image represents the amplitude of a sine-wave grating within the image with a specific orientation (circular component) and SF (radial component). To compare the characteristics between EKj and KaW, the mean FFT power spectra for EKj were subtracted from those of KaW. To further evaluate the physical imaging properties of the alphabet, we calculated the mean of the power spectrum distribution of 30 alphabetic 3-letter words as Kanji or Kana (Fig. 3).
In addition, we conducted a comparison of the number of strokes in each stimulus. One-way repeated-measures ANOVA was performed to determine the effect of the number of strokes. Multiple comparisons with a Bonferroni correction were conducted for paired comparisons.
2.4. ERP recording
Each stimulus was randomly presented for 800 ms on a gray background, alternating with a central fixation point presented for 1,200 ms. Each stimulus was presented 18 times in a single session (approximately 200 times in total). EEG data were acquired using a high-density 128-channel EGI system of NetAmps 200
(Electrical Geodesics Inc. [EGI], Eugene, Oregon). Continuous EEG was recorded with a 128-channel Geodesic Sensor Net (Tucker, 1993) using Cz as the reference. The analog data were digitized at a sampling rate of 500 Hz/channel. Amplified analog voltages were hardware band-pass-filtered at 0.1–200 Hz. Electrode impedances were
Horie et al. 9/27
kept below 50 kΩ, an acceptable range given the high input impedance amplifiers in this system. The subjects were seated comfortably in a dark sound-attenuated chamber and instructed to fixate on the fixation point in the center of the screen and read silently when a word stimulus appeared. Silent reading tasks are generally used in ERP studies of reading (Niznikiewicz and Squires, 1996; Liu and Perfetti, 2003; Newman and Connolly, 2004) because they provide a comprehensive understanding of the
phonological information, similar to reading aloud (Niznikiewicz and Squires, 1996), but without the difficulty of motion artifacts during ERP recording. The arousal level was carefully monitored throughout the experiment. If the subjects were becoming drowsy, we alerted them and gave a brief rest.
After ERP recording, all participants performed a written test of word meanings for the stimuli used in our ERP study, to evaluate their comprehension of Kanji.
2.5. Data analysis of high-density ERPs
Off-line analyses of the data were performed usingNet Station software (Electrical Geodesics, Inc. USA). EEG waveforms were filteredusing a 1–100 Hz band-pass filter and a 60 Hz notch filter before segmentation. The time window was 100 ms prior to and 800 ms after the stimulus onset. Trials were marked “bad” if the average amplitude exceeded 100 μV, if they contained more than 10 bad channels, or if they contained eye movement in excess of 55 μV. These automated criteria were
supplemented by visual inspection. In the remainingtrials, data for bad channels were replaced by interpolations from the remaining channels using Net Station software.
They were then re-referenced offline to the average of the two electrodes around the nose tip for analysis. The nose reference is commonly used in visual ERP studies (Murray et al., 2001; Brenner et al., 2009; Verleger et al., 2011). A total of 200 responses were then averaged for each stimulus, and baseline-corrected. A baseline
Horie et al. 10/27
correction was applied to the 100 ms before target onset. The peak amplitudes and latencies of the major components were measured from the prestimulus baseline for each stimulation in each subject. To determine the peak locations in each major component, we evaluated the scalp topography of each major component using MATLAB ver. 6.5.
2.6. Statistical analyses
In Experiment 1, we performed two-way ANOVA with repeated measures to determine the effects of the stimulus types and laterality on the amplitudes and peak latencies of P100 and N170 components. The data for the N400 component were analyzed using one-way ANOVA on the stimulus types because the N400 was not lateralized (Fig. 4c). Multiple comparisons with Bonferroni correction were also conducted for paired comparisons when the overall ANOVA showed reliable differences among stimulus types, laterality and their interactions, respectively. In Experiment 2, three-way ANOVA with repeated measures was performed to determine the effects of the stimulus types, laterality and SF for P100 and N170. For the N400, two-way ANOVA was carried out to test the effects of the stimulus types and SF.
Multiple comparisons were applied when overall ANOVA revealed significant effects for stimulus type, SF, laterality and their interactions, respectively. A level of p < 0.05 was considered statistically significant. All statistical analyses were performed using SPSS 11.5.1 J (SPSS Inc.).
3. Results
Behavioral data (RT and error rate) were not recorded during ERP measurement. However, in the behavioral pilot study, there were no significant differences in mean RTs among the stimuli (Appendix 3). After ERP recording all
Horie et al. 11/27
subjects reported that they had been able to read the HSF and LSF stimuli easily (except for the scrambled word [ScW] stimuli). Thus, we believe that our spatially filtered stimuli were controlled in terms of psychological context. In addition, subjects performed the writing test for Kanji reading with 100% accuracy.
3.1. Imaging properties
The physical image properties of each character stimulus are shown in Fig. 1b and 2b, d. As expected, Kanji (EKj and LKj) images primarily contained the horizontal and vertical components of 2D-SF. Conversely, Kana (KaW and KaN) images were comprised of multi-directional components. The 2D-SF component of ScW stimuli was considered to be analogous in response to Kanji and Kana stimuli. The subtraction analyses of the mean FFT between KaW and EKj revealed that KaW contained stronger LSF components (1–15 cycle/width) than EKj, while EKj contained stronger HSF components (60–90 cycle/width) compared to KaW (Fig. 1c). Each range of subtracted SF fit the cut-off frequencies of our stimuli (10.9 cycles/3 characters for LSF; 62.3 cycles/3 characters for HSF). Furthermore, the image properties of the alphabet were comprised of multi-directional constituents, as in Kana images (Fig. 3).
The main effect of the number of strokes was significant (F(1,29) = 46.3013, p
< 0.001) (Appendices 1 and 2). As expected, Kanji contained more HSF information.
KaW contained a significantly lower number of strokes than EKj and LKj (p < 0.01).
The mean number of the strokes in EKj was significantly lower than in LKj (p < 0.01).
3.2. Major ERP components under the BSF condition
Three major components (P100, N170 and N400) were exhibited in response to all character stimuli in Experiment 1 (Fig. 4).
The P100 was predominantly distributed over bilateral occipital areas (maximum at O1 and O2) in all stimuli (Fig. 4a). Thus, we examined the ERP data at
Horie et al. 12/27
O1 and O2 for further analysis (Table 1). The results of the ANOVA are summarized in Table 2. Between the hemispheres, there were no significant differences in the
amplitude or latency of the P100 in all stimuli. Thus, the P100 was bilaterally
distributed, rather than lateralized. A significant main effect due to stimulus type was found in the P100 amplitude (p < 0.01). Specifically, the amplitude for KaW was significantly larger than that of EKj (equal AoA)(p < 0.01). A significantly larger amplitude was also found in response to ScW compared to EKj stimuli (p < 0.01).
However, there was no significant difference in the amplitude between Kanji (EKj and LKj), or between Kana (KaW and KaN).
The N170 was lateralized and distributed over the left occipitotemporal region, especially at PO7 (10-10 system) (Fig. 4b). Therefore, the ERP data at PO7 and its homologous electrode (PO8) were further analyzed (Table 1). Significant effects due to stimulus type, laterality and stimulus type × laterality were found in the N170 amplitude.
The main effect of stimulus type was also significant in the N170 latency (p < 0.01).
Between the hemispheres, the N170 amplitudes were significantly larger in the left hemisphere (EKj, p < 0.05; KaW, p < 0.01; KaN, p < 0.01) (Table 2). Conversely, there was no significant difference in N170 amplitude for ScW stimuli between the
hemispheres. Among the stimuli, responses to KaW showed a significantly larger amplitude (p < 0.01) and shorter latency (p < 0.01) than those of EKj stimuli. Thus, the N170 response was significantly different between EKj and KaW (equal AoA) stimuli, as in the P100 response. However, there was no significant difference in the N170 response between Kanji (EKj and LKj) or between Kana stimuli (KaW and KaN).
The N400 was observed at central areas (maximum at Cz) in response to all stimuli except ScW (Fig. 4c). Therefore, ERP data at Cz were used for further analysis (Table 1). The ERP data regarding the N400 for ScW was excluded from the ANOVA because it was not elicited for five of 14 subjects, and was poorly defined in the rest.
One-way ANOVA revealed that the effect of stimulus type was significant in the N400
Horie et al. 13/27
responses. In contrast to the P100 and N170, there was no significant difference in the N400 response between Kanji and Kana (Table 2). However, there were significant differences in the N400 response between KaW and KaN, and also EKj and LKj. The N400 amplitude in response to KaN was significantly larger than that in response to KaW stimuli (p < 0.01). Moreover, the N400 latency for KaW was significantly shorter than for KaN (p < 0.001). The N400 latency for EKj was significantly shorter than for LKj stimuli (p < 0.01).
3.3. Differential effects of HSF and LSF on ERP components
Three major components (P100, N170 and N400) were elicited by all stimuli under HSF and LSF conditions in Experiment 2, similar to the BSF condition (Figs.
5–7). Table 3 shows the mean peak amplitudes and latencies. The major ANOVA results are summarized in Table 4.
A three-way ANOVA (stimulus type × SF × laterality) revealed a significant effect of the interaction between stimulus type × SF on P100 latency. Regarding the P100 under the LSF condition (Fig. 5a), the latencies of responses to EKj (p < 0.01) and LKj stimuli (p < 0.01) were significantly longer than that of response to KaN stimuli in both hemispheres. The latency of responses to LKj stimuli was also significantly longer than that for KaW stimuli (p < 0.05) in both hemispheres. In the HSF condition (Fig.
5b), the latency of responses to LKj stimuli was significantly longer than for EKj stimuli (p < 0.001). There was no significant effect of SF on the amplitude of the P100 for any stimulus type.
A left-lateralized N170 was elicited in both SF conditions. A significant interaction effect among stimulus type × SF × laterality was found for N170 latency.
For the N170 under the LSF condition (Fig. 6a), the latency of responses to EKj and LKj were significantly longer than of the latency of responses to KaW in the left
hemisphere (EKj vs. KaW, p < 0.05; LKj vs. KaW, p < 0.05). In the HSF condition (Fig.
Horie et al. 14/27
6b), the N170 latency of responses to LKj was significantly longer than that of responses to EKj in both hemispheres (p < 0.05). No significant differences in N170 responses to ScW were observed between SF conditions in both hemispheres. There was no significant effect of SF on the amplitude of the N170 amplitude for any stimulus type.
The scalp topography of the N400 under the two SF conditions differed from that of the BSF condition, exhibiting a centro-occipital distribution in the HSF condition (Fig. 7a) vs. a centro-frontal distribution under the LSF condition (Fig. 7b). Since the N400 was distributed at central regions (maximum at Cz) under the BSF condition (Experiment 1), the difference in N400 among the SF conditions was analyzed using the ERP data at the Cz electrode. The data of N400 for ScW were excluded from the
ANOVA analysis because it was only elicited in only eight of 14 subjects. There were significant main effects of stimulus type (p < 0.01) and SF (p < 0.05) in N400 latency.
However, there was no significant difference between Kanji and Kana. No significant interaction effect was found for the latency or amplitude of the N400.
4. Discussion
The results clearly demonstrated that LSF and HSF information contributed differentially to reading Kanji and Kana at the early level of visual processing, but not at the level of semantic processing. Our findings also suggest a close link between Kana reading and LSF information, and between Kanji reading and HSF information.
4.1. Different image properties between Kanji and Kana
Based on a psychophysical study, Osaka (1992) reported that the critical SF for Kana reading was lower than for Kanji. Using the subtraction method of Fourier power spectral analysis, we found that Kana contained a stronger contribution of LSF
Horie et al. 15/27
components, whereas Kanji contained a stronger contribution from HSF components.
This is likely due to the significantly greater number of strokes used in Kanji compared to Kana. Thus, it appears that Kanji and Kana are largely characterized by HSF and LSF components, respectively.
4.2. Physiological implications of major ERP components under the BSF condition
In the BSF condition (Experiment 1), the P100 was predominantly distributed over bilateral occipital regions for all stimuli. In a previous MEG study, activation in the occipital area at around 100 ms was detected during silent reading (Tarkiainen et al., 1999). The sources of the P100m are not thought to exhibit object specificity, because amplitudes are the same for letter and symbol strings of equal length (Salmelin, 2007).
Accordingly, Tarkiainen et al. (1999) assumed that the P100m reflected basic visual feature analysis. Therefore, the non-lateralized P100 found in our study implies that the visual physical-form analysis occurs within bilateral occipital areas.
The N170 is characterized by left-lateralized activation in the occipitotemporal area. It is widely acknowledged that the visual word-form area (VWFA) contributes to the identification of visual word shape without semantic modulation. The VWFA is located in the left IT (Cohen et al., 2000), and is well correlated with the N170 in response to word stimuli (Brem et al., 2006). Thus, the N170 observed in our study is likely to reflect left-lateralized word-form processing within the VFWA. Although responses to ScW stimuli showed no significant difference between hemispheres, ScW stimuli might be processed as objects rather than words (Rossion et al., 2003).
The N400 has been proposed to reflect semantic word processing (Kutas and Hillyard, 1980; Frisch, and Schlesewsky, 2001;Hagoort et al., 2004; Meng et al., 2008).
In the current study, the N400 was clearly evoked by both Kana and Kanji stimuli.
However, the N400 for ScW was not clear in several subjects, suggesting that ScW stimuli were not identified as words. It is well established that non-semantic word
Horie et al. 16/27
stimuli induce a slower but larger N400 response due to semantic violations (Hagoort et al., 2004). The present study clearly demonstrated a significantly prolonged latency with a larger amplitude of the N400 in response to non-words (KaN) compared with the response to words (KaW). Therefore, the present results indicate that the N400 reflects semantic word processing.
4.3. Differential effects of SF information on Kanji and Kana reading
In a comparison of responses to Kanji and Kana stimuli, the P100 for Kana stimuli was significantly larger in amplitude in the BSF condition, although there was no significant difference in P100 latency between Kanji and Kana. This finding indicates that physical-form processing is more important for Kana than Kanji
characters at an early stage of visual processing. Kanji mainly contains horizontal and vertical components, whereas Kana is comprised of multi-directional components (see Fig. 1). This notion is supported by the finding that the P100 response to ScW stimuli, characterized by more multi-directional components compared with Kanji, was larger in the BSF condition, compared to the response to Kanji stimuli. This indicates that the multi-directional SF information in Kana may require stronger activation for initial physical-form processing. Interestingly, a significant difference in P100 latency between Kanji (EKj and LKj) was only observed in the HSF condition. In our stimuli, the physical image properties of EKj and LKj are comparable. However, there are more strokes in LKj compared to EKj. This suggests that the word form of LKj is more complex than that of EKj, resulting in a difference in the amount of HSF information between EKj and LKj stimuli. Therefore, HSF information appears to be more important for physical-form processing during Kanji reading.
The N170 latency in response to Kanji reading was longer than for Kana in the LSF condition. FFT analysis revealed that Kana reading was associated with a stronger
Horie et al. 17/27
contribution from LSF components, indicating that LSF information of Kana characters may induce faster activation of brain regions related to visual word-form processing.
Furthermore, the difference in N170 latency between EKj and LKj was only observed in the HSF condition, as with the P100. Thus, HSF information appears to be important for word-form processing as well as physical-form processing during Kanji reading.
In contrast to the P100 and N170, there was no significant SF effect on either the latency or amplitude of the N400 response for both Kanji and Kana. This result indicates that SF information does not affect semantic processing. Therefore, SF information is responsible for the distinct processing between Kanji and Kana characters, affecting the lower-level processing involved in reading, such as physical-form and word-form visual processing.
4.4. Neural basis of Kanji and Kana reading
Previous studies have proposed distinct neural circuits underlying the reading systems of Kanji and Kana: The ventral orthographic and dorsal phonological routes.
This view is supported by the findings from previously mentioned neuropsychological studies and neuroimaging studies with high spatial resolution (Iwata, 1984; Kawahata et al., 1988; Thuy et al., 2004; Sakurai et al., 2008). Similarly, one study reported that inducing transient functional suppression of the left posterior IT cortex using repetitive transcranial magnetic stimulation disturbed the retrieval of visual graphic
representations of Kanji (Ueki et al., 2006). On the contrary, previous scalp-recorded ERP and MEG studies, with high temporal resolution, have not produced consistent findings regarding the differences in processing between Kanji and Kana (Koyama et al., 1998; Ishiwatari et al., 2002). Thus, the present ERP study provides the first evidence for temporal differences in processing between Kanji and Kana when SF information is manipulated. In particular, we found close links between Kana reading and LSF
information, and between Kanji reading and HSF information. Previous studies have
Horie et al. 18/27
emphasized the effect of the differences between ideograms and phonograms in determining the different mechanisms by which Kanji and Kana are processed (Iwata, 1984; Thuy et al., 2004). However, the present data suggest that different processing mechanisms are already involved at the early levels of visual processing, well before the stage of semantic processing.
It has been well established that the neural response in visual word recognition is influenced by the AoA of the word being processed (Cuetos et al., 2009). However, an ERP study using visual word stimuli reported that late-acquired words evoked a stronger negative response, peaking at the central electrode between 400 and 610 ms, compared to early-acquired words (Cuetos et al., 2009). Kana is typically learned between 4–7 years of age, while Kanji is acquired over a longer period, from 7 years to adulthood. This indicates that Kanji is more difficult to read than Kana. Sugishita et al.
(1992) argued that the divergence of Kanji and Kana processing is caused by
differences among the abilities of individuals, or the level of difficulty of each character.
Thus, it remains to be determined whether the divergence between Kanji and Kana processing is a function of AoA, or a difference in the writing systems themselves. The current study demonstrated that ERP activities differed significantly between EKj and KaW, even though AoA was comparable. Thus, it is unlikely that the divergence of Kanji and Kana processing was caused by the difference in AoA. Therefore, we propose that filtered but not unfiltered BSF stimuli are useful for demonstrating the temporal differences in processing between Kanji and Kana.
4.5. Relationship between the parallel visual pathways and Kanji and Kana reading
Our results indicate close links between Kanji reading and HSF information and between Kana reading and LSF information. HSF and LSF information are distinctly processed in the P- and M-pathways, respectively (Tobimatsu and Celesia, 2006). These findings suggest that Kanji is mainly processed by the P-pathway while
Horie et al. 19/27
the M-pathway is more important for Kana reading before the stage of semantic processing.
A psychological study reported a possible link between reading and the parallel visual pathways (Allen et al., 2009). The letter-level channel is mapped onto the
P-pathway that utilizes HSF information while word-level processing is involved in the sensitivity of the M-pathway to LSF information. When applying the model of Allen et al. (2009) to our results, Kanji is mainly processed by the letter-level channel mapped onto the P-pathway, because Kanji is the ideogram in which each character represents meaning units. On the other hand, Kana is a syllabic writing system in which each symbol represents a syllable, combinations of which are processed as whole words, as in other phonetic languages (Bolger et al., 2005 Kana characters are not only orthographically parallel in terms of the alphabet, but are also similar in their image properties, comprising multi-directional components (Fig. 3).
The reading of alphabetical words requires global whole-word processing of LSF information (Allen et al., 1995; Boden and Giaschi, 2009). These findings support our proposal that LSF information (i.e. the M-pathway) is important for reading Kana.
In conclusion, the present results revealed that early visual P100 and N170 responses, but not the semantic N400 component, were significantly influenced by SF.
These findings indicate a close physiological link between Kanji reading and HSF information, and between Kana reading and LSF information. Therefore, SF
information appears to be responsible for the distinct processing between Kanji and Kana characters at the early stages of visual processing before semantic processing occurs.
Acknowledgments
Horie et al. 20/27
This work was supported in part by Grants-in-Aid for Scientists, No.
18659259 (to S.T.) and No. 20591026 (to T.Y.), from the Ministry of Education, Culture, Sports, Science and Technology of Japan. We would like to thank Ms. Ikue Ijichi and Ms. Yuka Miyanaga for their technical contributions.
Horie et al. 21/27
References
Alexander, K.R., Xie, W., Derlacki, D.J., 1994. Spatial-frequency characteristics of letter identification. J. Opt. Soc. Am. A. Opt. Image Sci. Vis. 11, 2375-2382.
Allen, P.A., Smith, A.F., Lien, M.C., Kaut, K.P., Canfield, A., 2009. A multistream model of visual word recognition. Atten. Percept. Psychophys. 71, 281-296.
Allen, P.A., Wallace, B., Weber, T.A., 1995. Influence of case type, word frequency, and exposure duration on visual word recognition. J Exp Psychol Hum Percept Perform. 21, 914-934.
Boden, C., Giaschi, D., 2009. The role of low-spatial frequencies in lexical decision and masked priming. Brain Cogn. 69, 580-591.
Bolger, D.J., Perfetti, C.A., Schneider, W., 2005. Cross-cultural effect on the brain revisited: Universal structures plus writing system variation. Hum. Brain. Mapp.
25, 92-104.
Brem, S., Bucher, K., Halder, P., Summers, P., Dietrich, T., Martin, E., Brandeis, D., 2006. Evidence for developmental changes in the visual word processing network beyond adolescence. Neuroimage 29, 822-837.
Brenner, C.A., Krishnan, G.P., Vohs, J.L., Ahn, W.Y., Hetrick, W.P., Morzorati, S.L., O'Donnell, B.F., 2009. Steady state responses: Electrophysiological assessment of sensory function in schizophrenia. Schizophr. Bull. 35, 1065-1077.
Cohen, L., Dehaene, S., Naccache, L., Lehericy, S., Dehaene-Lambertz, G., Henaff, M.A., Michel, F., 2000. The visual word form area: Spatial and temporal characterization of an initial stage of reading in normal subjects and posterior split-brain patients. Brain 123 ( Pt 2), 291-307.
Cuetos, F., Barbon, A., Urrutia, M., Dominguez, A., 2009. Determining the time course of lexical frequency and age of acquisition using ERP. Clin. Neurophysiol.
120, 285-294.
Horie et al. 22/27
Frisch, S., Schlesewsky, M., 2001. The N400 reflects problems of thematic hierarchizing. Neuroreport 12, 3391-3394.
Hagoort, P., Hald, L., Bastiaansen, M., Petersson, K.M., 2004. Integration of word meaning and world knowledge in language comprehension. Science 304, 438-441.
Huber, D.E., Tian, X., Curran, T., O'Reilly, R.C., Woroch, B., 2008. The dynamics of integration and separation: ERP, MEG, and neural network studies of immediate repetition effects. J. Exp. Psychol. Hum. Percept. Perform. 34, 1389-1416.
Ishiwatari, K., Koga, Y., Nagata, K., 2002.
63-69
Iwata, M., 1984. Kanji vs. Kana. Neuropsychological correlates of the Japanese writing system. Trends Neurosci. 7, 290-293.
Kawahata, N., Nagata, K., Shishido, F., 1988. Alexia with agraphia due to the left posterior inferior temporal lobe lesion-neuropsychological analysis and its pathogenetic mechanisms. Brain Lang. 33, 296-310.
Koyama, S., Kakigi, R., Hoshiyama, M., Kitamura, Y., 1998. Reading of japanese kanji (morphograms) and kana (syllabograms): A magnetoencephalographic study.
Neuropsychologia 36, 83-98.
Kutas, M., Hillyard, S.A., 1980. Reading senseless sentences: Brain potentials reflect semantic incongruity. Science 207, 203-205.
Liu, Y., Perfetti, C.A., 2003. The time course of brain activity in reading english and chinese: An ERP study of chinese bilinguals. Hum. Brain Mapp. 18, 167-175.
Livingstone, M., Hubel, D., 1988. Segregation of form, color, movement, and depth:
Anatomy, physiology, and perception. Science 240, 740-749.
Majaj, N.J., Pelli, D.G., Kurshan, P., Palomares, M., 2002. The role of spatial frequency channels in letter identification. Vision Res. 42, 1165-1184.
Maurer, U., Zevin, J.D., McCandliss, B.D., 2008. Left-lateralized N170 effects of
Horie et al. 23/27
visual expertise in reading: Evidence from japanese syllabic and logographic scripts. J. Cogn. Neurosci. 20, 1878-1891.
Meng, X., Jian, J., Shu, H., Tian, X., Zhou, X., 2008. ERP correlates of the development of orthographical and phonological processing during chinese sentence reading. Brain Res. 1219, 91-102.
Murray, M.M., Foxe, J.J., Higgins, B.A., Javitt, D.C., Schroeder, C.E., 2001.
Visuo-spatial neural response interactions in early cortical processing during a simple reaction time task: A high-density electrical mapping study.
Neuropsychologia 39, 828-844.
Nakamura, K., Dehaene, S., Jobert, A., Le Bihan, D., Kouider, S., 2005. Subliminal convergence of kanji and kana words: Further evidence for functional parcellation of the posterior temporal cortex in visual word perception. J. Cogn. Neurosci. 17, 954-968.
Nakashima, T., Goto, Y., Abe, T., Kaneko, K., Saito, T., Makinouchi, A., Tobimatsu, S., 2008. Electrophysiological evidence for sequential discrimination of positive and negative facial expressions. Clin. Neurophysiol. 119, 1803-1811.
Newman, R.L., Connolly, J.F., 2004. Determining the role of phonology in silent reading using event-related brain potentials. Brain Res. Cogn. Brain Res. 21, 94-105.
Niznikiewicz, M., Squires, N.K., 1996. Phonological processing and the role of strategy in silent reading: Behavioral and electrophysiological evidence. Brain Lang. 52, 342-364.
Oldfield, R.C., 1971. The assessment and analysis of handedness: The edinburgh inventory. Neuropsychologia 9, 97-113.
Osaka, N., 1992. Size of saccade and fixation duration of eye movements during reading: Psychophysics of japanese text processing. J. Opt. Soc. Am. A. 9, 5-13.
Pylkkanen, L., Marantz, A., 2003. Tracking the time course of word recognition with
Horie et al. 24/27
MEG. Trends Cogn. Sci. 7, 187-189.
Rhodes, S.M., Donaldson, D.I., 2008. Association and not semantic relationships elicit the N400 effect: Electrophysiological evidence from an explicit language
comprehension task. Psychophysiology 45, 50-59.
Rossion, B., Joyce, C.A., Cottrell, G.W., Tarr, M.J., 2003. Early lateralization and orientation tuning for face, word, and object processing in the visual cortex.
Neuroimage 20, 1609-1624.
Sakurai, Y., Terao, Y., Ichikawa, Y., Ohtsu, H., Momose, T., Tsuji, S., Mannen, T., 2008. Pure alexia for kana. characterization of alexia with lesions of the inferior occipital cortex. J. Neurol. Sci. 268, 48-59.
Sakurai, Y., Momose, T., Iwata, M., Sudo, Y., Ohtomo, K., Kanazawa, I., 2000.
Different cortical activity in reading of kanji words, kana words and kana nonwords. Brain Res. Cogn. Brain Res. 9, 111-115.
Salmelin, R., 2007. Clinical neurophysiology of language: The MEG approach. Clin.
Neurophysiol. 118, 237-254.
Solomon, J.A., Pelli, D.G., 1994. The visual filter mediating letter identification.
Nature 369, 395-397.
Sugishita, M., Otomo, K., Kabe, S., Yunoki, K., 1992. A critical appraisal of
neuropsychological correlates of Japanese ideogram (kanji) and phonogram (kana) reading. Brain 115 ( Pt 5), 1563-1585.
Tarkiainen, A., Helenius, P., Hansen, P.C., Cornelissen, P.L., Salmelin, R., 1999.
Dynamics of letter string perception in the human occipitotemporal cortex. Brain 122, 2119-2132.
Thuy, D.H., Matsuo, K., Nakamura, K., Toma, K., Oga, T., Nakai, T., Shibasaki, H., Fukuyama, H., 2004. Implicit and explicit processing of kanji and kana words and non-words studied with fMRI. Neuroimage 23, 878-889.
Tobimatsu, S., Celesia, G.G., 2006. Studies of human visual pathophysiology with
Horie et al. 25/27
visual evoked potentials. Clin. Neurophysiol. 117, 1414-1433.
Tucker, D.M., 1993. Spatial sampling of head electrical fields: The geodesic sensor net.
Electroencephalogr. Clin. Neurophysiol. 87, 154-163.
Ueki, Y., Mima, T., Nakamura, K., Oga, T., Shibasaki, H., Nagamine, T., Fukuyama, H., 2006. Transient functional suppression and facilitation of Japanese ideogram writing induced by repetitive transcranial magnetic stimulation of posterior inferior temporal cortex. J Neurosci. 26, 8523-8530.
Usui, K., Ikeda, A., Nagamine, T., Matsuhashi, M., Kinoshita, M., Mikuni, N., Miyamoto, S., Hashimoto, N., Fukuyama, H., Shibasaki, H., 2009. Temporal dynamics of Japanese morphogram and syllabogram processing in the left basal temporal area studied by event-related potentials. J Clin Neurophysiol. 26, 160-166.
Verleger, R., Smigasiewicz, K., Moller, F., 2011. Mechanisms underlying the left visual-field advantage in the dual stream RSVP task: Evidence from N2pc, P3, and distractor-evoked VEPs. Psychophysiology. 1-11.
Yamadori, A., 1975. Ideogram reading in alexia. Brain. 98, 231-238.
Horie et al. 26/27
Figure Legends
Fig. 1. Representative word stimuli for BSF stimuli used in this study (a). The mean two-dimensional (2D) FFT power spectra of the BSF condition are plotted as follows: x, y = spatial frequency (cycles/image); z = power (arbitrary units, au) (b). The
comparison between KaW and EKj distilled for the 0–105 cycles/image range (c).
Abbreviations in this and subsequent figures: BSF, broadband spatial frequency; HSF, high spatial frequency; LSF, low spatial frequency; EKj, early-learned Kanji; LKj, late-learned Kanji; KaW, Kana word; KaN, Kana non-word; ScW, scrambled word;
FFT, fast Fourier transformation.
Fig. 2. Representative word stimuli for HSF (a) and LSF (c) used in this study. The mean 2 D-FFT power spectra of the HSF (b) and LSF (d) conditions are plotted against a straight line designated x, y = spatial frequency (cycles/image), and z = power (au) (b).
Fig. 3. An example of an alphabetical word for BSF, and the 2D FFT power spectra, are plotted as follows: x, y = spatial frequency (cycles/image); z = power (au).
Fig. 4. Grand average waveforms of ERPs and scalp topography in response to each stimulus under the BSF condition. P100 (a, left), N170 (b, left) and N400 (c, left) are elicited as major components irrespective of character stimuli. Scalp topographies reveal the well-defined peaks of P100 in bilateral occipital regions (a, right), N170 in the left temporal area (b, right) and N400 in the fronto-central region (c, right). Note that the left lateralized N170 and N400 in response to ScW were not well defined. Color bars represent the amplitude values (red = positive, blue = negative) in this and
subsequent figures. The responses are viewed either from the back or from the top.
Horie et al. 27/27
Fig. 5. Grand average waveforms of the P100 and scalp topography in response to each stimulus under LSF (a) and HSF (b) conditions. The P100 was evoked by all stimuli in both conditions. Scalp topography revealed that the P100 was predominantly distributed over bilateral occipital areas in both conditions. In the LSF condition (a), the latencies for EKj and LKj were significantly longer than that for KaN. A significantly longer latency was also observed for LKj compared with KaW stimuli. In the HSF condition (b), the latency for LKj was significantly longer than that for EKj. For visual
presentation, the optimal time window was chosen to most clearly illustrate the significant ERP changes in this and subsequent figures.
Fig. 6. Grand average waveforms of the N170 and scalp topography in response to each stimulus under the LSF (a) and HSF (b) conditions (PO7). The scalp topography shows that the N170, except for ScW, was lateralized to the left occipitotemporal areas in both conditions. Under the LSF condition (a), the latencies for EKj and LKj were
significantly longer than for KaW. In the HSF condition (b), the N170 latency for LKj was significantly longer compared to EKj.
Fig. 7. Grand average waveforms of the N400 and scalp topography in response to each stimulus in the LSF (a) and HSF (b) conditions (Cz). In terms of scalp topography, the N400 was distributed over fronto-central areas in both conditions. There was no apparent difference in N400 among the stimuli in both SF conditions (a, b). Note that the N400 in response to ScW was poorly defined in both SF conditions.
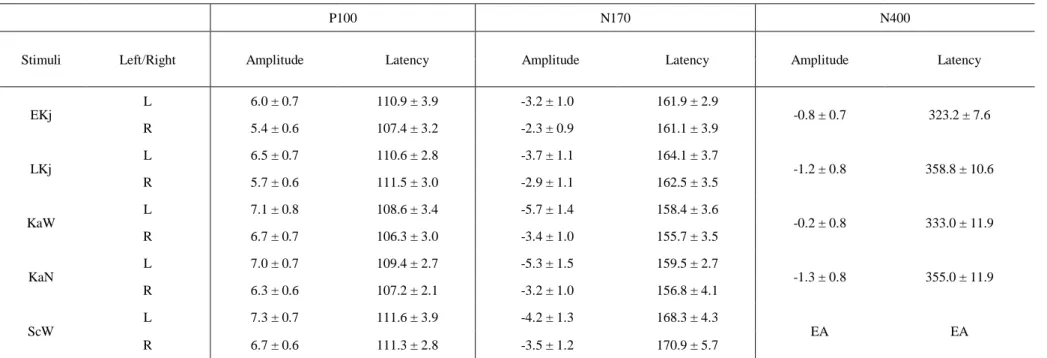
Table 1. Mean peak amplitudes (µV) and latencies (ms) of the P100, N170 and N400 components in the BSF condition (Experiment 1)
P100 N170 N400
Stimuli Left/Right Amplitude Latency Amplitude Latency Amplitude Latency
EKj
L 6.0 ± 0.7 110.9 ± 3.9 -3.2 ± 1.0 161.9 ± 2.9
-0.8 ± 0.7 323.2 ± 7.6
R 5.4 ± 0.6 107.4 ± 3.2 -2.3 ± 0.9 161.1 ± 3.9
LKj
L 6.5 ± 0.7 110.6 ± 2.8 -3.7 ± 1.1 164.1 ± 3.7
-1.2 ± 0.8 358.8 ± 10.6
R 5.7 ± 0.6 111.5 ± 3.0 -2.9 ± 1.1 162.5 ± 3.5
KaW
L 7.1 ± 0.8 108.6 ± 3.4 -5.7 ± 1.4 158.4 ± 3.6
-0.2 ± 0.8 333.0 ± 11.9
R 6.7 ± 0.7 106.3 ± 3.0 -3.4 ± 1.0 155.7 ± 3.5
KaN
L 7.0 ± 0.7 109.4 ± 2.7 -5.3 ± 1.5 159.5 ± 2.7
-1.3 ± 0.8 355.0 ± 11.9
R 6.3 ± 0.6 107.2 ± 2.1 -3.2 ± 1.0 156.8 ± 4.1
ScW
L 7.3 ± 0.7 111.6 ± 3.9 -4.2 ± 1.3 168.3 ± 4.3
EA EA
R 6.7 ± 0.6 111.3 ± 2.8 -3.5 ± 1.2 170.9 ± 5.7
Abbreviations in this and subsequent tables: EKj, early learned Kanji; LKj, late learned Kanji; KaW, Kana word; KaN, Kana non-word; ScW, scrambled word.
Data are expressed as mean ± SEM. EA; excluded for analysis
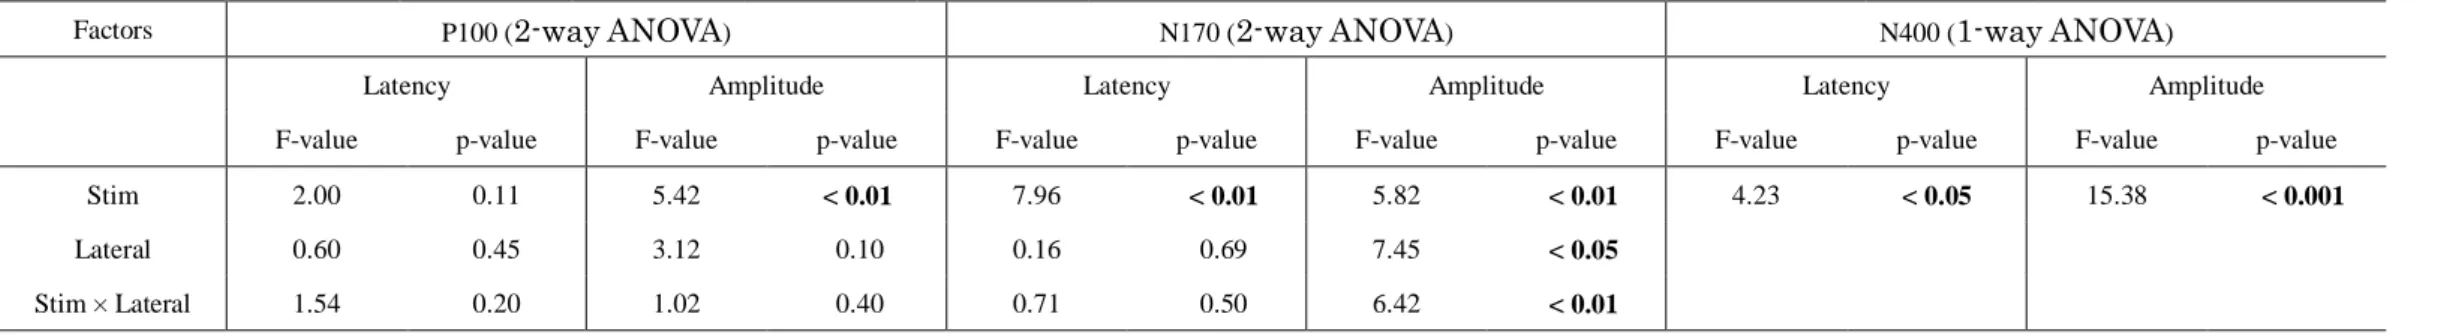
Table 2. ANOVA results in Experiment 1
Factors P100 (2-way ANOVA) N170 (2-way ANOVA) N400 (1-way ANOVA)
Latency Amplitude Latency Amplitude Latency Amplitude
F-value p-value F-value p-value F-value p-value F-value p-value F-value p-value F-value p-value
Stim 2.00 0.11 5.42 < 0.01 7.96 < 0.01 5.82 < 0.01 4.23 < 0.05 15.38 < 0.001
Lateral 0.60 0.45 3.12 0.10 0.16 0.69 7.45 < 0.05
Stim × Lateral 1.54 0.20 1.02 0.40 0.71 0.50 6.42 < 0.01
Abbreviations: Freq, frequency; Stim, stimulus; Lateral, laterality
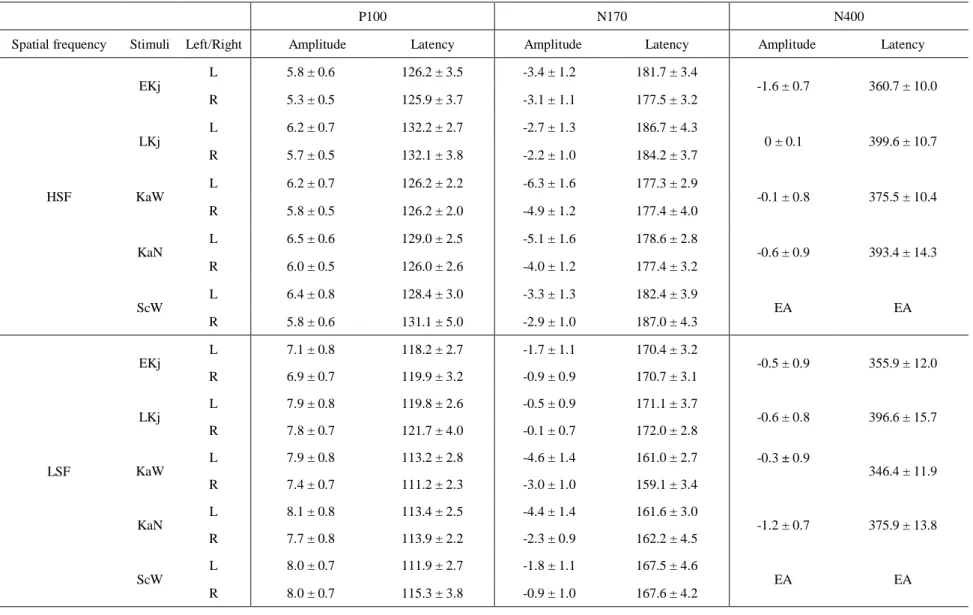
Table 3. Mean peak amplitudes (µV) and latencies (ms) of the P100, N170 and N400 components in the HSF and LSF conditions (Experiment 2)
P100 N170 N400
Spatial frequency Stimuli Left/Right Amplitude Latency Amplitude Latency Amplitude Latency
HSF
EKj
L 5.8 ± 0.6 126.2 ± 3.5 -3.4 ± 1.2 181.7 ± 3.4
-1.6 ± 0.7 360.7 ± 10.0
R 5.3 ± 0.5 125.9 ± 3.7 -3.1 ± 1.1 177.5 ± 3.2
LKj
L 6.2 ± 0.7 132.2 ± 2.7 -2.7 ± 1.3 186.7 ± 4.3
0 ± 0.1 399.6 ± 10.7
R 5.7 ± 0.5 132.1 ± 3.8 -2.2 ± 1.0 184.2 ± 3.7
KaW
L 6.2 ± 0.7 126.2 ± 2.2 -6.3 ± 1.6 177.3 ± 2.9
-0.1 ± 0.8 375.5 ± 10.4
R 5.8 ± 0.5 126.2 ± 2.0 -4.9 ± 1.2 177.4 ± 4.0
KaN
L 6.5 ± 0.6 129.0 ± 2.5 -5.1 ± 1.6 178.6 ± 2.8
-0.6 ± 0.9 393.4 ± 14.3
R 6.0 ± 0.5 126.0 ± 2.6 -4.0 ± 1.2 177.4 ± 3.2
ScW
L 6.4 ± 0.8 128.4 ± 3.0 -3.3 ± 1.3 182.4 ± 3.9
EA EA
R 5.8 ± 0.6 131.1 ± 5.0 -2.9 ± 1.0 187.0 ± 4.3
LSF
EKj
L 7.1 ± 0.8 118.2 ± 2.7 -1.7 ± 1.1 170.4 ± 3.2
-0.5 ± 0.9 355.9 ± 12.0
R 6.9 ± 0.7 119.9 ± 3.2 -0.9 ± 0.9 170.7 ± 3.1
LKj
L 7.9 ± 0.8 119.8 ± 2.6 -0.5 ± 0.9 171.1 ± 3.7
-0.6 ± 0.8 396.6 ± 15.7
R 7.8 ± 0.7 121.7 ± 4.0 -0.1 ± 0.7 172.0 ± 2.8
KaW
L 7.9 ± 0.8 113.2 ± 2.8 -4.6 ± 1.4 161.0 ± 2.7 -0.3 ± 0.9
346.4 ± 11.9
R 7.4 ± 0.7 111.2 ± 2.3 -3.0 ± 1.0 159.1 ± 3.4
KaN
L 8.1 ± 0.8 113.4 ± 2.5 -4.4 ± 1.4 161.6 ± 3.0
-1.2 ± 0.7 375.9 ± 13.8
R 7.7 ± 0.8 113.9 ± 2.2 -2.3 ± 0.9 162.2 ± 4.5
ScW
L 8.0 ± 0.7 111.9 ± 2.7 -1.8 ± 1.1 167.5 ± 4.6
EA EA
R 8.0 ± 0.7 115.3 ± 3.8 -0.9 ± 1.0 167.6 ± 4.2
Data are expressed as mean ± SEM. EA; excluded for analysis
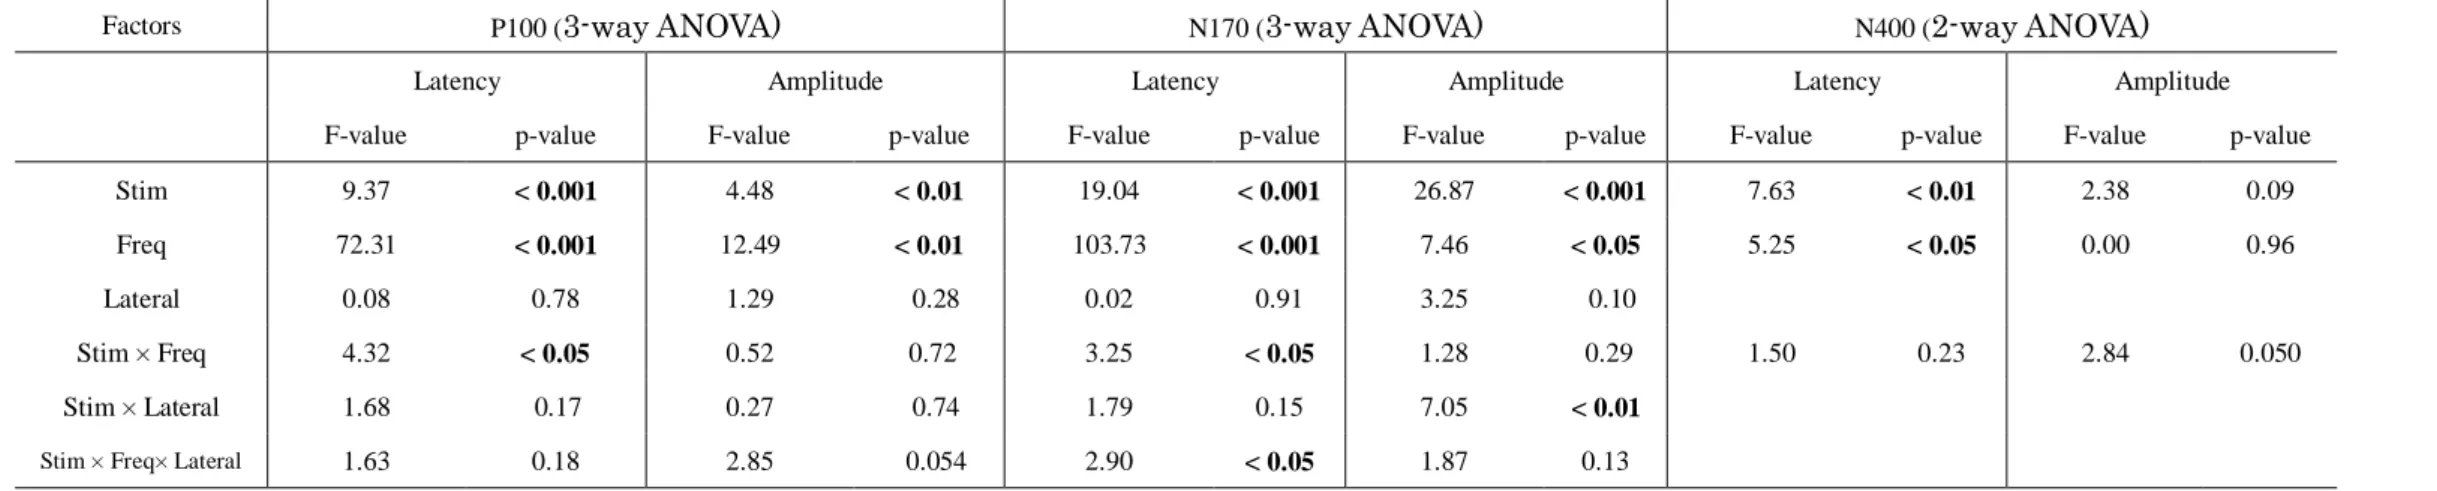
Table 4. ANOVA results in Experiment 2
Factors P100 (3-way ANOVA) N170 (3-way ANOVA) N400 (2-way ANOVA)
Latency Amplitude Latency Amplitude Latency Amplitude
F-value p-value F-value p-value F-value p-value F-value p-value F-value p-value F-value p-value
Stim 9.37 < 0.001 4.48 < 0.01 19.04 < 0.001 26.87 < 0.001 7.63 < 0.01 2.38 0.09
Freq 72.31 < 0.001 12.49 < 0.01 103.73 < 0.001 7.46 < 0.05 5.25 < 0.05 0.00 0.96
Lateral 0.08 0.78 1.29 0.28 0.02 0.91 3.25 0.10
Stim × Freq 4.32 < 0.05 0.52 0.72 3.25 < 0.05 1.28 0.29 1.50 0.23 2.84 0.050
Stim × Lateral Stim × Freq× Lateral
1.68 1.63
0.17 0.18
0.27 2.85
0.74 0.054
1.79 2.90
0.15
< 0.05
7.05 1.87
< 0.01 0.13 Abbreviations: Freq, frequency; Stim, stimulus; Lateral, laterality
Appendix 1. Examples of the Kanji visual word stimuli used in this study
EKj LKj
Samples Stroke
count
Pronunciation Meaning Samples Stroke
count
Pronunciation Meaning Samples Stroke
count
Pronunciation Meaning Samples Stroke
count
Pronunciation Meaning
右手 9 mi-gi-te right hand 弓矢 8 yu-mi-ya bow and arrow 簡素 28 ka-n-so simple 否決 14 hi-ke-tu rejection
二本 7 ni-ho-n two 時間 22 ji-ka-n time 秘密 21 hi-mi-tsu secret 賛否 22 sa-n-pi yes or no
目玉 10 me-da-ma eyeball 広場 17 hi-ro-ba square 苦痛 20 ku-yu-u pain 警備 31 ke-i-bi security
出口 8 de-gu-chi exit 親子 19 o-ya-ko parent and child 権利 22 ke-n-ri right 資源 26 shi-ge-n resource
子犬 7 ko-i-nu puppy 午前 13 go-ze-n morning 頭脳 27 zu-no-u brain 禁句 18 ki-n-ku taboo word
天気 10 te-n-ki weather 電気 19 de-n-ki electricity 批判 14 hi-ha-n criticism 移転 22 i-te-n move
夕日 7 yu-u-hi evening sunlight 朝日 16 a-sa-hi rising sun 砂糖 25 sa-to-u sugar 豊富 25 ho-u-hu rich
小石 8 ko-i-shi stone 自分 10 ji-bu-n oneself 延期 20 e-n-ki postponement 予防 11 yo-bo-u prevention
花火 11 ha-na-bi firework 毛糸 10 ke-i-to wool 幕府 21 ba-ku-hu shogunate 破損 23 ha-so-n breakage
科学 17 ka-ga-ku science 野原 21 no-ha-ra field 姿勢 22 shi-se-i position 講師 27 ko-u-shi lecturer
子牛 7 ko-u-shi calf 小麦 10 ko-mu-gi wheat 区域 15 ku-i-ki zone 転機 27 te-n-ki turnoing point
元気 10 ge-n-ki vigor 火曜 22 ka-yo-u Tuesday 保存 15 ho-zo-n preservation 視覚 23 shi-ka-ku vision
国語 22 ko-ku-go national language 電話 26 de-n-wa phone 宝庫 18 ho-u-ko treasury 銅貨 25 do-u-ka copper
谷間 19 ta-ni-ma valley 昼間 21 hi-ru-ma daytime 推理 22 su-i-ri reasoning 不在 10 hu-za-i absence
四角 12 shi-ka-ku square 雨戸 12 a-ma-do shutter 俳句 15 ha-i-ku haiku 看護 29 ka-n-go nursing
Abbreviations: EKj, early-learned Kanji; LKj, late-learned Kanji
Appendix 2. Examples of the Kana visual word stimuli used in this study
KaW KaN
Samples
Stroke count
Pronunciation Meaning Samples
Stroke count
Pronunciation Meaning Samples Stroke
count
Pronunciation Samples Stroke
count
Pronunciation
みぎて 11 mi-gi-te right hand かんそ 8 ka-n-so simple ぎてみ 11 gi-te-mi んそか 8 n-so-ka
にほん* 10 ni-ho-n (two) ひみつ 6 hi-mi-tsu secret にんほ 10 ni-n-ho つひみ 6 tsu-hi-mi
めだま 12 me-da-ma eyeball けんり 7 ke-n-ri right だめま 12 da-me-ma んりけ 7 n-ri-ke
でぐち 10 de-gu-chi exit ずのう 8 zu-no-u brain ちぐで 10 chi-gu-de のずう 8 no-zu-u
こいぬ 8 ko-i-nu puppy ひはん 8 hi-ha-n criticism ぬこい 8 nu-ko-i はひん 8 ha-hi-n
ゆうひ 7 yu-u-hi evening sunlight さとう* 7 sa-to-u (sugar) ゆひう 7 yu-hi-u うとさ 7 u-to-sa
こいし 5 ko-i-shi stone えんき* 9 e-n-ki (postponement) いこし 5 i-ko-shi きんえ 9 ki-n-e
はなび 13 ha-na-bi firework ばくふ 11 ba-ku-hu shogunate なびは 13 na-bi-ha くふば 11 ku-hu-ba
かがく* 9 ka-ga-ku (science) しせい* 6 shi-se-i (position) くかが 9 ku-ka-ga せしい 6 se-shi-i
げんき 11 ge-n-ki vigor ほぞん 12 ho-zo-n preservation んきげ 11 n-ki-ge ぞんほ 12 zo-n-ho
こくご 7 ko-ku-go national language すいり* 7 su-i-ri (reasoning) くごこ 7 ku-go-ko いすり 7 i-su-ri
たにま 11 ta-ni-ma valley はいく 7 ha-i-ku haiku まにた 11 ma-ni-ta くいは 7 ku-i-ha
しかく* 5 shi-ka-ku (square) ひけつ* 6 hi-ke-tu (rejection) くしか 5 ku-shi-ka つけひ 6 tsu-ke-hi
ゆみや 9 yu-mi-ya bow and arrow けいび* 9 ke-i-bi (security) やゆみ 9 ua-yu-mi びいけ 9 bi-i-ke
じかん 8 ji-ka-n time きんく 7 ki-n-ku taboo word んかじ 8 n-ka-ji くきん 7 ku-ki-n
* Kana words with other homonyms.
Abbreviations: KaW, kana word; KaN, kana non-word
Appendix 3. Mean reaction times for filtered word stimuli
SF HSF LSF
stimuli EKj LKj KaW KaN EKj LKj KaW KaN
time (ms) 363.5 ± 40.4 333.6 ± 44.9 366.1± 46.9 342.4 ± 35.9 343.1± 41.0 411.4± 57.4 320.8 ± 39.6 379.3 ± 41.8 Values are expressed as mean ± SEM.