Ⅰ. Current Status of AI/Fintech
It is no exaggeration to say that there will be no days when you do not see AI and Fin- tech articles in the economic reports in newspapers. This is exactly the AI/Fintech boom.
However, this boom seems not a temporary one this time. This section provides an overview of the characteristics and current status of the AI/Fintech boom as an introduction to this pa- per.
I-1. The Rise of Fintech and the Third AI Boom
According to the Bank of Japan, Fintech is a coined word that combines finance and technology and refers to various innovative movements that combine financial services and information technology. AI can be considered a part of Fintech, but if it is limited to AI alone, the current boom is not the first time. According to Nomura Research Institute (2016), there have been two booms in the past, this time now is the third boom. The second boom in
AI/Fintech and Asset Management Businesses KATO Yasuyuki
Director of Research Institute, Money Design Co., Ltd. Research Professor of Tokyo Metropolitan University
Summary
In asset management business, AI and Fintech are now widely used. This article intro- duces a wide range of examples where AI and Fintech are applied to the development of as- set management methods. One of the cores of their applied technology is text mining that converts text information into numerical data, which has evolved through deep learning. Big data has dramatically expanded the amount of input data to asset management models, and advanced prediction models have been developed by analyzing these data using deep learn- ing. On the other hand, AI has brought about the harmful effect of making the model a black box. A lot of attempts are also being made to contribute to the investment theory by estimat- ing risk factors with AI optimization technology and big data. Fintech, on the other hand, provides with automated wealth management, which has contributed to the expansion of as- set management business for small-sized and inexperienced investors with robot advisors. In addition, the application of big data is progressing even in ESG investment, which has re- cently attracted a lot of attention.
Keywords: Fintech, asset management, big data, deep learning, text mining, LSTM, ro- bot advisors, wealth management, ESG
JEL Classification : C1, C4, C6, C8, G1
the 1980s was the first expectation of AI as an ability to approach human intelligence be- yond normal computer use and specialized knowledge base and expert system AI was sought. Although it was devoted to accumulating specialized knowledge bases represented by medical diagnosis, the scope of application was extremely narrow and could not with- stand general practical use. One of the characteristics of the past AI boom is that its applica- tion in the financial sector has received little attention. Although AI technology at that time may have been unfamiliar with finance, the biggest reason is that financial IT was not suffi- ciently advanced.
The boom this time is the AI/Fintech boom. With the rise of Fintech companies, IT, es- pecially AI, is being applied to financial practice, and Fintech and AI are attracting attention at the same time. This time is particularly different from the past booms in terms of the ex- pansion of the Internet. It can be said that the problem of the second AI boom was an over- whelming shortage of digitized data. At that time, researchers and developers searched for the necessary data from a huge amount of paper media and input them into the computer.
The most important technical change that has occurred since the second AI boom is the In- ternet. A vast amount of information has been digitized with the expansion of the Internet.
This dramatically increased the amount of data that can be used in computers. Data is most needed for AI development, and the impact of the Internet is immeasurable. This is especial- ly true for finance centered on empirical analysis. In addition, the Internet has spawned Fin- tech companies. Emerging Fintech companies with high IT skills are actively using AI.
Feedback from Fintech users to AI developers is actively taking place, leading AI develop- ment in the direction of high practicality. Existing financial institutions are also forced to in- troduce AI as part of rationalization due to the shortage of manpower. In addition to the above factors, the elemental technologies of AI represented by text mining and deep learn- ing have evolved. Furthermore, hardware advances such as calculation speed and storage capacity are also remarkable.
I-2. Defining AI/Fintech
By the way, the definition or range of what you call AI/Fintech varies. During the dawn of computers, computers themselves would have been considered AI. There is no one who thinks that they are using AI by using Excel on a personal computer now. Even with the same computer application technology, the hurdles for AI are going higher. For reference, the following text is included at the beginning of the intent of establishment of the Japan Society for Artificial Intelligence. “The human dream of wanting a machine that replaces the work of the brain was realized by an electronic computer in terms of performing complex calculations on large amounts of numerical data at high speed. In this sense, current infor- mation processing technology is far beyond human ability, but on the other hand, the essen- tial aspect of thinking is quite powerless. Artificial intelligence is aimed at accurately per- forming advanced inference on large amounts of knowledge data.” In other words, it is necessary for AI to perform advanced reasoning rather than simple information processing.
However, the meaning of the word altitude is relative and will change over time. In the third boom, emphasis is placed on the use of advanced machine learning systems such as deep learning. As for data, text information, image information, so-called non-traditional data (or alternative data) such as data supplemented by IOT are widely covered. With the introduc- tion of alternative data, the amount of data has become enormous and has come to be called big data. Big data will become increasingly important in the use of AI that requires huge amounts of data. This is especially important for finance with higher dependence on empiri- cal data, and further development of new data will progress in the future. In this paper, we assume the case of advanced IT efforts in asset management without clearly defining AI and Fintech, while assuming the use of deep learning, which is advanced machine learning. Note that short-term trading strategies such as algorithmic trading are not discussed in this paper.
II. Deep Learning and Asset Management Model Development
Here we consider how AI is used in the development of asset management models. In particular, we will focus on the elemental technologies of AI that are rapidly increasing in asset management as AI advances. In other words, there are two elemental technologies, text mining and deep learning. As specific application destinations, we discuss with numerical data conversion of text information by text mining, dynamic asset allocation model, and management style evaluation. We also point out the issues of black boxing by introducing AI.
II-1. Text Information and Utilization of Text Mining
In conventional asset management models, investment decisions are made using macro- economic data such as GDP and interest rates, or microeconomic data such as stock prices and corporate financial data. These digitized data are also called “structured” data because the definition of item names and data is clarified and well-organized time-series data is pre- pared. Structured data is easy to obtain and can be easily compared with other assets with past values. In addition, it has been widely used in asset management because it can be easi- ly incorporated into computers. On the other hand, the demerits of these structured data are that the types of data are limited, information is often aggregated during the data creation process and important information may be missing. In particular, macroeconomic data and corporate financial data take a long time since the occurrence of the event to the release of the data. On the other hand, a large amount of text information such as news, publicly avail- able materials, press conferences of government and business executives, or messages on SNS can be used in real time. It also contains a lot of information missing from the numeri- cal data. However, it can be said that this enormous amount of text information was rarely used so far due to the huge amount of data, difficulty in handling, or difficulty in extracting necessary information. Since these data are not structured, they are called unstructured data.
Recently, however, most of this text information has been digitized and can be read digitally
and used word by word. In addition, text information can be digitized accurately and with- out missing information as text mining technology advances. Text information that is broad- er and more real-time is digitized and can be used for asset management along with existing numerical data.
As a numerical method, words are extracted from text information by morphological el- ement analysis (a method in which text information is decomposed into minimum units based on a dictionary) and scored according to its characteristics (e.g. good or bad). Based on this score, it is digitized and market trends are predicted. Tetlock (2007), Heston (2014), Ishijima et al. (2013) evaluate the sentiment of news articles by classifying the word appear- ance frequency and its good/bad with a dictionary and discuss the correlation with stock prices. In addition, the text is digitized by grouping words based on the co-occurrence fre- quency indicating the number of times the extracted words are used simultaneously. As a grouping method, for example, digitized co-occurrence frequency data is factorized by prin- cipal component analysis. These factors can be used as time series variables. In Izumi et al.
(2010, 2011), morphological elements were analyzed for financial economic monthly reports published by the Bank of Japan, and these were classified into factors based on co-occur- rence relationships. If this factor is used as a variable in an existing quantitative model, a model incorporating text information can be developed. In a study by Chen & Son (2017) conducted at the Kato laboratory at Kyoto University, the text information of the Financial and Economic Statistics Monthly report published by BOJ and the BOJ governor press con- ference minutes was converted into numerical variables and incorporated into the existing time series model in order to predict volatility. Table 1 shows the top ranks of co-occurrence relationships of words extracted every year in the Financial and Economic Statistics Month- ly report in order of frequency. The first and second columns are co-occurring word combi- Table 1. Co-occurrence Relationships of Words Extracted in the Financial and Economic Statistics Monthly report
Source: Chen & Son (2017), “Modelling term structure with text information” Kyoto University
nations, and the third column is a concatenation of two words. The fourth and subsequent columns show the number of co-occurrences in each year. However, the words are limited to those that apply to economic terms in the Nikkei Thesaurus, and cases where 30 or more times are observed are extracted. The period is from 2003 to 2013. As a result, 607 sets were extracted from the report and 987 sets were selected from the press conference minutes.
These co-occurrence words are connected for the entire period, and a matrix is created by combining the appearance patterns of the co-occurrence words with a single variable. Prin- cipal component analysis is performed on this matrix. In the report, there is the top 12 prin- cipal components, and in the minutes, there is the top 38 principal components, with a cu- mulative contribution rate of 60%. If each principal component score is calculated and considered as time-series data of new factors, it can be expected that these factors will be added to existing time-series models as new exogenous variables to improve the accuracy of the model.
As mentioned above, it is possible to analyze digitized text information and apply it to asset management. However, there are problems with these methods. The problem is that the method is a word-based approach and the meaning of the word varies greatly depending on the context in which it is used. The words of “Yen appreciation” is bad news for export- ers, but good for importers. In other words, it is necessary to judge not only the word but also its context. This is made possible by the use of machine learning such as deep learning.
II-2. Upgrading Text Mining by Machine Learning
In order to extract information such as sentiments from the context of a text, it is neces- sary to understand not only words but also text as a whole. According to Chen et al. (2015), there are three methods for extracting information from text. They are ① information ex- traction using existing sentence structure, ② unsupervised machine learning, and ③ super- vised machine learning. ① is a simple and easy-to-understand method, but it depends on the structure prepared beforehand and can only be applied to limited text. In ②, machine learns from the statistical characteristics of the text, such as the frequency of word appearance and the level of certainty, and determine its importance. Teacher data is not required in ②. ③ prepares existing text as teacher data and machine learns from the teacher data and classifies it. Among the above, ② and ③, which have high applicability using machine learning, are practical. But ② does not require teacher data for ease of development and ③ that uses teacher data is considered high for accuracy. Although it is word-based, Chen & Son (2017) introduced in the previous section does not use teacher data and can be said to fall under ②.
Recently a lot of text information has been digitized, making it easy to obtain teacher data. As a machine learning system, a method of extracting information such as sentiment from text information using deep learning has attracted attention. For research that uses deep learning to extract sentiment from text information and analyze the relationship with stock prices, you can see Chen (2013), Heston (2016), Yamamoto & Matsuo (2016), Goto &
Takahashi (2016). The feature value of a sentence can be extracted by using deep learning,
but deep learning is suitable for some but not suitable for the other. It is well known that Convolution Neural Network (CNN) is most commonly used to recognize image informa- tion that is often used for machine learning. In CNN, a convolution layer is introduced into the neural network to enhance the image recognition function. However, text information is not necessarily suitable to CNN because it is not two-dimensional like an image. Instead, a Recurrent Neural Network (RNN) with Long Short-Term Memory (LSTM) units is often used. LSTM-RNN is a technique for analyzing continuous sequences such as time series data with a neural network, and can be applied to sequences with different lengths, making it suitable for natural language analysis (Yamamoto & Matsuo 2016). Since the intermediate layer of the previous layer is used as a part of the input vector of the next layer, the past se- quence can be stored. Sentence data is time-series data with variable-length, and a network structure in which intermediate layer values are input again to the hidden layer is convenient for analysis of text with variable-length. Yamamoto & Matsuo (2016) uses the supervised LSTM-RNN to build their own economic indicators from the economic watcher survey pub- lished by the Cabinet Office of Japan. The economic watcher survey sensitively reflects trends in typical economic activity items such as household trends, corporate trends, and employment. The survey selects the survey target (business watcher) from the industries that can observe the phenomenon. And they asked them about the economic judgment (numeri- cal information of 5 levels from good to bad) and the reason (text). This combination of economic judgment and reason can be used as teacher data. Let these learning data be learned by deep learning. Using the learned system, text information published on the Inter- net is analyzed and converted to economic judgment (numerical data). In this study, the sen- timent index is created by analyzing text information such as the monthly economic report published by the Cabinet Office and the Financial and Economic Statistics Monthly report published by the Bank of Japan. This index has been reported to be highly correlated with the BOJ’s Tankan and the economic watcher index, indicating its effectiveness. Based on this result, it is possible to construct variables with wider coverage by using text information compared with existing macroeconomic statistical data which is based on sampling. Further- more, for example, it is possible to analyze the text information on the net for a specific sec- tor and create a sentiment index specialized for that sector. These indexes suggest that nu- merical indexes limited to a certain purpose and industry can be created freely, that is, with or without public data. It is expected that the diversification of variables and the freedom of model development will be greatly increased.
As described above, text information can be converted into numerical variables with high accuracy for various purposes, and its use in practice has begun. The Ministry of Econ- omy, Trade and Industry (METI) has published economic indicators (SNS×AI business sen- timent index (Watcher AI), etc.) on a trial basis using the same technology.
II-3. Development of Asset Management Models by Machine Learning
In general, developing an asset management model is to find out the relationship be-
tween explained variables and explanatory variables. An explained variable is a variable to be predicted, and an explanatory variable is a variable used for prediction. In many cases, this relationship is assumed to be linear, and linear regression analysis has been used as its primary analytical method. However, regression analysis has severe conditions such as a normal distribution of variables. In addition, the linear model has a simple structure that is linear, and is limited to the extent that developers can imagine. However, many of the actual data have non-normality, and the model structure is more complex and often non-linear.
Therefore, advanced machine learning systems such as neural networks are used to model the nonlinearity. Multi-layered deep learning is used to find more complex relationships.
In the previous section, an overview was given of how to convert a large amount of text information into numerical variables by text mining. In the following, we examine how to incorporate these various numerical variables into the asset management models using a ma- chine learning system. Here, as an example, we will outline the method through the research of Tsuji (2017) on the development of a volatility prediction model from the research results of the Kato laboratory at Kyoto University. In volatility prediction, it is more important than the specific value itself whether the level is higher or lower than before. Therefore, here the volatility prediction target is not the volatility level itself but the regime of volatility level.
Therefore, the volatility level is classified into four regimes using the hidden Markov model (Markov process with a state that is not directly observed) from the past return time series.
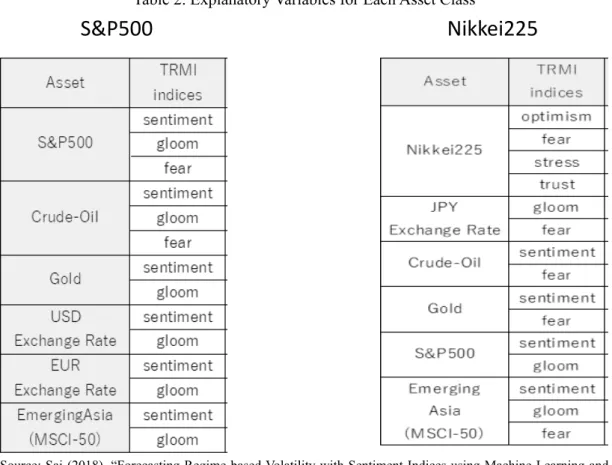
The targets are the S & P 500 of the US stock index, and the Nikkei Stock Average (the Nik- kei Average) of the Japanese stock index. In order to compare machine learning algorithms, predictions are made using multiple algorithms. As the explanatory variable, TRMI (Thom- son Reuters Market Psych Indices), a market sentiment index provided by Thomson Reu- ters, is used. In other words, the model predicts the volatility regime using TRMI as an ex- planatory variable. TRMI is a big data sentiment index developed jointly by Thomson Reuter and MarketPhych Data. Over 2 million pieces of text information collected from ma- jor news sources on the Internet to social media is analyzed and indexed by text mining ev- ery day. TRMI has indexes corresponding to each asset type (S&P 500, Nikkei Average, oil price, yen/dollar rate, etc.), and there is a wide variety of types of indexes for each asset, such as Optimism Index, Gloom Index, and Fear Index. They are numerical data developed using text mining and AI technology. As shown in Table 2, the S&P 500 and Nikkei 225 volatility forecasts used multiple TRMIs as explanatory variables, including those for relat- ed assets. These input variables are used for prediction by learning the relationship with vol- atility. We use the following commonly used machine learning algorithms.
・Gradient Boosting
・Neural network
・7 layers of convolutional neural network (CNN; Convolutional Neural Network)
・16 layers of convolutional neural network
Gradient boosting is a type of ensemble learning (a method for generating a single learn- ing model by fusing multiple models) that combines multiple weak learners (classifiers that
have low correlation with true classification). This is a method of building a weak learner.
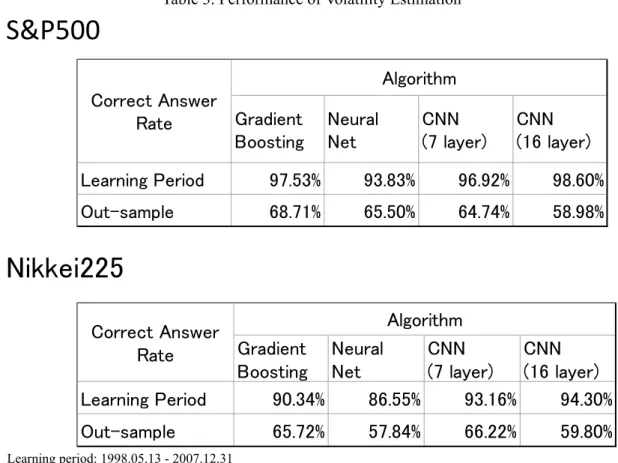
Build a weak learner for each step to minimize the loss function. Increase the weight for ex- amples that were mistakenly classified in the previous step, and avoid the misclassification in the next step so that they can be identified well. It is the most basic and widely used sys- tem. A neural network uses a structure consisting of an intermediate layer (hidden layer) in addition to an input layer and an output layer. A convolutional neural network is a neural network often used for image recognition. The feature or pattern is extracted from the im- age, and the probability of the output layer is calculated by an activation function (a function that converts a plurality of input values). In the example of this report, the image processing which the convolutional neural network is good at is not performed. However, the time se- ries data of the sentiment index as input data can be recognized like an image. Therefore, it is considered that the feature of a large data set over a longer period can be extracted. Here we use two convolutional neural networks with different numbers of hidden layers. Model learning and volatility prediction are based on daily TRMI data, with 21 days as one month and the previous month’s data as one month ahead. The learning period is 1998.05.13- 2007.12.31, and the out-sample simulation period is 2008.01.04-2017.10.31. The results for
Table 2. Explanatory Variables for Each Asset Class
Source: Sai (2018), “Forecasting Regime-based Volatility with Sentiment Indices using Machine Learning and its Application to Portfolio Strategies” Kyoto University
each of the four algorithms are shown in Table 3. In Table 3, both the correct answer rate during the learning period and the correct answer rate of the out sample are shown for each algorithm. The correct answer rate during the learning period was the highest for CNN with many layers. This would be as expected. This means that the most multilayered machine learning system can be adapted to complex structures. On the other hand, it is not necessari- ly high in an out-sample. In other words, the past correct answer rate has increased due to the multi-layer deep learning, but it does not promise future prediction accuracy. There is a possibility of overfitting or overlearning . They mean being too fit for the data. It means that the model deviates from the true structure because it fits too much in past data including noise. If it deviates from the true structure, the predictive power will decrease. A high de- gree of fitness at the learning stage does not necessarily indicate high predictive power. It is an important viewpoint in designing machine learning systems to consider the number of layers for the number of data. When applying a machine learning system, it is necessary to carefully determine the relationship between the fitness at the learning stage and the predic- tive power at the out-sample assuming the model structure.
Table 3. Performance of Volatility Estimation
Learning period: 1998.05.13 - 2007.12.31 Out-sample simulation: 2008.01.04 - 2017.10.31
Source: Sai (2018), “Forecasting Regime-based Volatility with Sentiment Indices using Machine Learning and its Application to Portfolio Strategies” Kyoto University
Next, we will simulate the TAA (Tactical Asset Allocation) strategy using this volatility prediction model. The TAA strategy is a strategy for actively changing the weights of multi- ple target asset classes. The aim is to pursue higher returns compared to fixed strategies such as buy-and-hold strategies (strategies that are initially allocated and left as is) and equal weight strategies. Here, the weight is determined based on the volatility of each asset class predicted by machine learning. As target asset classes, we utilize ETFs of four major assets:
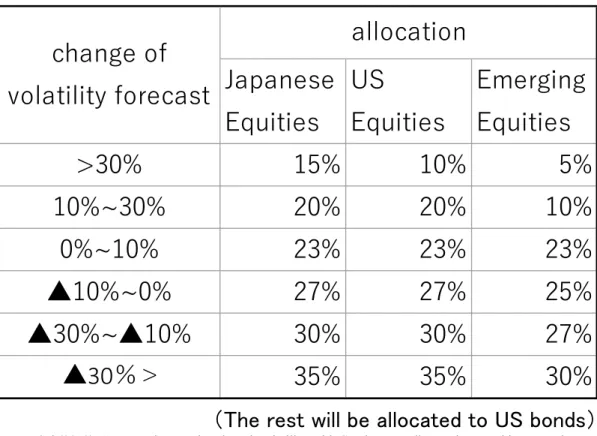
US equities (State Street S&P 500 ETF), Japanese equities (Nomura Nikkei 225 ETF), emerging market equities (Vanguard FTSE-Emerging Market ETF), and US bonds (Black- Rock Core II US Aggregate ETF). Here, the following strategy is verified. In other words, the strategy is to reduce the allocation to stock assets that are predicted to increase in vola- tility and increase the allocation to stock assets that are predicted to decrease in volatility.
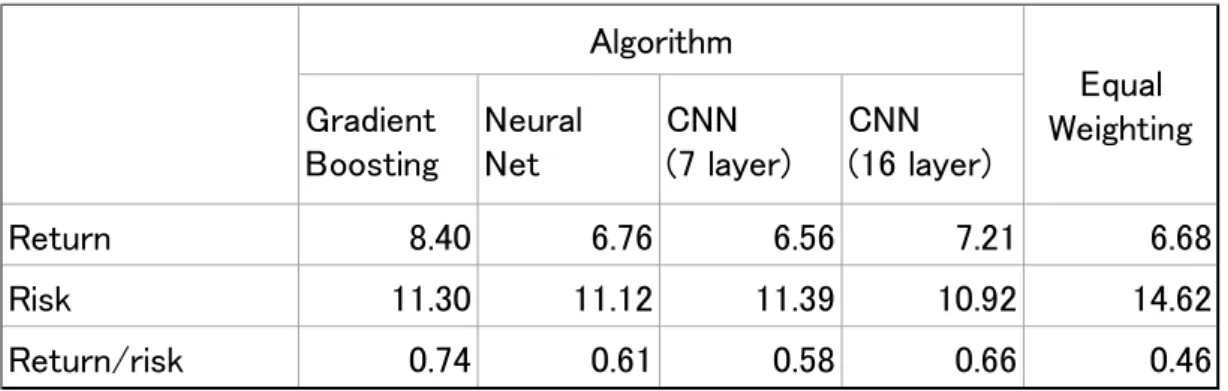
The remaining weight is allocated to US bonds. Table 4 shows the rules for increasing or decreasing the allocation ratio to stock assets based on volatility forecasts. However, the volatility forecast of US stocks is used for that of emerging markets. There are four machine learning algorithms as shown above. As a benchmark, we use a buy-and-hold strategy that is allocated to the four assets with this weight. The results are shown in Table 5. When evalu- ated by return and return/risk, the grade boosting performance was good in this example, but
Table 4. TAA strategy based on volatility forecast
Sourse: Sai,(2018), “Forecasting Regime-based Volatility with Sentiment Indices using Machine Learning and its Application to Portfolio Strategies” Kyoto University
the above is only a simple model development example, and it goes without saying that more detailed modeling is necessary in practice. In the above, we have outlined an example of using AI as an asset management model, taking volatility prediction as an example. In ad- dition to volatility prediction, the scope of application to asset management models is wide, and is expected to expand further in the future. The scope of AI applications will expand while absorbing traditional quants operations. In addition, the asset management model tak- en up here is based on volatility prediction, and the portfolio was constructed by a simple method of allocating to a predetermined weight to each asset. However, in order to build an excellent portfolio, it is necessary to optimize the weights for each asset class based on the estimated parameters. In the optimization process, it is necessary to estimate the risk struc- ture and introduce some kind of algorithm. In portfolio optimization, the average variance method has traditionally been used, but various methods have been proposed due to the di- versification of asset management and the advancement of AI. This will be discussed in the wealth management section.
II-4. AI and Investment Management Style Evaluation
One of the important asset management processes for pension funds that outsource their management to external money managers is the management style evaluation of the money managers. Until now, the management style evaluation has centered on the traditional three-factor model (Fama & French (1993)) or a style index based on it. The main focus of this method was to take the portfolio and to evaluate its return time-series characteristics and fundamental cross-sectional characteristics by comparing them with 3 factor character- istics. However, in recent years, the re-evaluation of the factor itself has been discussed, such as a decrease in value factor return and increased attention to new factors such as low
Source: Sai (2018), “Forecasting Regime-based Volatility with Sentiment Indices using Machine Learning and its Application to Portfolio Strategies” Kyoto University
Table 5. Result of TAA Strategy
volatility or quality factors. On the other hand, research on new management style evalua- tion framework is also progressing. Here, we introduce how to use deep learning as a new approach to style evaluation. A system that analyzes and evaluates the management organi- zation’s style using deep learning with daily transaction data of the management organiza- tion as input variables has been prototyped and a report has been published (see Sony Com- puter Science Laboratories (2018) (a commissioned study from a GPIF)). Based on this report, an overview is given below. Large institutional investors such as pension funds em- ploy many active managers. These asset managers have a variety of asset styles and are dis- tributed in style. However, even if they are said to be the same style, the performance char- acteristics may differ depending on the asset manager. Also, the style may change over time and it is necessary to keep a close watch. On the other hand, funds using the latest AI tech- nology represented by deep learning and big data are beginning to appear. There are also is- sues related to style evaluation methods. For these reasons, more sophisticated style evalua- tion methods are required. In general, a fund has a type of asset management that is categorized based on the basic philosophy, strategy, and method of investment. Each fund will be characterized by its style, but it is the daily trading behavior that shows the differ- ence. Sony Computer Science Laboratories has developed a system that evaluates the fund’s management style based on transaction data (Style Detector Array). The Style Detector Ar- ray (hereinafter referred to as Detectors) has a configuration in which separate discrimina- tors that evaluate the strength of each of the management styles used as a reference are jux- taposed, and each Detector is implemented by deep learning. In addition to external scenarios such as the market environment and corporate performance trends, the contents of fund constituents (market capitalization and valuation gains and losses at each point in time) and daily trading behavior are received as time-series inputs and prepared as teacher data in advance. The management style of the fund to be analyzed is output as an attribute vector whose component is the similarity strength for each of the typical management styles. Typi- cal teacher data such as value, momentum, and low volatility are set up as virtual fund man- agers that mimic eight operational styles, and train them using the transaction data of each style of virtual fund manager generated by simulation. Since these styles fall within the range of existing style classifications, it seems difficult to find new styles. However, if data accumulation and research progress in the future, new management styles (i.e. factors) may be discovered. If so, the added value as a style analyzer will increase. Although this system has not yet been implemented and no verification results are available, future progress is ex- pected as an example of applying AI to an important field for the fund of evaluation and se- lection of investment institutions.
II-5. Black-box and Accountability
When introducing deep learning into the asset management, there are major issues to be aware of. The problem is that it is difficult to intuitively understand the logic and model structure behind the process from input to output. Especially in multi-layer deep learning,
only the input (layer) and output (layer) focus on the structural characteristics of the algo- rithm, but the process between them tends to be a black box. This is unavoidable due to the complex structure of deep learning, but if the process in the middle is not understood, the robustness and economic rationality as a prediction model will be questioned. In other words, even if the past can be explained well, the user cannot judge whether the accuracy of the model will continue in the future. In particular, the model risk is not limited because it is a model for financial markets where the market structure may change in a short period of time. And when considering asset management as a commissioned business, this black box- ing makes it difficult to fulfill the fiduciary duty. In other words, this means that the trustee who uses AI models cannot fully explain to the consignor. It is not easy to intuitively ex- plain why the result is produced in a nonlinear multilayered algorithm such as deep learning.
It is essential for accountable trustees to explain the process, especially when performance is not satisfactory. In the situation where even the developer does not understand the reason for the output in the black box, the explanation to the outsourcer will not be possible.
The issue of black box by AI is an important issue not only in asset management but also in many other fields such as medical care and legal affairs. In order to solve this problem, development of a method for easily explaining the relationship between input and output is progressing and expected. By this method, AI becomes explainable AI (Explainable AI, XAI for short). There are two methodologies: a method to make the model structure white box in an easy-to-understand manner, and a method to understand the behavior of the model of what inputs and what outputs. However, the structure of the model is diverse and complex, and the former method is difficult, and the latter method is actually put into practical use.
Samek et al. (2017) shows two methods, Sensitivity Analysis for input values and Lay- er-Wise Relevance Propagation. The Sensitivity Analysis method is to examine the amount of change in which output value changes with respect to which input value changes, and to understand the relationship between the input value and the output value. Note that this method does not go into the model structure. On the other hand, Layer-Wise Relevance Propagation method tries to understand the input that contributes to the output by going backwards from the output layer to the input layer. The AI used in the asset management of institutional investors must be XAI. This is because asset management is accountable. Al- though still a new field, the path to XAI will be a vital test for AI to become established in asset management.
III. AI and Investment Theory
The development of tools such as AI and big data may affect the investment theory it- self. This is because many investment theories are based on empirical analysis, big data ex- pands the range of data that can be used in empirical analysis, and AI brings innovation to empirical analysis methods. In the following, after explaining the role of risk factors in in- vestment theory, we will discuss two specific methods for estimating risk factors using AI and big data.
III-1. Investment Theory and Risk Factors
One of the most important themes in investment theory is the estimation of risk factors that bring about a risk premium. The first investment theory in which factors were systemat- ically specified would be the CAPM theory proposed by Sharpe (1964). The CAPM theory uses market excess returns as the only factor. In other words, the theory is that the excess re- turn of assets depends only on the beta, which is the sensitivity of the asset to the market re- turn. On the other hand, Fama & French (1993) confirmed that there is a risk premium that cannot be explained by market factors. It was demonstrated empirically and showed the ef- fectiveness of two factors: value and size. A three-factor model was proposed along with market factors. In addition, Fama & French (2015) proposed a five-factor model by adding two factors, quality and asset growth, to three factors. Market index funds and ETFs, which are now the core portfolio of asset management by institutional investors, have grown with the background of CAPM theory. In the 2000s, smart beta, which has exposure to various factors, gained a lot of attention. Kato (2015a) pointed out that there is a three-factor model behind the rise of smart beta. In addition, the asset pricing model that is indispensable for portfolio evaluation is also composed of factors. In this way, factors are now at the heart of the entire asset management business. Especially after the introduction of smart beta, factor development has been directly linked to the development of asset management products, and factor development competition has intensified. Harvey et al. (2016) reported that 164 factors have been published in papers over the past nine years. Of course, it is natural to think that the number of significant factors is limited to a much smaller number. Incidental- ly, FTSE and MSCI, which are major securities market index providers, classify the basic factor indexes into six (Momentum, Quality, Size, Value, Volatility, and Yield). These are widely accepted by institutional investors. However, the definitions of the factors of the two companies are slightly different. For example, as value factor, FTSE uses cash-flow/price, earnings/price, and sales/price, while MSCI uses forward price/earnings, enterprise value/
operating cash flows, and price/book value. What definition is the optimal for value factor?
Fama & French (1993) pointed out that “there are more fundamental factors behind these factors” in the final chapter after defining the factors of value and size. In other words, it suggests that there is a true factor behind the three factors proposed by them. Many of the factors that have been developed so far have been empirically derived by experts and are not necessarily optimal.
Here, we will introduce two attempts to estimate factors using AI. One is the extraction of factors using a genetic algorithm, which is a method of trying to find the optimal combi- nation from existing data. The other is to use the market sentiment index calculated by ag- gregating market data by text mining as a new factor.
III-2. Extraction of Risk Factors by Genetic Algorithm
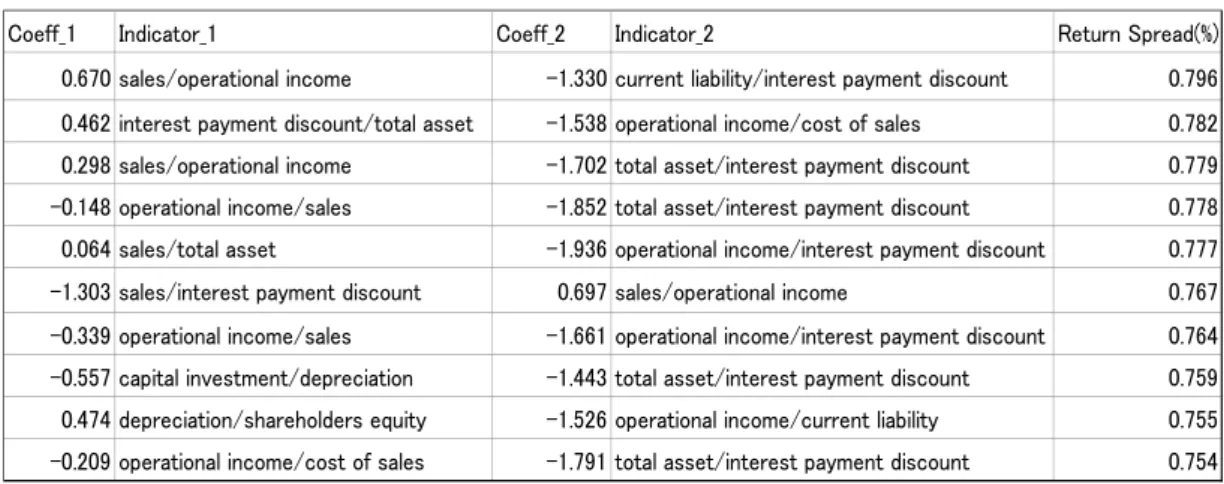
What is a good risk factor? The most obvious condition is that it provides a risk premi- um with high statistical significance. In other words, the return disparity (spread) between a higher-factor portfolio (a portfolio made up of stocks with a higher factor value) and a low- er-factor portfolio (a portfolio made up of stocks with a lower factor value) is historically large enough. It is statistically significant. In general, when finding a factor, a variable that seems to be useful empirically is created and its spread is calculated and a statistical test is performed. In the case of stocks, company financial information such as profit margin and ROE, and valuation indicators such as PBR and PER are often used. However, corporate fi- nancial information is diverse, and if it is used as an indicator such as ROE (profit/share- holder’s equity), the number of combinations increases. In addition, considering that a sin- gle index is created by weighted average of multiple indicators, the number of candidates becomes enormous. It is not unreasonable for an expert to take the approach of creating a factor considering what seems to be good empirically. Therefore, here we will introduce a method to find the most optimal factor from a huge number of combinations using a genetic algorithm, which is one of the AI technologies used for optimization. The following method is based on Kou (2017), which is the result of research in the Kato laboratory at Kyoto Uni- versity. The method is to index by selecting a population of basic financial items such as profit, sales, debt, shareholder capital, and selecting any two variables to form an index.
One, two, and three are selected from the population of these indices, and a weighted aver- age with an arbitrary weight for each is used as a candidate for a new factor. The return spread between the higher factor portfolio and the lower factor portfolio classified by this factor value is calculated and tested. The above process is repeated while appropriately changing the weights, and factors with high statistical significance are selected. A genetic algorithm is used as an algorithm for finding an optimal combination by changing weights.
Genetic Algorithm (GA)
Genetic algorithm is an AI technology and is an optimization method that gradually ap- proaches the optimal solution while mating and mutating genes. It is made using the process of biological evolution. The advantage of the genetic algorithm is that it can be applied to any type of problem while being easy to design. Here, since the calculation is performed by changing the type and number of indicators constituting the factor, it is not clear what char- acteristics the optimization problem itself has. If it is a genetic algorithm, it is possible to avoid a situation in which the solution cannot be determined depending on the problem. In addition, the factor is designed by linear combination this time, but even if it is designed in a different form, it can be compared fairly by the same method. On the other hand, the glob- al convergence is not guaranteed. There is also a drawback that there are no common values for mating and mutation parameters, and the results depend on the design method.
The following is a specific method performed in Kou (2017). 13 financial items from the balance sheet and income statement are picked up. They are sales, capital investment, depre- ciation, net income, operating income, dividends, current liabilities, fixed liabilities, interest discounts, total assets, current assets, shareholders’ equity, and cost of sales. We consider the index that represents the fundamentals of a company as a true factor, and do not use market capitalization data using stock prices. Therefore, values that are often used in factor models (shareholders’ equity÷market capitalization), size factors (market capitalization), or momen- tum factors (recent returns) are not candidates here. As Fama & French (1993) points out, they want to discover the true fundamentals behind stock price fluctuations. Two of the 13 are arbitrarily selected and the ratio is taken as an indicator. These indicators are the ele- ments that make up the factor. Even if the two types are the same, if the denominator and the numerator are reversed, the number of elements is 13P2=156. Then, define the factor as follows:
Factor =∑ni=1wifi
Here, n is the number of elements that make up the factor, where n = 1, 2, 3. fi is the real value of the i-th selected element, wi is the weight to fi, and takes an arbitrary real number.
In other words, a linear combination of one to three elements is defined as a factor. Although the form of the nonlinear factor is also worth considering, since the weight value is arbitrary, the range of expression is wide, and complex models are not preferred in practice, so only the linear case is considered here. They calculate the factor values defined above for each is- sue in the population, and rank issues in descending order according to the values obtained.
At this time, if the return is higher as the ranking is higher, and the return is lower as the ranking is lower, this factor value has a positive correlation with the level of return, and the risk premium. On the other hand, if the ranking is higher, the return is lower, and the lower ranking is higher, the factor value is negatively correlated with the return and has a negative risk premium. In this case, by reversing the sign of the coefficient of the weight, a factor having the same correlation in the positive direction is obtained. Here, we use financial data from December 2000 to December 2015 and stock returns from April 2001 to March 2016.
The analyzed stock population is 140 stocks of all major stocks listed on the Tokyo Stock Exchange. First, factor values based on financial item data for December 2000 are calculat- ed and ranked. Monthly returns from April 2001 to March 2002 are calculated using the top 20% stocks as a higher factor portfolio and the bottom 20% stocks as a lower factor portfo- lio. Then the return spread for the higher factor portfolio and the lower factor portfolio is calculated. The above work is repeated every year from 2001 to 2016, and the spread return for 15 years is calculated. A genetic algorithm is used to search for a combination of indica- tors and the weight of each indicator that will give the maximum return spread for 15 years.
Table 6 shows the analysis results for the combination of two elemental indicators. Looking at the results, variables that have not been used much in past studies such as interest expense discounts and current liabilities appear at the top. In addition, there are many negative coef- ficients. When determining factors empirically, there are few cases where negative factors
are used. This is because the intuitive image does not give us negative ones. When it is se- lected mechanically, there are many negative coefficients, which shows that it is possible to make selections that exceed human intuition. Regarding these factors, it would be useful to consider their fundamental meanings from the obtained combinations. However, it should be noted that these factors also use only the financial information data of the company, and the range of the data is limited. In the next section, we will examine factors that do not de- pend on financial information. For reference, if the value factor (market capitalization/share- holders’ equity) is added to the indicator population, the value factor is selected as the most significant factor. As is often pointed out, the strength of the value factor in the Japanese market is evident.
III-3. Market Sentiment and Risk Factors
As introduced in the previous section, typical factors that have already been used are those that use stock prices and company financial information such as ROE. This is because the fundamental indicators created from a company’s financial information represents the company’s risk, which is considered to be incorporated into the stock price and result in a risk premium. However, it is not clear what financial information can accurately predict fu- ture fundamentals, and it is likely to change over time and the environment, and it is not easy to find a long-term stable factor from financial information. By the way, it is each in- vestor who actually buys and sells stocks and affects the stock price. In other words, in the end, it is natural to think that what investors think is a risk and is factored into the stock price. However, the number of investors is huge, and it has been extremely difficult to deter- mine how investors think. However, by digitizing information and improving text mining technology, it becomes possible to aggregate a huge amount of information from various data on the Internet, centered on text data, and to aggregate how investors think. If that is
Table 6. Searching Factors with Genetic Algorithm (case of two indicators)
Source: Masayoshi Kou (2016), “Searching Factors with Genetic Algorithm” Kyoto University
the case, it can be considered that the aggregated information becomes a factor representing the market sentiment. Therefore, it is verified whether or not there is a risk premium in the collected information. The following is based on the research results of the Kato laboratory at Kyoto University. This information is a summary of investor ideas collected from the In- ternet, but here we use TRMI, which is the sentiment index used for volatility prediction in this paper. TRMI has many indexes, but here we use an optimistic index and a gloom index, and verify whether these indexes are factors. The verification method is the same as the nor- mal factor verification. In other words, the exposure of each stock to the factor (coefficient of regression analysis) is calculated and used as the factor value of each stock. Stocks are ranked according to the magnitude of this factor value, and the population is divided into two categories: higher factor portfolio and lower factor portfolio. Then, this spread is de- fined as the factor return by subtracting the return of the lower factor portfolio from the re- turn of the higher factor portfolio. The above procedure is applied to the optimistic index and pessimistic index, and the respective factor returns are calculated. The target is 380 stocks for which data exists throughout the period from the US stock of the S&P 500 popu- lation. The data period is 2001/1/3 to 2017/10/11 (daily). Exposure recalculation and portfo- lio rebalancing are done once every six months. Exposures are estimated by regressing the return of each stock by the return of each sentiment index using daily data for half a year.
Two factor returns are risk adjusted by a five-factor model (market, value, size, quality, and momentum; factor index returns are MSCI factor index) and the excess return (intercept) is tested. As a result, a positive excess return was significantly observed for the optimism fac- tor at a confidence level of 10%, and a negative excess return was significantly observed for the pessimism factor at a confidence level of 5%. It can be seen that the sentiment index, which aggregates the feelings of many people, has an impact on the market, and these feel- ings may reflect market risks. Of course, public opinion, like stock prices, will be greatly af- fected by the media coverage and mood of the media in the short term, so we need to be careful, but the efforts of reading and quantifying investor sentiment will increase in the fu- ture.
Ⅳ. Robo-Advisor and Wealth Management
In the asset management business, wealth management, which has been a personal asset management service for a limited number of wealthy people, is becoming popular. Through the application of AI, this wealth management has been made into Fintech under the name of Robo-Advisor and is now spreading widely at a low cost. The following outlines the ap- proach to personalization and the application of Fintech to portfolio optimization.
Ⅳ-1. Personalization of Asset Management and Functional Approach
Wealth management is a highly personalized service for wealthy investors, but with the development of Fintech, personalized services are being offered to ordinary investors as
well. This service is called a Robo-Advisor, but it is characterized by being highly IT-orient- ed and realizing a service that meets the needs of each investor at a low cost. The technolo- gy that supports the Robo-Advisor is AI and big data. The following is an overview of the personalization technology actually used by Robo-Advisor. In the following examples, Kato (2015b) is mainly used as a reference.
In traditional asset management, asset classes such as domestic stocks, domestic bonds, foreign stocks, and foreign bonds are generally used in portfolio construction. By building a portfolio combining these asset classes, we aim to achieve the targeted risk/return profile.
For young investors who have small assets and the purpose of asset management is not clear, a simple optimization that takes the maximum risk and gives the maximum return within the acceptable risk level is sufficient. Therefore, the simple asset class classification is sufficient. In this case, the most commonly used optimization method is the mean vari- ance method. However, the management goals of matured and diversified modern investors, especially senior investors, cannot always be expressed by risk/return alone. This is because their asset management objectives are diverse. As people age, their asset size, family struc- ture, hobbies, and lifestyle usually vary from person to person. If the purpose of asset man- agement is to support these diverse lifestyles of people, the purpose of asset management should also be diverse. The time limit of life, which was not conscious of when you were young, is also realistic, and the setting of the investment period is diversified. Therefore, in asset management, in addition to the risk/return viewpoint, various viewpoints or viewpoints of functions to achieve the objectives are important. The use of AI and big data will be im- portant for optimization methods that satisfy these various functions simultaneously, that is, for personalization. By the way, in terms of functional approach, Merton & Bodie (1995) have redefined financial services from a “functional perspective”. Financial business is di- vided into six categories from the functional viewpoint of what services are provided rather than traditional business formats such as banking, insurance, and securities. We introduce a functional perspective with a focus on asset management. In fact, this idea has already been introduced in advanced funds. For example, the LDI (Liability Driven Investment) intro- duced by the pension fund is divided into two asset classes, each of which has a distinct function. A debt hedging portfolio and a return pursuit portfolio. This is an operational method for building an overall portfolio. The California Public Employees’ Retirement Sys- tem (CalPERS) categorizes the entire portfolio into growth assets, income assets, inflation hedge assets, and real assets, and clarifies their functions. In addition, Money Design Inc.’s service THEO, Japan’s first Robo-Advisor, manages its entire portfolio using three portfoli- os. Equity (growth), interest rate (income), and inflation hedge. In this way, an investment method that is conscious of the investor’s purpose is called a functional approach to asset management, and a portfolio with a clear function is called a functional portfolio.
In the following, we introduce three functional portfolios (growth portfolio, income portfolio, and inflation hedge portfolio) as examples of functional approaches to meet the diverse objectives of investors. The growth portfolio is for growth, the income portfolio is for stable cash flow, and the inflation hedge portfolio is for hedging inflation. In the follow-
ing, we will examine methods for optimizing the allocation ratio to these functional portfoli- os according to various objectives. Functional classification is based on the risk factor taken up in the previous section, and is currently determined empirically in the same way as ordi- nary risk factors. However, as the number of Robo-Advisor users increases in the future and various objectives of asset management by individual investors are accumulated, it is ex- pected that the functional classification method will evolve as these become learning data.
Ⅳ-2. Optimal Asset Allocation of Functional Portfolios and AHP
In the portfolio construction with the functional approach, the optimization method of how to determine the allocation to the three functional portfolios becomes a problem. Tradi- tional portfolio theory uses the mean variance method for optimization. However, the mean variance method that considers only returns and risks is not necessarily a suitable method for various purposes. For example, LDI, one of the functional approaches discussed above, will not use the mean variance method to determine the allocation between the debt hedge portfolio and the return pursuit portfolio. This is because the allocation of the debt hedge portfolio should be a function of the liability value of the pension fund. In this way, multi-purpose optimization is required for portfolio optimization for diversifying investor needs, and various methods have been proposed. Typical examples include genetic algo- rithms, particle swarm optimization, and analytic hierarchy process. Among them, the ana- lytic hierarchy process (AHP) is expected to be applied with the development of big data that captures individual characteristics. The following explains how to calculate the optimal asset allocation of a functional portfolio using AHP.
Analytic Hierarchy Process (AHP)
AHP is a decision-making method proposed by Saaty (1980), and is used for deci- sion-making influenced by various factors and decision-making influenced by sensory fac- tors such as individual preferences. It is considered to be suitable for optimizing the portfo- lio, that is, personalization in asset management after retirement, which is influenced by various factors and individual preference. In particular, empirical results are required for pa- rameter estimation, and therefore they have not been used in asset management so far. How- ever, the relationship between individual attribute information and investment characteris- tics can be supplemented with big data, and it can be expected that the accuracy will increase, and the application to asset management will also increase. Regarding the applica- tion of AHP to asset management, Saaty & Rogers & Pell (1980), Bolster & Janjigian &
Trah (1995), Miyazaki (2003), Le (2008), and Kato (2015b) are conducting introductory re- search. In this paper, an example of deciding the allocation of three functional portfolios us- ing AHP based on Kato (2015b) is shown below, and an advanced method using big data is examined.
AHP structure
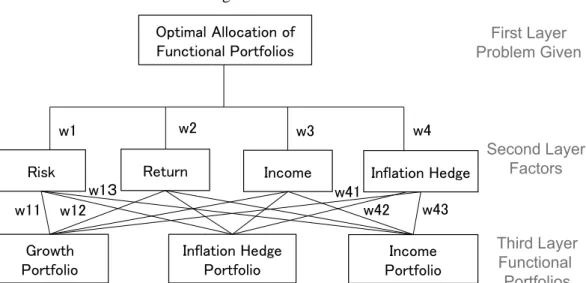
AHP has a hierarchical structure for each group of elements necessary for problem solv- ing. Figure 1 shows the overall structure of this example. wij is an evaluation (weight) for element j of the next hierarchy in element i of a hierarchy. i = 0 in the first layer is omitted.
First, the problem given in the first layer is set, and the four elements in the second layer (the risks and returns representing the individual orientations related to the three functional port- folios), and in the 3rd layer there are 3 elements (3 functional portfolios) are set. Next, each element pair is compared with each other and given a relative value. From this relative val- ue, an evaluation (weight) for an element of each layer is calculated. The number of hierar- chies can be increased if necessary.
Paired comparison matrix
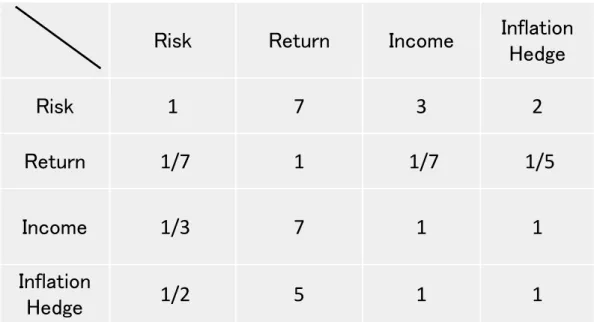
The reason for comparing each pair is that even if there are multiple evaluation axes, if there is a relative value for each pair, it can be compared with one numerical value. Since the relative value of the pair comparison is given to all pairs between elements, it is ex- pressed as a pair comparison matrix. In this example, there are four elements in the second layer, so the paired comparison matrix is a 4×4 matrix. Since there are three elements in the third layer, the paired comparison matrix is a 3×3 matrix. Here, the relative values used for this comparison are 1 to 9 and their reciprocals. For example, if element 1 is absolutely more important than element 2, the matrix (1, 2) is assigned 9 and (2, 1) is assigned 1/9. The second-tier matrix is determined by each investor based on his characteristics and prefer- ence, and the third-tier matrix is pre-determined by the AHP designer, considering that it is common to all investors. First, the matrix of the second layer, but here we consider a virtual investor named Mr. A and create a 4×4 paired comparison matrix of the second layer from
Figure 1. AHP Structure
Source: Kato, Y. (2015b), Asset management methods in an aging age: cash flow management and functional approach, Ittosha
his characteristics. Assume that Mr. A is a 68-year-old retiree, possesses 30 million yen, and has no labor income anymore. It is assumed that information such as age, asset size, income, etc., was obtained from the question to Mr. A, and the matrix shown in Fig. 2 was estimated using existing learning data. In this example, there is a number 7 at the intersection of the risk row and the return column. In other words, it can be seen that for Mr. A, low risk is
“very important” compared to high return. In addition, the intersection of income and infla- tion hedge is 1, indicating that the two elements have the same importance. Regarding Mr.
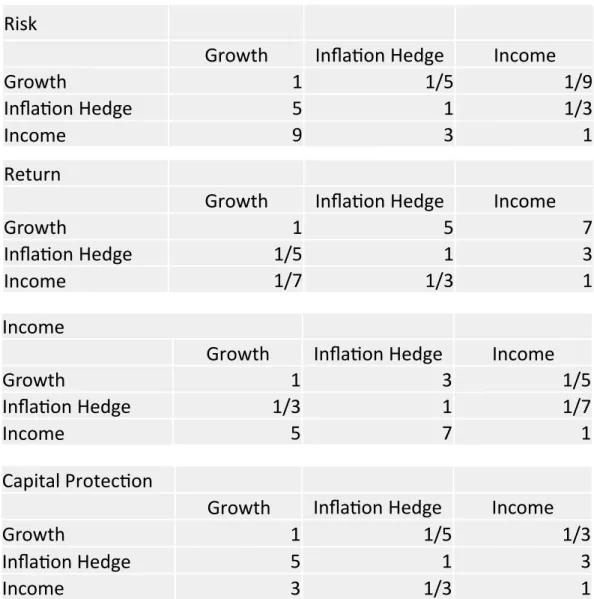
A’s estimation of the pairwise comparison matrix, when Mr. A answers the question, the question may not be fully understood or may be answered with a bias. Therefore, as the number of samples increases, it becomes possible to estimate a matrix that is more suitable for the person by identifying and correcting the bias when answering a new customer’s question, using the answer data of the existing customer and the subsequent asset manage- ment data as teacher data. That is, as the number of samples increases, it can be expected that the parameter estimation accuracy of the paired comparison matrix will increase. In ad- dition, a pairwise comparison matrix between the three elements of the third layer (the func- tional portfolios) in each of the four elements of the second layer is estimated using the past return data as teacher data and empirical judgment of experts. Assume that the estimation is as shown in Fig. 3. In the “risk” element, there are 9 at the intersection of the income row and the growth column. This indicates that the income portfolio is “absolutely important”
compared to the growth portfolio with respect to the element of “risk (low)”. On the other hand, the element “return” has 7 at the intersection of the growth row and the income col- umn. This indicates that the growth portfolio is “significantly more important” than the in-
Figure 2. Pairwise Comparison Matrix at Second Layer Mr. A’s Case (retired)
Source: Kato, Y. (2015b), Asset management methods in an aging age: cash flow management and functional approach, Ittosha
come portfolio for the “return” element. If a large amount of customer data is also accumu- lated for this third-level matrix, it will be possible to estimate a matrix that reflects investor preference using them as teacher data. Thus, all paired comparisons of the hierarchical structure have been completed.
Calculation of weights with eigenvectors
Next, the weight wij for the element in each layer is calculated from the paired compari- son matrix. This can be obtained from the eigenvalues of the matrix. (See Saaty (1980), Kato (2015b), etc.) When the eigenvalues are actually calculated using the paired compari-
Risk
Growth Infla�on Hedge Income
Growth 1 1/5 1/9
Infla�on Hedge 5 1 1/3
Income 9 3 1
Return
Growth Infla�on Hedge Income
Growth 1 5 7
Infla�on Hedge 1/5 1 3
Income 1/7 1/3 1
Income
Growth Infla�on Hedge Income
Growth 1 3 1/5
Infla�on Hedge 1/3 1 1/7
Income 5 7 1
Capital Protec�on
Growth Infla�on Hedge Income
Growth 1 1/5 1/3
Infla�on Hedge 5 1 3
Income 3 1/3 1
Figure 3. Pairwise Comparison Matrix at Third Layer
Source: Kato, Y. (2015b), Asset management methods in an aging age: cash flow management and functional approach, Ittosha
son matrix in the second layer (Fig. 2) and normalized, the four weights (w1 to w4) are risk (48.5%), return (4.8%), income (23.5%), and inflation hedge (23.2%). For Mr. A of retired and risk-averse Mr. A, low risk is most important and heaviest. On the other hand, income is the next most important because there is no labor income. Assets value need to be preserved because inflation will reduce asset value. On the other hand, it is not necessary to seek re- turn taking high risk. Next, the weights (wi1, wi2, wi3; i = 1, 2, 3, 4, i is the elements of the second layer) from the four elements of the second layer to the three elements of the third layer. The calculation is performed from the three-layer paired comparison matrix (Fig. 3) using eigenvectors as above. Finally, calculate the final weight of the three elements (func- tional portfolios). For this purpose, the weight of each element is added from the upper lay- er. As a result, growth (13.4%), inflation hedge (30.4%), and income (56.2%) are calculated, and this is the optimal portfolio for Mr. A. Focus on income and pay attention to inflation hedges. It does not give too much weight to growth and lowers risks.
As described above, AHP enables the construction of a portfolio that reflects individual characteristics and a preference with a multi-functional and multi-purpose framework. As for the pair comparison matrix used in AHP, as the number of users (samples) increases, the characteristics of each individual and the tendency of preference for investment can be un- derstood, and these can be used as teacher data. With the accumulation of big data, it is ex- pected that it will become possible to estimate portfolios that are more suitable for each in- dividual.
Ⅴ. Big Data and ESG Evaluation
ESG investment has become a global theme for institutional asset management. Howev- er, it is still an immature field and application of new technology is also expected. This sec- tion gives an overview of how AI/Fintech is used for ESG investment.
V-1. ESG Investment and its Challenges
ESG is the concatenation of the three initials of Environmental, Social, and Governance.
ESG investment is an investment method that selects companies based on the company’s approach to these three factors. For example, investing in a company that manages the envi- ronment (E) in consideration of CO2 emission reduction, a company that manages the com- pany in consideration of the society (S), such as the appointment of female officers (support for women’s social advancement), and a company that conducts management that emphasiz- es governance (G), such as hiring outside directors. By the way, evaluation of the compa- nies’ efforts toward ESG is done by specialized ESG rating agencies, and ESG ratings are assigned to each company. However, many issues have been pointed out regarding this ESG rating. The ESG information of each company that the rating organizations refer to when as- signing the rating is disclosed in the company’s integrated report. However, disclosure of
ESG information has only just begun, and a limited number of companies have published integrated reports. This is not a situation where the amount of information is sufficient. In addition, ESG information is called non-financial information, and there is much informa- tion that has not been quantified. As qualitative judgments are made to some extent, ESG ratings may differ greatly for the same company if the rating institutions are different. Ac- cording to GPIF (2017), cross-section plots are uncorrelated in the corporate population with the same ESG rating by FTSE and MSCI as of 2017. As long as qualitative evaluation is included, it will not be easy to fill in the difference. Moreover, the frequency of corporate disclosures such as integrated reports is limited, and it is difficult to reflect in real time the ESG status of companies that change from day to day. In addition, non-numeric qualitative information may inevitably bias a company’s announcement in favor of the self. These con- cerns about ESG evaluation are a major issue in ESG investment.
V-2. Big Data and ESG Evaluation
The approach of using big data and AI in ESG evaluation is already in use. In other words, in addition to corporate disclosure information, a large amount of third-party infor- mation, such as public institution information, news, and consumer comments, is collected and evaluated as big data. According to Ishii (2018), specific applications of big data and AI in ESG evaluation include natural language processing and classification algorithms. In nat- ural language processing, most of the information used is text information, which means analysis and semantic extraction. The classification algorithm is to classify the meaning ex- tracted from text information into the elements that compose the ESG rating and score it.
For example, some text information is analyzed and classified as information relating to a company’s board of directors and items related to governance evaluation. Then, the classi- fied items are evaluated and a score is calculated. In fact, companies that provide such ESG evaluation services are beginning to appear. According to Ishii (2018), some company is fo- cusing on enormous data on the Internet. ESG-related news from companies on the Internet is aggregated and converted into scores. At the core of the system is a machine learning model that evaluates whether a piece of news is positive or negative for the company’s ESG.
Since natural language processing is a machine learning model, it is necessary for teacher data to teach the machine the correct answer. For example, a human analyst evaluates in ad- vance which category a news article corresponds to and creates a correct data set. First, teachers give correct answers to 100-200 news articles. Then, the learned model is loaded with new articles and categorized. This step verifies that the machine learning model cor- rectly identifies the category. Based on the deviation (error value) from the correct answer, the model is further tuned to improve the model performance. The data to be processed is sourced from local news reported on the Internet, internationally reported news, industry magazines, reports from NGOs and watchdog organizations, and various blogs and social media. The size of this big data enables advanced machine learning. It also overwhelms the number of data and brands covered by traditional rating agencies. The number of ESG rat-
ing agencies that provide similar services using AI and big data is expected to increase in the future.
Ⅵ. Conclusion - AI/Fintech and the Future of Asset Management Businesses
Ⅵ-1. Can Investors Make Excess Return Using AI/Fintech?
This article introduced a wide range of asset management applications with AI/Fintech.
Text mining and deep learning were the main AI elemental technologies. Text mining is used to develop new data by converting enormous and unused text information into numeri- cal data. Deep learning is a powerful tool for modeling complex structures using huge amounts of data. By the way, according to the Nihon Keizai Shimbun dated August 30, 2018, there are 10 AI investment trusts sold in Japan (investment trusts that use AI technolo- gy). When it is verified, it is said that most of them are on an average level. In particular, fo- cusing on investment trusts managed with Japanese stocks, many are underperforming the market average. It does not seem to be a simple story about using AI to get excess return.
The excess return over the market average is a zero-sum competition. For this reason, mar- ket participants will constantly monitor the trends of other players strategies and change their strategies. The past structure modeled with sophisticated AI will change quickly. In ad- dition, it is natural to think that the excess return itself will decrease if the cost of acquiring excess returns is reduced by AI or Fintech. Some argue that with this result, AI is not benefi- cial to investors. However, AI-based automation is expected to lower operational costs and increase market efficiency. In any case, the flow of AI use in asset management no longer stops. It is easy to imagine that without AI, you will not be able to participate in the game.
This is the same as a fund manager who currently does not use personal computers or the Internet. As mentioned in this paper, AI/Fintech is not only used to develop asset manage- ment methods that seek for excess returns, but also to evaluate management methods, con- tribute to new investment theories, and personalized asset management services. And the development of new ESG evaluation methods is also expected. Then, Fintech companies that utilize these AI technologies will rise, expanding the base of users of asset management services and contributing to individual assets management.
Ⅵ-2. What would be the Role of Humans in Asset Management?
By the way, what will happen to the division of roles between humans and AI in asset management in the AI/Fintech era? The traditional asset management, in which information on investment assets is analyzed and investment decisions are made based on that informa- tion, will be handled by AI. This process can be modeled easily by AI, and the day when hu- man managers will not be able to beat AI/Fintech managers is not so far away. Then what is the role of human managers? It would be the engagement to companies and the creation of new investment opportunities. The engagement is becoming more important in order to get