学位論文
Cerebral blood volume measurement using near-infrared time-resolved spectroscopy and
histopathological evaluation after
hypoxic-ischemic insult in newborn piglets
香川大学大学院医学系研究科 機能構築医学専攻
生殖・発育学部門
中村 信
Thesis
Cerebral blood volume measurement using near-infrared time-resolved spectroscopy and histopathological evaluation after hypoxic-ischemic
insult in newborn piglets
Makoto Nakamura
Graduate School of Medicine (Doctor’s Course)
Faculty of Medicine, Kagawa University
Cerebral blood volume measurement using near-infrared time-resolved spectroscopy and histopathological evaluation after hypoxic-ischemic
insult in newborn piglets
Makoto Nakamura
a, Wataru Jinnai
b, Satoshi Hamano
aShinji Nakamura
a, Kosuke Koyano
b, Yoichi Chiba
cKenji Kanenishi
b, Saneyuki Yasuda
b, Masaki Ueno
cTakanori Miki
d, Toshiyuki Hata
e, Takashi Kusaka
aa
Department of Pediatrics, Faculty of Medicine
b
Maternal Perinatal Center
c
Departments of Pathology and Host Defense
d
Departments of Anatomy and Neurobiology
e
Departments of Perinatology and Gynecology
Abstract
The aim of this study was to assess the relationship between the cerebral blood volume (CBV) measured by near-infrared time-resolved spectroscopy (TRS) and pathological change of the brain in a hypoxic-ischemic (HI) piglet model.
Twenty-one anesthetized newborn piglets, including three sham controls, were studied. An HI event was induced by low inspired oxygen. CBV was measured using TRS (Hamamatsu TRS-10). Data were collected before, during, and 6 hours after the insult. CBV was calculated as the change from the end of the insult. The piglets were allowed to recover from anesthesia for 6 hours after the insult. At the age of 5 days, the brains of the piglets were perfusion-fixed, and histologic evaluations of brain tissue were performed. The extent of histopathological damage was graded in 0.5-unit intervals on a 9-step scale.
CBV increments were well correlated with histopathological scores, especially at 1 and 3 hours after resuscitation. Spearman's rank-correlation coefficients at 1, 3, and 6 hours after resuscitation in the gray matter were 0.9016, 0.9127, and 0.6907, respectively.
We conclude that an increased CBV after HI insult indicates more marked histological brain damage. CBV measurement immediately after resuscitation provides a more precise prediction of the histological outcome.
Keywords:
Amplitude-integrated electroencephalography Animal model
Brain histology
Cerebral blood volume
Near-infrared spectroscopy
Hypoxia-ischemia
1. Introduction
In the therapeutic strategy for hypoxic-ischemic encephalopathy (HIE) associated with neonatal asphyxia, mild therapeutic hypothermia initiated early after birth, particularly within 6 hours, is effective, and evaluation in this period is very important
1–3. Changes after hypoxic-ischemic (HI) insult in neonates and fetuses, including exacerbation of the amplitude-integrated electroencephalography (aEEG) pattern 2,3, an increase in the cerebral blood volume (CBV), an increase in the cerebral Hb oxygen saturation (ScO2), and an increase in the cerebral blood flow (CBF), have been reported as factors indicating a poor prognosis clinically and by experimental studies using animals 4–9. In particular, aEEG has been reported to be very useful for the prognosis, which is aggravated with a low amplitude, burst suppression, or flat trace on aEEG after hypoxic-ischemic insult 2,3,10. However, as a low-amplitude pattern is often observed immediately after birth and gradually normalizes, the prognosis after about 6 hours is more accurate than that after 3 hours 11–13.
Regarding evaluation of the cerebral circulation using near-infrared spectroscopy (NIRS), Marks et al.6, using a sheep fetus model of brain ischemia induced by carotid artery occlusion, showed that histological brain damage was severe when the changes in cerebral total Hb increased from about 12 hours after ischemic insult. Using NIRS and changes in the inspired oxygen concentration, Meek et al.7 also reported that the CBV and CBF were increased during the first 24 hours in infants with adverse outcomes.
While the timing of measurements after birth is not mentioned in their report, these findings are considered to reflect primarily delayed impairment of cerebral energy metabolism and subsequent cerebral circulation. In a clinical study in which the CBF was measured in term asphyxiated neonates using the xenon-133 clearance technique,
the prognosis was also unfavorable in children who showed increases in the CBF, which were considered to be due to vasoparalysis associated with brain damage 8. On the other hand, van Vel et al.14 observed in a clinical study that the CBV was reduced 2-12 hours after birth in neonates with marked asphyxia, so the results have not necessarily been consistent.
Many of the studies concerning evaluation of the cerebral circulation/oxygen metabolism after a hypoxic-ischemic event have been performed about 24 hours after the event or thereafter, and data concerning the cerebral circulation very early after insult are scarce. We have evaluated the relationships of aEEG findings with the CBV and ScO2 early after hypoxic insult in an HIE model using newborn piglets21.
We hypothesized that monitoring very early changes in the CBV from immediately after HI insult would help differentiate the severity of brain damage.
In this study, changes in the CBV and ScO2 within 6 hours after resuscitation were compared with histological changes after 5 days.
2. Materials and Methods 2.1 Animal preparation
The study protocol was approved by the Animal Care and Use Committee of Kagawa University. Twenty-one newborn piglets, 12 males and 9 females, obtained within 24 hours of birth and weighing 1.63–2.10 kg, were used in this study. Eighteen piglets were subjected to HI insult and the other three were sham-controlled. The animal preparation method for the HI model was previously reported in detail 15.
Briefly, anesthesia was induced with 1–2% isoflurane in air using a facemask. Each piglet was then intubated and mechanically ventilated with a pressure-controlled, continuous flow infant ventilator (InfantStar Models 500, Infrasonics, San Diego, CA, USA). The umbilical vein and artery were cannulated with a neonatal umbilical catheter for drip infusion, and blood pressure monitoring and blood sampling, respectively. After cannulation, each piglet was paralyzed with pancuronium bromide at an initial dose of 0.1 mg/kg followed by infusion at 0.1 mg/kg/h, and then anesthetized with fentanyl citrate at an initial dose of 10 µg/kg followed by infusion at 5 μg/kg/h.
Maintenance solution (electrolytes plus 2.7% glucose, KN3B; Otsuka Pharmaceutical Co., Tokyo, Japan) was infused continuously at a rate of 4 mL/kg/h via the umbilical vein. Arterial blood samples were taken at critical points and when clinically indicated throughout the experiment. Each piglet was then placed in a copper mesh-shielded cage under a radiant warmer to maintain a rectal temperature of 39.0 ± 0.5 degrees centigrade. Inspired gas was prepared by mixing O2 and N2 gases to obtain the oxygen concentrations required for the experiment. Ventilation was adjusted to maintain PaO2
and PaCO2 within their normal ranges. Arterial blood pressures were measured and recorded via the umbilical arterial catheter.
2.2 Near-infrared time-resolved spectroscopy and analysis
We used a portable three-wavelength near-infrared time-resolved spectroscopy (TRS) system (TRS-10; Hamamatsu Photonics K.K., Hamamatsu, Japan) and attached a probe to the head of each piglet. The light emitter and detector optodes were positioned on the parietal region of each piglet with a 30-mm interoptode distance. In the TRS system, a time-correlated single-photon-counting technique is used for detection. The concentrations of oxyhemoglobin (oxyHb) and deoxyhemoglobin (deoxyHb) were calculated from the absorption coefficients of oxyHb and deoxyHb, with the assumption that background absorption was due only to 85% (by volume) water. The total cerebral Hb concentration [totalHb], ScO2, and CBV were calculated as follows and also described previously 16,17:
[totalHb] = [oxyHb] + [deoxyHb],
ScO2(%) = {[oxyHb]/([oxyHb] +[deoxyHb])} ×100,
CBV (mL/100 g)= [totalHb] × MWHb × 10-6/(tHb ×10-2× Dt × 10),
where [ ] indicates the Hb concentration (µM), MWHb is the molecular weight of Hb (64,500), tHb is the blood Hb concentration (g/dL), and Dt is the brain tissue density (1.05 g/mL).
TRS measurements can be used to detect optical properties of brain tissue more selectively than continuous wave spectroscopy. Therefore, the influence of extracerebral tissue on this parameter in neonates might be comparatively small 18–20 .
2.3 Amplitude-integrated electroencephalography
Anesthetized piglets were placed in a copper mesh shield and then aEEG (Nicolet One; Cardinal Health, Inc., USA) was applied. All electrical devices and the copper mesh shield were grounded. The signal was displayed on a semi-logarithmic scale at a low speed (6 cm/h). We conducted measurements each second. Gold-plated electrode discs were placed at the P3 and P4 positions, which corresponded to the left and right parietal regions of the head. The maximum amplitude <5 µV was defined as low-amplitude EEG (LAEEG).
2.4 Hypoxic-ischemic insult protocol
Since the details were reported in our previous studies 15,21, only an outline of the HI insult protocol is presented here. Hypoxia was induced by reducing the inspired oxygen concentration of the ventilator to 4% after at least 120 min of stabilization from the initial anesthetic induction. If necessary to obtain a low-amplitude aEEG pattern (<5 μV), the inspired oxygen concentration was reduced further to 2%. From the beginning
of LAEEG, the insult was continued for 30 min. FiO2 was decreased (1% decrements) or increased (1% increments) during insult to maintain LAEEG, HR (>130 beats/min), and MABP (>70% of baseline). Upon the reinstatement of LAEEG, HR, or MABP, FiO2 was returned to 4% during the first 20 min of insult. For the final 10 min of the 30 min insult, if MABP exceeded 70% of the baseline, hypotension was induced by decreasing FiO2 until the MABP declined to below 70% of the baseline. Hypoxia was terminated by resuscitation with 100% oxygen. A base excess below -5.0 mEq/L was corrected as much as possible by sodium bicarbonate infusion to maintain a pH of 7.3–7.5. After 10 min of
100% FiO2, the ventilator rate and FiO2 were gradually reduced to maintain SaO2 of 95–98%.
2.5 Post-insult treatment
Once the piglets were weaned off the anesthesia and ventilator, and extubated 7–9 h after insult, they were allowed to recover and survived for 5 days in the incubator.
Piglets were fed 50–80 mL of artificial animal milk via a nasogastric tube every 6 h. The temperature of the incubator was maintained at 28–32 degrees centigrade. The presence of seizures was recognized clinically as rhythmic pathologic movements (cycling) and tonic postures sustained between cycling episodes. If seizures occurred, the piglet was treated with phenobarbital (20 mg/kg) via intramuscular injection. If seizures persisted, the piglet was treated with two successive anticonvulsant doses.
If seizures persisted after two successive anticonvulsant doses, the piglet was euthanized.
2.6 Histology
After the 5-day period, the animals were initially anesthetized with isoflurane, and the brain of each animal was perfused with 0.9% saline and 4% phosphate-buffered paraformaldehyde. Histological evaluations of brain tissue were performed and irregularities were graded according to a histopathology grading scale for a piglet model of posthypoxic encephalopathy 22. Coronal blocks of cortical gray matter, white matter, the hippocampus, and cerebellum were embedded in paraffin and cut with a microtome at 4 µm. The sections were stained with hematoxylin and eosin. At regular intervals of
clinical information. The extent of damage in each of the five regions was graded in 0.5-unit intervals on a 9-step scale that ranged from 0.0 to 4.0. We assigned a maximal score of 16 (cortical gray matter: 4.0; cortical white matter: 4.0; hippocampus: 4.0;
cerebellum: 4.0) to experimental piglets that could not survive for 5 days due to severe seizures. This was because the minimum time for visible histologic damage to develop is shorter with increasing injury severity, and an increasing number of damaged neurons are visible from 6 to 24 hours 23,24. Early evaluation might therefore cause underestimation of the damage.
2.7 Outcome grouping
Piglets were allocated to an outcome group based on the total histopathological score.
Piglets with a total histopathological score of 0 were categorized as undamaged, while all histopathology scores of piglets that did not survive to 5 days were assigned as 4 (total score, 16) and they were categorized as dead. All other piglets were designated as damaged 15,22.
2.8 Data analysis
GraphPad Prism 5.01 for Windows software was used for all statistical analysis. As histpathology scores are not continuous but ordered variables, correlations among the CBV, ScO2, and histopathology scores were compared using Spearman's rank correlation coefficient. We eliminated the dead piglets’ results from the correlation calculation among CBV, ScO2, and HIST scores. Wilcoxon’s signed-rank test and the unpaired t-test were used for physiological parameters. All measurement results are
expressed as means ± standard deviation (S.D.). Values of < 0.05 were considered significant.
3. Results
3.1 Physiological data
HR, MABP, and levels of arterial pH (pHa), PaO2, PaCO2, blood glucose, lactate, and hemoglobin in the piglets are shown in Table 1.
In the insult group, the HR, MABP, pHa, PaCO2, PaO2, base excess, and ScO2 values were markedly decreased at the completion of HI insult, while blood glucose and lactate levels were markedly increased. These values generally returned to the baseline with time, whereas MABP, blood glucose, and lactate had not returned at 6 hours after resuscitation.
3.2 Histological data and scoring
Table 2 shows the histological (HIST) scores of each piglet. Two piglets were undamaged, 11 were damaged, and 5 were dead. Examples of scored histologies are shown in Figure 1.
Figure 1.
Image of histological score for each part. Hematoxylin and eosin staining in the gray matter, white matter, hippocampus, and cerebellum. Scale bar = 100 µm. G0, G1, G2, G3, and G4 indicate graded histological scores developed by Thoresen et al. (1996).22
3.3 Cerebral blood volume and cerebral Hb oxygen saturation
In the HI group, the ScO2 at the end of insult was significantly lower than in the control group. However, the CBV at the end of insult did not significantly differ between the two groups. In the HI group, the ScO2 was low in all animals during hypoxia, but the CBV increased temporarily to a peak and decreased thereafter. The CBV was higher in the HI group during the insult, but showed no difference between the two groups at the end of the insult.
In the HI group, the CBV was reduced after 3 and 6 hours compared with the baseline.
The ScO2 was higher than in the control group after 1 and 6 hours. Even the control group presented a lower CBV at 6 hours compared with the baseline; however, no significance was shown (Table 1).
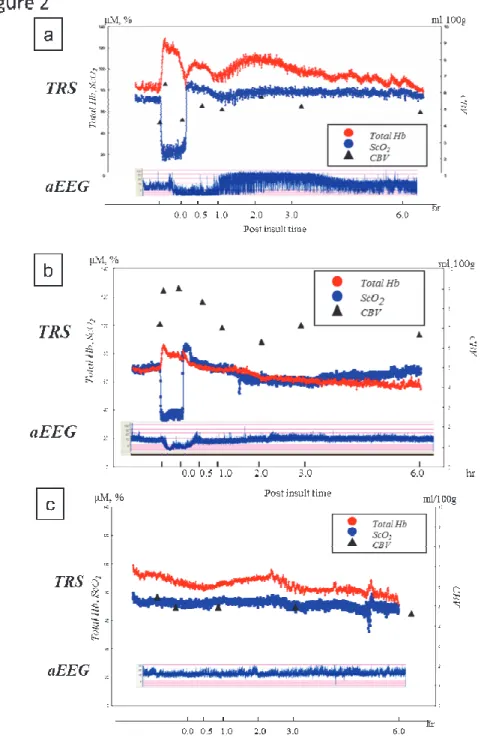
Figure 2 shows changes in the CBV, TRS, and aEEG in a typical case during the experiment. Those in histologically damaged, undamaged, and control piglet are shown in Figure 2a upper, Figure 2b middle, and Figure 2c lower, respectively.
Figure 2. Typical patterns of TRS and aEEG throughout the experiment.
Figure 2a shows typical patterns of a piglet with an increased CBV and a poor prognosis.
The CBV increased after the beginning of HI insult and decreased gradually after a peak, but increased gradually again after the beginning of resuscitation (CBV increase pattern). aEEG after resuscitation also showed a burst suppression pattern and the outcome was poor.
Figure 2b shows typical patterns of a piglet with a decreased CBV and favorable prognosis.
The CBV increased due to HI insult, remained high until resuscitation was initiated and decreased gradually thereafter. After resuscitation, aEEG recovered from the low-amplitude pattern and the outcome was favorable.
Figure 2c shows typical patterns of a piglet of the sham control group.
The CBV decreased gradually towards the 6-hour point, however, no significance was shown at 6 hours compared with the baseline.
The CBV (5.5±0.8 mL/100 g at baseline value) increased for a period after the beginning of HI, reached a peak (7.4±0.9 mL/100 g), and then decreased (5.8±1.2 mL/100 g) thereafter. In the undamaged newborn piglets in which the CBV was near the peak or above the baseline at the beginning of resuscitation, the CBV decreased after the resuscitation and the histological damage was mild (Figure 3a). On the other hand, in the damaged piglets, when resuscitation was initiated after the CBV increased to a peak and then decreased to a level near or below the baseline, the CBV increased again after resuscitation, and the histological damage was severe or the piglets died (Figure 3b). The transitions of the CBV and ScO2 during HI insult were reported previously in detail 15,21.
In Figure 3a, showing the example of a histologically undamaged piglet, CBV at the end of insult was higher than the baseline value and it decreased after resuscitation. In Figure 3b, showing a damaged piglet, CBV at the end of insult was less than the baseline value, and it increased after resuscitation.
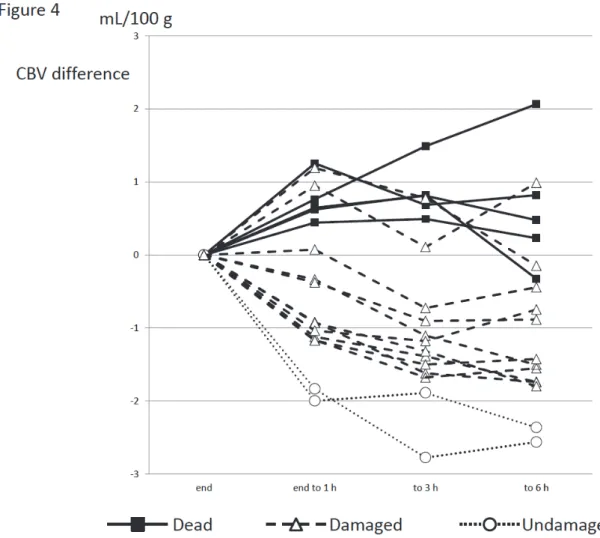
In the undamaged group, the CBV decreased rapidly in all animals after the initiation of resuscitation. In the dead group, however, the CBV increased from immediately after the beginning of resuscitation. In the damaged group, the CBV increased in some but decreased in others (Figure 4).
Figure 4. Changes in the CBV during the 6 hours after the end of insult.
The CBV decreased rapidly in the 2 histologically undamaged piglets and was reduced by 2 mL/100 g or more after 6 hours. However, the CBV increased in the piglets that died. It increased temporarily but soon began to decrease in those that died early.
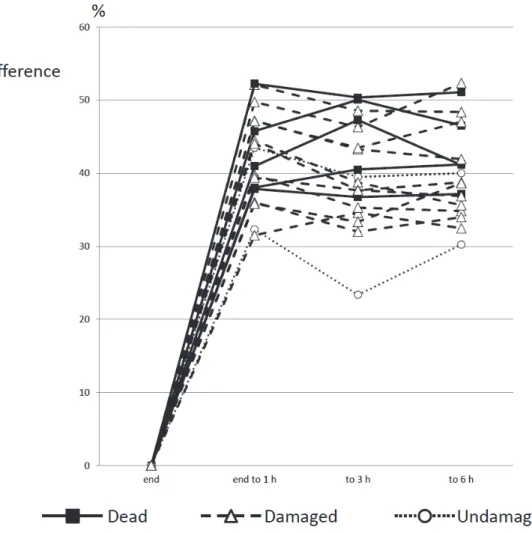
The ScO2 that was reduced by the HI insult increased from immediately after the beginning of resuscitation and returned to, or rose slightly above, the baseline, but no relationship was observed between the outcome and changes in the ScO2 (Figure 5).
Figure 5. Changes in the ScO2 over 6 hours after the end of insult.
The ScO2 was increased 1, 3, and 6 hours after the end of insult in all animals. No relationship between the pattern of increase and outcome was observed.
3.4 Correlations among the CBV, ScO2, and HIST scores
Figure 6 and Table 3 show the relationship of the change in the CBV with the HIST
positive and negative values, respectively. The figure shows the relationship between the changes in CBV and HIST scores at 1 hour after resuscitation. In the newborn piglets with positive CBV changes (increases) from immediately after resuscitation, high HIST scores and poor histological outcomes were shown. On the other hand, those with negative CBV changes (decreases) showed low HIST scores and mild tissue damage.
Figure 6. Relationship between the CBV change and histopathology score from the end of insult to 1 h after for white matter, gray matter, the hippocampus, and cerebellum.
The histopathology score and changes in the CBV in the gray matter, white matter, hippocampus, and cerebellum 1 hour after resuscitation are plotted along the vertical and horizontal axes, respectively. Spearman’s rank correlation coefficient was used, and the correlation coefficient r was calculated. In all tissues, the correlation coefficient was high 1 hour after resuscitation.
The correlation coefficient between the changes in CBV and HIST scores at 1, 3, and 6 hours after resuscitation in the gray matter were 0.9016 (p<0.0001), 0.9127 (p<0.0001), and 0.6907 (p=0.0089), respectively. Those in the white matter were 0.8579 (p=0.0002), 0.8993 (p<0.0001), and 0.6869 (p=0.0095), respectively. Strong correlations were observed both in the gray and white matter. The correlation coefficients at 1, 3, and 6 hours in the hippocampus were 0.7347 (p=0.0042), 0.8437 (p=0.0003), and 0.6621
(p=0.0137), respectively. Those in the cerebellum were 0.5504 (p=0.0513), 0.5867 (p=0.0351), and 0.4610 (p=0.1129), respectively. The correlations were still significant in the hippocampus and cerebellum, albeit weaker than those in the gray and white matter.
The above results can be summarized as follows: 1) A correlation was noted between the degree of CBV change and HIST score, but the correlation was strong 1 and 3 hours after resuscitation and was slightly weaker after 6 hours. 2) Moreover, the strength of the correlation was as follows: gray and white matter > hippocampus > cerebellum.
Similarly, regarding the ScO2 and HIST scores, no correlation was observed between the ScO2 value and histological outcome in any of the parts (Figure 7 and Table 4).
Figure 7. Relationship between the ScO2 change and histopathology score from the end of insult to 1 h after for white matter, gray matter, the hippocampus, and cerebellum.
The histopathology score and changes in the ScO2 in the gray matter, white matter, hippocampus and cerebellum at 1 hour after resuscitation are plotted along the vertical and horizontal axes. Spearman’s rank correlation coefficient was used, and the correlation coefficient r was calculated. Unlike the CBV, no correlation was observed.
4. Discussion
In this study, we revealed that an increased CBV measured by TRS within 6 hours after HI insult indicates more severe hisitological brain damage. However, there was no association between the ScO2 and histology in the matched time period.
4.1 Histological brain damage
There have been few reports on the severity or sites of impairment of cerebral circulation and brain tissue caused by HI insult. Williams et al.25 studied EEG and tissue damage by changing the duration of ischemia due to cord occlusion in sheep fetuses. With the prolongation of ischemia, the damaged area of brain tissue widened, and the duration of suppression of EEG activities extended. The parasagittal cortex was the first site to be damaged. In addition, using sheep fetuses, damage to cerebellar tissue due to restriction of uterine blood flow 26 and hippocampal tissue damage due to 10-min cord occlusion 27 have been reported. In our present experiment, marked cerebral tissue damage was noted, especially in the gray and white matter, and the findings resembled the results of Williams et al.25 with relatively stable and continuous HI insult.
4.2. Immediate measurement after HI insult
In the reported studies to date, the cerebral circulation in neonates with HIE has been evaluated mostly several to about 24 hours after birth and rarely from immediately to within several hours after resuscitation 6–8. It has been reported on the basis of measurement of the CBF by positron emission tomography in the neonatal period (1 or more days, frequently about 1 week, after birth) that the outcomes were
unfavorable as the CBF after asphyxia was higher, and that a high CBF was related to the degree of failure of autoregulation 28,29.
In the measurement of cerebral oxygenation by NIRS, an increase in the ScO2 after asphyxia has been shown to be associated with a poor outcome in both humans and animals. Kusaka et al.5 measured the ScO2 in newborn piglets exposed to hypoxic-ischemia, and reported that a high ScO2 during 6-60 hours after the end of insult was correlated with a poor outcome. The ScO2 showed a negative correlation with high-energy phosphate measured by phosphorus nuclear magnetic resonance spectroscopy (31P-MRS). This increase in the ScO2 was considered to indicate secondary energy failure. In humans, the accuracy of the prognosis has been reported to be improved by a combination of NIRS and aEEG, and Ancora et al. reported that the ScO2
at 6, 12, and 24 hours after birth was significantly higher in a poor than a favorable outcome group. Toet et al. also reported on the basis of measurements from 12 to 48 hours after birth that the outcomes were unfavorable in the high- ScO2 group and were related to abnormalities observed on aEEG 4,9. In all of these studies, the measurements were performed 6 or more hours after HI insult, and the results are considered to reflect changes in cerebral oxygenation associated with secondary energy failure. While earlier measurement is important for determining the therapeutic strategy, there have been few reports suggesting the usefulness of assessment of the cerebral circulation/oxygen metabolism within 6 hours.
Nakamura et al. 21 reported a correlation between changes in the CBV and duration of LAEEG after HI insult. Therefore, the cerebral circulation may be evaluated earlier by measuring the change in the CBV rather than the duration of LAEEG. Iwata et al.30
energy failure, that is, the latent phase, by magnetic resonance spectroscopy in newborn piglets, and reported that the latent phase was shorter and histological outcome was poorer with an increase in the severity of HI insult. However, the study showed the possibility of prolonging the latent phase and widening of the therapeutic window by the early introduction of therapeutic hypothermia. The duration of the latent phase depends on the severity of HI insult. In our experiment, the hemodynamics in an early stage of the latent phase were evaluated by measurement 6 hours after resuscitation.
Primary damage sustained early after birth may be estimated by evaluating changes in the cerebral circulation/oxygen metabolism very early after resuscitation. In a clinical setting, the severity or duration of HI in utero is not always clear. In our experiment (Figure 1), the CBV increased gradually from the beginning of hypoxic insult, reached a peak, and decreased gradually thereafter. In many of the newborn piglets in which the CBV was near the peak at the beginning of resuscitation, the CBV decreased rapidly after the beginning of resuscitation and the outcome was favorable.
On the other hand, when resuscitation was initiated after the CBV increased to a peak and then decreased to a level near the baseline, the CBV increased again, and the survival state or histological outcome was extremely poor. This increase in the CBV is considered to be closely related to the severity of cerebral vasoparalysis and venous congestion due to heart failure.
The hemodynamics markedly change immediately after the beginning of resuscitation, and the evaluation of these changes by NIRS is considered to be very meaningful. In this study, we evaluated the hemodynamics after 1, 3, and 6 hours, and found that the increases in the CBV after 1 and 3 hours were more closely correlated with the severity of histological damage. Therefore, it is necessary to undertake further
study of the changes in the CBV within 3 hours, namely, from immediately after the beginning or during resuscitation. Monitoring very early changes in the CBV from immediately after birth of asphyxic neonates would help differentiate the severity of brain damage. As reports on changes in the cerebral circulation from immediately after birth and during resuscitation using NIRS have been increasing in number recently, vigilant and intensive evaluation using NIRS from immediately after birth is recommended for babies suspected of having been exposed to hypoxia in utero 31–34.
4.3 Limitations and future studies
In our newborn piglet model, data were obtained continuously during the hypoxic insult. Under these conditions, changes in the CBV from the end of HI insult to after 1 hour were most sensitively correlated with the histological outcome. In consideration of application to humans, however, there remain some clinical difficulties in consistently obtaining data from the moment of birth (from resuscitation) of an asphyxic neonate by attaching NIRS sensors at the bedside. Therefore, further analysis of detailed changes early after resuscitation based on animal experiments is necessary.
The relationships between an increase in the CBF and outcome that have been reported to date have mostly been those on secondary energy failure. However, the present study was focused on early changes in the CBV until 6 hours after birth, during which CBV changes are considered to reflect changes in the circulation due to hypoxia and the degree of vasoparalysis of the brain associated with primary damage. Since the time until secondary energy failure, namely, the latent phase, is considered to vary with the severity of insult, it is also considered significant to measure the CBV continuously
necessary to evaluate whether or not the CBV reflects the HIST score even with therapeutic intervention such as hypothermia and medication. Moreover, while the relationship with the CBF or cerebral metabolic rate of oxygen was not evaluated, these parameters are also important and must be evaluated in future studies. Furthermore, brain damage due to HI insult was evaluated in the present study, but separate evaluations regarding neonatal encephalopathy due to causes other than hypoxia-ischemia such as infection and hypoglycemia are also necessary.
5. Conclusion
An increase in the CBV immediately after HI insult predicts severe histological brain damage. Therefore, measurement of the CBV from immediately after resuscitation is useful for the neurological prognosis.
<Acknowledgement>
This study was carried out with Grants-in-Aid for Scientific Research (C) 22591201, 25461645, 25461646, 25461647, and 000243759, Grants-in-Aid for Young Scientists (B) 26860847, 26860846, 25860911, and 25860866, and a Grant-in-Aid for Scientific Research on Innovative Areas (Research in a proposed research area) B0124119004, Kagawa University Faculty of Medicine School of Medicine Alumni Association Sanjukai Research Aid 21-1, 25-2 and the 22nd Research Aid for Pediatrics (Mother and Child Health Foundation).
The cooperation of students of Kagawa University Faculty of Medicine School of Medicine and School of Nursing in the animal experiments is sincerely appreciated.
References
1. Azzopardi, D. V. et al. Moderate Hypothermia to Treat Perinatal Asphyxial
Encephalopathy. N. Engl. J. Med. 361, 1349–1358 (2009).
2. Gluckman, P. D. et al. Selective head cooling with mild systemic hypothermia after
neonatal encephalopathy: multicentre randomised trial. The Lancet 365, 663–670
(2005).
3. Shankaran, S. et al. Whole-Body Hypothermia for Neonates with Hypoxic–Ischemic
Encephalopathy. N. Engl. J. Med. 353, 1574–1584 (2005).
4. Ancora, G. et al. Early predictors of short term neurodevelopmental outcome in
asphyxiated cooled infants. A combined brain amplitude integrated
electroencephalography and near infrared spectroscopy study. Brain Dev. 35, 26–31
(2013).
5. Kusaka, T. et al. Relationship Between Cerebral Oxygenation and Phosphorylation
Potential During Secondary Energy Failure in Hypoxic-Ischemic Newborn Piglets.
Pediatr. Res. 65, 317–322 (2009).
6. Marks, K. A. et al. Delayed Vasodilation and Altered Oxygenation after Cerebral
Ischemia in Fetal Sheep. Pediatr. Res. 39, 48–54 (1996).
7. Meek, J. H. et al. Abnormal cerebral haemodynamics in perinatally asphyxiated
neonates related to outcome. Arch. Dis. Child. - Fetal Neonatal Ed. 81, F110–F115
(1999).
8. Pryds, O., Greisen, G., Lou, H. & Friis-Hansen, B. Vasoparalysis associated with
brain damage in asphyxiated term infants. J. Pediatr. 117, 119–125 (1990).
9. Toet, M. C. Cerebral Oxygenation and Electrical Activity After Birth Asphyxia:
Their Relation to Outcome. PEDIATRICS 117, 333–339 (2006).
10. Gunn, A. & Bennet, L. Timing of injury in the fetus and neonate. [Miscellaneous
Article]. Curr. Opin. Obstet. Gynecol. April 2008 20, 175–181 (2008).
11. Hellström-Westas, L., Rosen, I. & Svenningsen, N. W. Predictive value of early
continuous amplitude integrated EEG recordings on outcome after severe birth
asphyxia in full term infants. Arch. Dis. Child.-Fetal Neonatal Ed. 72, F34–F38
(1995).
12. Shankaran, S. et al. Predictive Value of an Early Amplitude Integrated
Electroencephalogram and Neurologic Examination. PEDIATRICS 128, e112–e120
(2011).
13. Toet, M. C., Hellström-Westas, L., Groenendaal, F., Eken, P. & De Vries, L. S.
Amplitude integrated EEG 3 and 6 hours after birth in full term neonates with
hypoxic–ischaemic encephalopathy. Arch. Dis. Child.-Fetal Neonatal Ed. 81,
F19–F23 (1999).
14. Van Bel, F. et al. Changes in Cerebral Hemodynamics and Oxygenation in the First
24 Hours After Birth Asphyxia. Pediatrics 92, 365–372 (1993).
15. Nakamura, S. et al. Cerebral blood volume combined with amplitude-integrated
EEG can be a suitable guide to control hypoxic/ischemic insult in a piglet model.
Brain Dev. 35, 614–625 (2013).
16. Ijichi, S. et al. Quantification of cerebral hemoglobin as a function of oxygenation
using near-infrared time-resolved spectroscopy in a piglet model of hypoxia. J.
Biomed. Opt. 10, 0240261–0240269 (2005).
17. Ijichi, S. et al. Developmental Changes of Optical Properties in Neonates
Determined by Near-Infrared Time-Resolved Spectroscopy. Pediatr. Res. 58,
568–573 (2005).
18. Hielscher, A. H., Liu, H., Chance, B., Tittel, F. K. & Jacques, S. L. Time-resolved
photon emission from layered turbid media. Appl. Opt. 35, 719–728 (1996).
19. Hoshi, Y. Towards the next generation of near-infrared spectroscopy. Philos. Trans.
R. Soc. Lond. Math. Phys. Eng. Sci. 369, 4425–4439 (2011).
20. Sato, C., Shimada, M., Yamada, Y. & Hoshi, Y. Extraction of depth-dependent
signals from time-resolved reflectance in layered turbid media. J. Biomed. Opt. 10,
064008–064008–11 (2005).
21. Nakamura, S. et al. Relationship between early changes in cerebral blood volume
and electrocortical activity after hypoxic–ischemic insult in newborn piglets. Brain
Dev. 36, 563–571 (2014).
22. Thoresen, M. et al. A piglet survival model of posthypoxic encephalopathy. Pediatr.
Res. 40, 738–748 (1996).
23. Brierley, J. B., Brown, A. W. & Meldrum, B. S. The nature and time course of the
neuronal alterations resulting from oligaemia and hypoglycaemia in the brain of
Macaca mulatta. Brain Res. 25, 483–499 (1971).
24. Løberg, E. M., Hassel, B., Fonnum, F. & Torvik, A. Early entry of plasma proteins
into damaged neurons in brain infarcts. An immunohistochemical study on
experimental animals. APMIS Acta Pathol. Microbiol. Immunol. Scand. 102,
771–776 (1994).
25. Williams, C. E., Gunn, A. J., Mallard, C. & Gluckman, P. D. Outcome after ischemia
in the developing sheep brain: An electroencephalographic and histological study.
Ann. Neurol. 31, 14–21 (1992).
26. De Haan, H. H., Van Reempts, J. L., Vles, J. S., de Haan, J. & Hasaart, T. H. Effects
of asphyxia on the fetal lamb brain. Am. J. Obstet. Gynecol. 169, 1493–1501 (1993).
27. Mallard, E. C., Gunn, A. J., Williams, C. E., Johnston, B. M. & Gluckman, P. D.
Transient umbilical cord occlusion causes hippocampal damage in the fetal sheep.
Am. J. Obstet. Gynecol. 167, 1423–1430 (1992).
28. Altman, D. I. et al. Cerebral blood flow requirement for brain viability in newborn
infants is lower than in adults. Ann. Neurol. 24, 218–226 (1988).
29. Rosenbaum, J. L., Almli, C. R., Yundt, K. D., Altman, D. I. & Powers, W. J. Higher
neonatal cerebral blood flow correlates with worse childhood neurologic outcome.
Neurology 49, 1035–1041 (1997).
30. Iwata, O. et al. ‘Therapeutic time window’ duration decreases with increasing
severity of cerebral hypoxia–ischaemia under normothermia and delayed
hypothermia in newborn piglets. Brain Res. 1154, 173–180 (2007).
31. Binder, C. et al. Cerebral and Peripheral Regional Oxygen Saturation during
Postnatal Transition in Preterm Neonates. J. Pediatr. 163, 394–399 (2013).
32. Isobe, K. et al. Measurement of cerebral oxygenation in neonates after vaginal
delivery and cesarean section using full-spectrum near infrared spectroscopy. Comp.
33. Pichler, G. et al. aEEG and NIRS during transition and resuscitation after birth:
Promising additional tools; an observational study. Resuscitation 84, 974–978
(2013).
34. Pichler, G. et al. Reference Ranges for Regional Cerebral Tissue Oxygen Saturation
and Fractional Oxygen Extraction in Neonates during Immediate Transition after
Birth. J. Pediatr. 163, 1558–1563 (2013).