24
Original Article
Fibroblast and osteoblast differentiation characteristics of
periosteum-derived cells in mouse calvaria
Motoi MIURA, Hidemi NAKATA, Shohei KASUGAI, Shinji KURODA
Department of Oral Implantology and Regenerative Dental Medicine, Division of Oral Health Sciences, Graduate School of Medical and Dental Sciences, Tokyo Medical and Dental University, 1-5-45 Yushima, Bunkyo-ku, Tokyo 113-8510, Japan
Corresponding Author: Shinji KURODA e-mail: [email protected]
Accepted for publication Jan 17, 2020
Abstract
Objective: Periosteum is considered to be involved in maintenance and regeneration of the bone and gingiva. Here, we investigated whether periosteum-derived cells (PDCs) display the ability of gingival fibroblast differentiation and osteoblast differentiation, and examined their characteristics of fibrogenesis compared with that of bone marrow cells (BMCs).
Methods: PDCs and BMCs were prepared from skull periosteum and bone marrow of femurs in 4-week-old female ICR mice and cultured in growth medium (D) supplemented with fibrogenic (F) or osteogeneic (O) medium for 3 weeks, followed by additional subtreatments with F or O for 2 weeks. Cells were also cultured with SIS3, a Smad3 phosphorylation inhibitor, followed by TGF-β treatment. Gene and protein expressions related to fibrogenic and osteogenic differentiation were evaluated with RT-PCR and western blot and immunostaining, respectively.
Results: Both cells showed ALP activity after osteogenic induction, with PDCs showing increased ALP activity by sub-treatment of D-O and F-O, but not with BMCs. PDCs showed higher gene expression of Runx2, Fgfr1, and α-SMA compared with BMCs in osteogenic culture and after sub-treatment with F. Furthermore, Fgfr1 gene expression was stronger in PDCs than in BMCs after inhibiting Smad3 phosphorylation. Notably, TGF-β treatment stimulated or recovered the expression of S100A4 and vimentin, even after inhibition of Smad3 phosphorylation in BMCs, but not in PDCs.
Conclusion: PDCs might have potential of both osteogenic and fibrogenic differentiation. Furthermore, TGF-β signaling could occur without Smad3 phosphorylation in PDCs, indicating presence of a non-canonical signal transcription factor in PDCs.
Journal of Bio-Integration 10 (1): 24 – 46, 2020 Keywords
Periosteum, bone marrow, Smad3 inhibitor, transforming growth factor beta, cell signaling
Introduction
Periosteum, a thin tissue that covers the outer surface of bone, is a bi-layered membrane consisting of a fibrous and a cambium layer. The fibrous layer, which is the outer layer, consists mostly of collagen and mainly serves a mechanical role 1, 2). The innermost layer, which is the
cambium layer overlaying the bone surface, consists mostly of progenitor cells for building and repairing bone 3, 4). These cells express a number of stem cell-related antigens such as ALCAM(+), SH2(+), SH3(+), CD44(+) and CD90(+)5). There are many reports demonstrating the potential of peri-osteum-derived cells
25
(PDCs) to differentiate into chondrocytes and osteocytes 6). CD90(+) is expressed in osteoblast lineage cells, and is involved in ossification 7). It has been reported that osteogenic potential of CD90(+) increases the bone formation ability of human adipose-derived stromal cells 8) and murine adipose-derived stem cells 9). Furthermore, Kim et al demonstrated higher proliferative capacity and osteogenic potential of PDCs sorted with CD90 than those of unsorted PDCs, in vivo and in vitro10).Alveolar bone, a part of the jaw, is covered by periosteum, which is directly connected to gingiva, an epithelial tissue, without being mediated by muscles and other connective tissues. Being in between the alveolar bone and gingiva, the periosteum is possibly essential for maintenance and regeneration of the bone and gingiva. This is supported by the observation that incomplete regeneration of the alveolar ridge is sometimes observed in tooth extraction sockets, often with incomplete regeneration of the covering gingiva, under which the periosteum remains compromised, represented by “dry socket” 11-13). Therefore, it is assumed that the periosteal membrane on alveolar bone plays an essential role in the recovery of both the bone underneath and the gingiva above the membrane. Moreover, gingival wound repair, mostly due to gingival fibroblast regeneration, may precede alveolar ridge preservation for sufficient alveolar bone healing, since ugly scar on gingiva often results in insufficient ridge preservation.
In this study, we hypothesized that the PDCs have the reciprocal ability of gingival fibroblast differentiation and osteoblast differentiation, and then examined their characteristics of fibro-genesis compared with that of bone marrow cells (BMCs) in vitro.
Materials and Method
The institutional animal care and use committee of Tokyo Medical and Dental
University approved the protocol design and procedures (approval #, 0170362A).
Extraction of PDCs and BMCs
Skulls with the periosteum from nine 4-week-old female ICR mice were collected after pentobarbital sodium euthanasia. After trimming the skulls to 10 × 10 mm2 in size, the periosteum was peeled off the bone. The periosteum was cultivated in DMEM (containing 4.5 g/l glucose and 0.584 g/l L-glutamine; Sigma-Aldrich), supplemented with 10% fetal bovine serum (FBS; Sigma-Aldrich) and 1% penicillin/streptomycin (Sigma-Aldrich) and with dissolved 0.4 g of gelatin (low endotoxin gelatin; Nippi Co., Yokohama, Japan), as described pre-viously 10).
Mouse BMCs were flushed out from femurs using a 27 G needle and pelleted quickly by centrifugation at 1,000× g for 5 min; they were then washed with phosphate buffered saline (PBS) and centrifuged again. The harvested cells were cultured in DMEM supplemented with 10% FBS and 1% penicillin/ streptomycin.
All cells were continuously cultured at 37°C in a humidified atmosphere of 95% air and 5% CO2 and identically passaged for 3rd or 4th generation.
Analysis of osteogenic potential
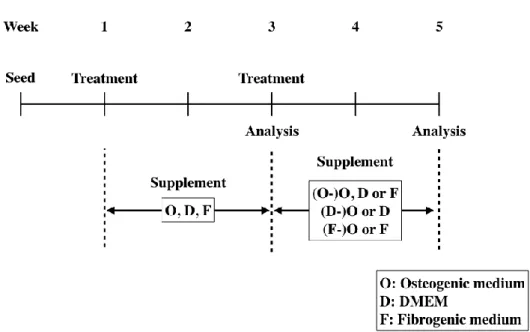
Cells were seeded into 24 well plates as the cell density of 0.1×10⁶ cells/well and cultured in DMEM. At 1 week of culture in DMEM, cells were divided into three culture medium treatments: continuous DMEM (D: growth medium), DMEM supplemented with 10 ng/mL TGF-β1 (763104,Bio Legend) (F: fibrogenic medium) 14), DMEM supple-mented with 10−8 M dexamethasone, 10 mM β-glycerophosphate (G-9891, Sigma-Aldrich), and 50 ng/mL ascorbic acid (013-12061, Wako Chemical) (O: osteogenic medium). The cells were cultured for two weeks in each culture medium. Then, the D and F treatments were further followed by two sub
26
treatments, respectively: D-to-D and F-to-F (D-D and F-to-F-F-to-F), and D-to-O and F-to-F-to-O (D-O and F-O). The treatment O was subsequently carried into three subtreatments: O-to-O (O-O), O-to-D (O-D) and O-to-F (O-F). Then, all cells were further cultured for 2 weeks (Fig. 1).
Fig. 1 Experimental procedure. Osteogenic and fibrogenic differentiation
Alkaline phosphatase (ALP)-positive cell staining
The cells were stained at week 3 and 5 using TRAP/ALP Staining Kit (Wako Co., Japan). Cells were washed twice with PBS and fixed in 3.7% formalin for 10 min. Fixed cells were then rinsed with PBS twice and incubated in 1 mL staining solution at 37°C for 20 min to identify ALP-positive (blue) cells. Cells were then washed with PBS to stop the staining reaction. Digital images were captured using a Biozero BZ-8000 microscope (Keyence, Japan).
ALP activity assay
The cells were assayed for ALP activity at weeks 3 and 5. The cells were washed twice with PBS. The ALP activity was measured as the release of p-nitrophenol from p-nitrophenylphosphate, pH 9.8, by optical density analysis at 405 nm on a multilabel counter (Wallac 1420 ARVO MX, Perkin Elmer, USA) using LabAssay ALP (Wako, Japan).
Alizarin red S staining
Mineralized nodules were stained at weeks 3 and 5 of culture. The staining solution was prepared by dissolving alizarin red S (1%) in 1:100 distilled water, followed by filtration. The cells were washed twice with PBS and immersed in 10% formalin for 10 min. After rinsing in water, the cells were incubated with 500 μL of alizarin red S per well for 10 min until the mineralized nodules were stained red. The reactions were terminated by washing with water to remove excessive staining precipitate and reagents. Digital images were captured using a light microscope (Biozero BZ-8000; Keyence, Japan). For quantification of the staining, nodules were destained using 10% cetylpyridinium chloride (CPC, C0732- 100G; Sigma-Aldrich, USA) in 10 mM sodium phosphate, pH 7.0, for 15 min at room temperature. Aliquots of extracts were diluted 10-fold in 10% CPC solution, and the concentration of alizarin red S was determined by measuring the absorbance at 560 nm on a multilabel
27
reader (2030 ARVO X5, Perkin Elmer, Japan).Real time reverse transcription poly-merase chain reaction (RT-PCR)
The cells were collected to isolate total RNA by TRIzol reagent (Life Techno-logies, USA). cDNA was synthesized using the SuperScript IV VILO (Thermo Fischer Scientific, USA), according to manufacturer’s instructions. Real-time RT-PCR was performed on a 7300 real-time PCR system (Life Technologies, USA) to analyze the expression levels of transcription factors related to osteoblast and fibroblast differentiation.
The primer sets were as the following.
runt-related transcription factor 2 (Runx2) Sense primer: 5'-tctggccttccactctcagt-3' Antisense primer: 5'-gactggcggggtgtaagtaa-3' Osterix (OSX) Sense primer: 5'-cccacctaacaggaggattt-3' Antisense primer: 5'-cactggaatggagtgaaacc-3' Fibroblast growth factor receptor 1 (Fgfr1)
Sense primer:
5'-aagacacagacacccgccgc-3' Antisense primer:
5'-tgagcgtggtctgccttcgc-3'
alpha-smooth muscle actin(α-SMA) Sense primer: 5'-tgcttcctcctcctcctttg-3' Antisense primer: 5'-acacccttggcttcctcatc-3' dehydrogenase (GAPDH) Sense primer: 5'-acccagaagactgtggatgg-3' Antisense primer: 5'-cacattgggggtaggaacac-3'.
Gene expression levels were norma-lized to GAPDH within the same sample using formula: target amount = 2-ΔCT and then this value was further divided with the values of the control group.
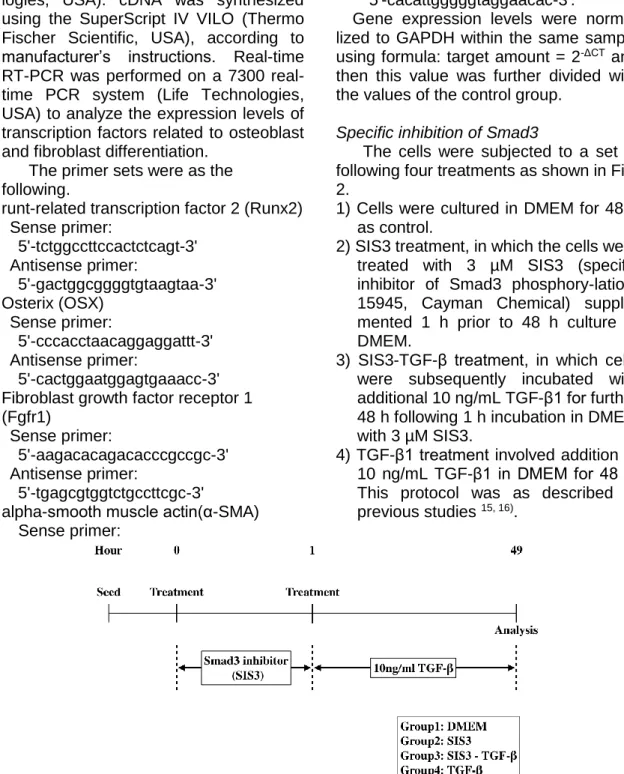
Specific inhibition of Smad3
The cells were subjected to a set of following four treatments as shown in Fig. 2.
1) Cells were cultured in DMEM for 48 h as control.
2) SIS3 treatment, in which the cells were treated with 3 µM SIS3 (specific inhibitor of Smad3 phosphory-lation, 15945, Cayman Chemical) supple-mented 1 h prior to 48 h culture in DMEM.
3) SIS3-TGF-β treatment, in which cells were subsequently incubated with additional 10 ng/mL TGF-β1 for further 48 h following 1 h incubation in DMEM with 3 µM SIS3.
4) TGF-β1 treatment involved addition of 10 ng/mL TGF-β1 in DMEM for 48 h. This protocol was as described in previous studies 15, 16).
28
Immunofluorescence
The cells were fixed in 4% paraformaldehyde at room temperature for 10 min and washed 2 times in PBS. The samples were permeabilized with 0.2% Triton X-100 for 10 min at room temperature, then washed with PBS. Following incubation with blocking solution (5% skim milk, Morinaga, Japan) for 30 min, the cells were incubated at room temperature for 1 h with 200 µL diluted primary antibody mixture [Anti-Vimentin (dilution, 1:250; ab92547; Abcam, Cambridge, MA, USA), Anti-S100A4 (dilution, 1:250; ab197896)]. The following day, after washing with PBS, secondary antibodies labeled with Goat Anti-Rabbit IgG H&L conjugated with Alexa Fluor® 488 (dilution, 1:200; ab150077) were added to each slide and the slides were incubated at room temperature in a wet dark box for 30 min. Cell nuclei were counterstained with 4’,6-diamidino-2-phenylindole (DAPI). Fluore-scent images were obtained with a super resolution laser confocal microscope (BZ-X-700; Keyence, USA). Fluorescent intensities of Alexa Fluor® 488 and DAPI were measured and expressed as ratio of Alexa Fluor® 488 fluorescence to DAPI fluorescence.
Western blotting
Western blot analysis was used to investigate the correlation between expression of Smad3 (dilution, 1:2000; ab40854), phosphorylated Smad3 (p-Smad3) (dilution, 1:2000; ab52903) or GAPDH (dilution, 1:10000; ab181602) in each group. The cells were lysed by centrifugation and the total lysate was used for the analysis. The lysate was dissolved in 20 µL running buffer, denatured at 70°C for 10 min, fractionated on 4–12% NuPAGE Bis-Tris gels (Invitrogen, USA), and transferred to PVDF membranes. Following incubation
with polyclonal antibodies and then anti-rabbit IgG secondary antibodies, the protein complexes were detected with the Chromogenic Western Blot Immunodetection Kit (WesternBreeze; Invitrogen) according to the manufacturer’s instructions. Intensities of the developed bands were calibrated by image analyzing software (Image J 1.52k; NIH) and expressed in ratios.
Statistical analysis
Statistical analysis was performed using the statistics software package 14.0 SPSS for Windows (SPSS, Inc.). Results are expressed as mean ± standard deviation. The differences in the means were analyzed by Student’s t-test or Tukey, and a p-value < 0.05 was considered statistically significant. Results
ALP staining and ALP activity
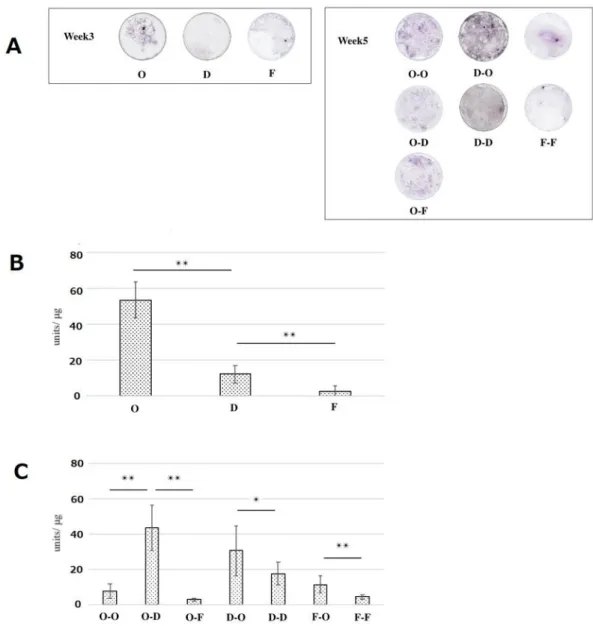
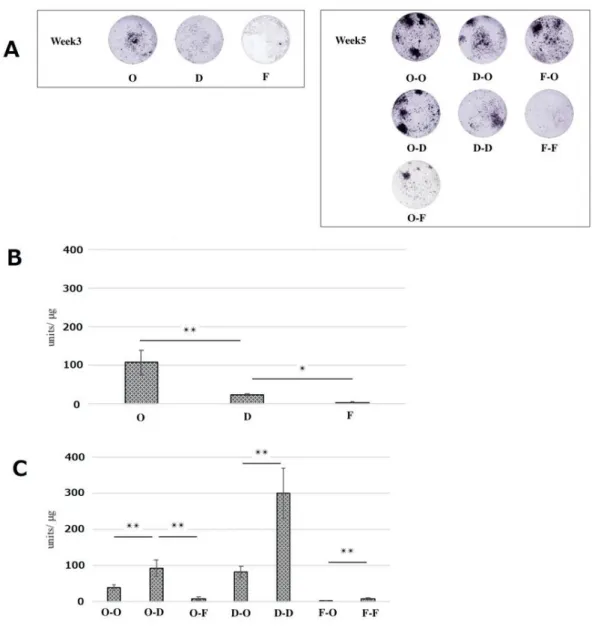
ALP-positive cells were visualized with nitro blue tetrazolium chloride. Intense staining was obvious in both PDCs and BMCs after osteogenic induction (Fig. 3A, Fig. 4A), which was supported by the ALP activity with a peak at 3 weeks. Notably, as demonstrated in the subtreatments of D-O and F-O of PDCs, the cells likely reobtained ALP activity from D-D and F-F at 5 weeks, respectively, even after the initial fibrogenic culture (Fig. 3B, C).On the other hand, BMCs showed decreased ALP activity by subtreatment of D-O and F-O (Fig. 4B, C).
Mineralized nodule formation
In the PDC culture, alizarin red staining was weak; however, it was clearly observed in all patterns of the osteogenic treatments (Fig. 5). BMCs showed more mineralized nodule formation at 5 weeks through all osteogenic treatment patterns (Fig. 6).
29
Figure 3. Alkaline phosphatase (ALP) staining (A) and ALP activity of periosteum-derived cells (PDCs) (B and C).
Quantitative ALP activity was normalized to cell viability in each sample. Data are expressed as mean ± SD (n = 4). **p < 0.01; *p < 0.05.
30
Figure 4. Alkaline phosphatase (ALP) staining (A) and ALP activity of bone marrow-derived cells (BMCs) (B and C).
Quantitative ALP activity was normalized to cell viability in each sample. Data are expressed as mean ± SD (n = 4). **p < 0.01; *p < 0.05.
31
Figure 5. Alizarin red S staining and mineralized nodule formation of periosteum-derived cells (PDCs). D: DMEM. O: Osteogenic medium. F: Fibrogenic medium. Mineralized nodules were observed by Alizarin red S staining (A). Quantitative analysis of Alizarin red S staining by measuring the absorbance of dissolved Alizarin red S at 560 nm (B and C). The results are expressed as mean ± SD (n = 4). **p < 0.01; *p < 0.05.
32
Figure 6. Alizarin red S staining and mineralized nodule formation of bone marrow-derived cells (BMCs). **p < 0.01; *p < 0.05. D: DMEM. O: Osteogenic medium. F: Fibrogenic medium. Mineralized nodules were observed by Alizarin red S staining (A). Quantitative analysis of Alizarin red S staining by measuring the absorbance of dissolved Alizarin red S at 560 nm (B and C). The results are expressed as mean ± SD (n = 4). **p < 0.01; *p < 0.05.
33
Osteogenic or fibrogenic differentiation
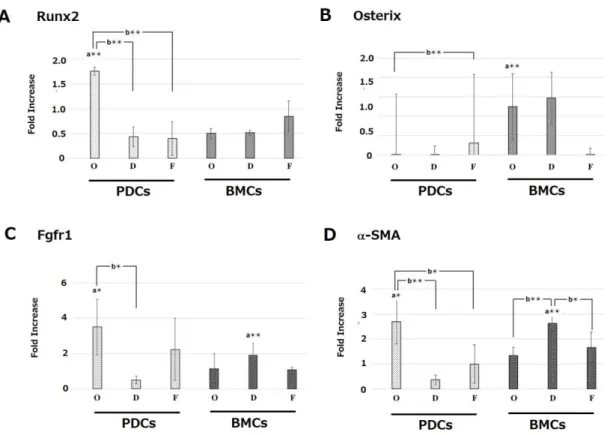
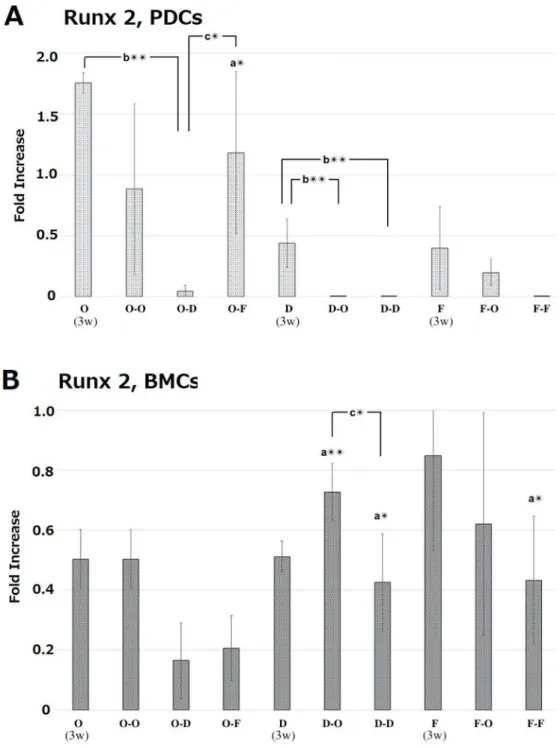
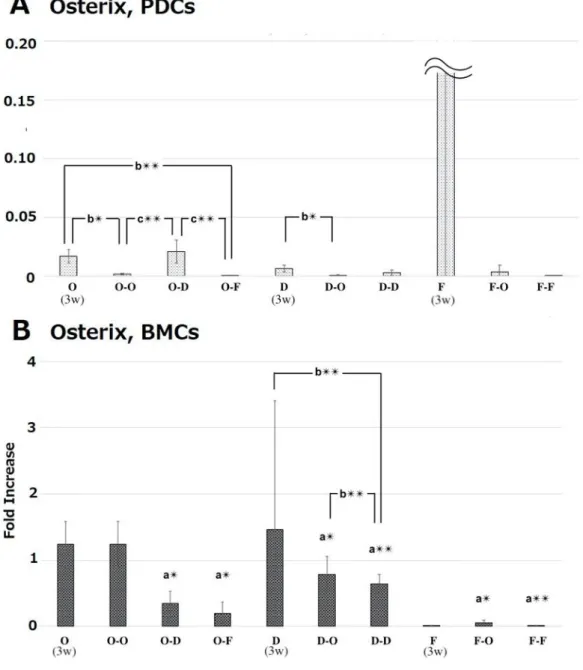
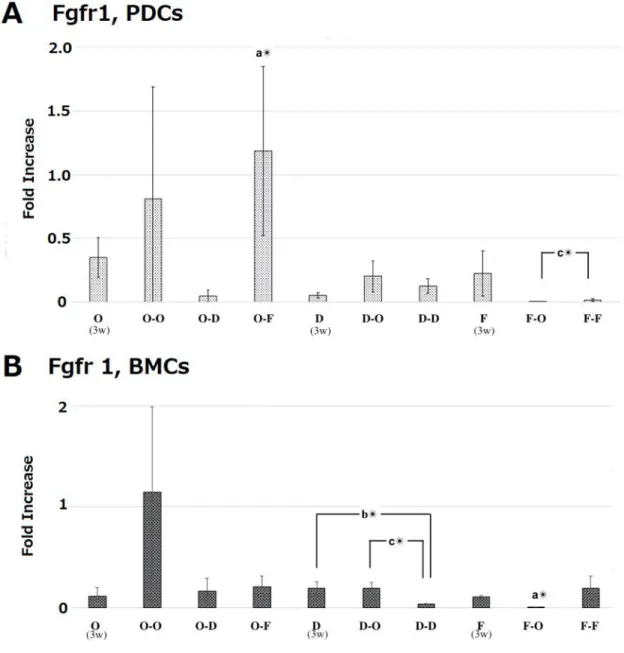
PDCs showed higher gene expression of Runx2, Fgfr1, and α-SMA compared with BMCs in the initial osteogenic culture at 3 weeks (Fig. 7). Interestingly, the high gene expression of Runx2 and Fgfr1 was still maintained following sub treatment of O-F at 5 weeks (Fig. 8 and 10). Osterix gene expression
was increased by the initial osteogenic treatment in BMCs than in PDCs at 3 weeks (Fig. 7). Furthermore, the high gene expression compared with PDCs was maintained by all subtreatments at 5 weeks, although the actual expression levels had reduced
(Fig. 9).
Figure 7. mRNA expression levels of Runx2 (A), Osterix (B), Fgfr1 (C) and α-SMA (D) at 3 weeks. PDCs: periosteum-derived cells. BMCs: bone marrow derived-cells. PDCs and BMCs were treated with the following different culture mediums. D: DMEM. O: Osteogenic medium. F: Fibrogenic medium. Then, the mRNA expression levels were measured with RT-PCR at 3 weeks. Expression levels were normalized to GAPDH expression and expressed as relative difference. Data are expressed as mean ± SD (n = 4). a: periosteum-derived cells (PDCs) vs. bone marrow cells (BMCs). b: Comparison with treatments at week3. **p < 0.01; *p < 0.05.
34
Fig. 8 mRNA expression levels of Runx2 in periosteum-derived cells (PDCs) and in bone marrow derived-cells (BMCs) at 5 weeks. As shown in Fig.1, the cells were treated with osteogenic medium (O) or DMEM (D) or fibrogenic medium (F) for 3 weeks. Then, the cells were additionally treated with one of these media for 2 weeks. At 5 weeks mRNA expression levels were measured with RT-PCR. mRNA expression levels were normalized to GAPDH expression and expressed as relative difference. Data are expressed as mean ± SD (n = 4). a: periosteum-derived cells (PDCs) vs. bone marrow cells (BMCs). b: O vs. O-O, O-D, O-F; D vs. D-O and D-D; F vs. F-O and F-F. c: Comparison with treatments at week5. **p < 0.01; *p < 0.05.
35
Fig. 9 mRNA expression levels of Runx2 in periosteum-derived cells (PDCs) and in bone marrow derived-cells (BMCs) at 5 weeks. As shown in Fig.1, the cells were treated with osteogenic medium (O) or DMEM (D) or fibrogenic medium (F) for 3 weeks. Then, the cells were additionally treated with either one of these media for 2 weeks. At 5 weeks mRNA expression levels were measured with RT-PCR. mRNA expression levels were normalized to GAPDH expression and expressed as relative difference. Data are expressed as mean ± SD (n = 4). a: periosteum-derived cells (PDCs) vs. bone marrow cells (BMCs). b: O vs. O-O, O-D, O-F; D vs. D-O and D-D; F vs. F-O and F-F. c: Comparison with treatments at week5. **p < 0.01; *p < 0.05.
36
Fig. 10 mRNA expression levels of Fgfr 1 in periosteum-derived cells (PDCs) and in bone marrow derived-cells (BMCs) at 5 weeks. As shown in Fig.1, the cells were treated with osteogenic medium (O) or DMEM (D) or fibrogenic medium (F) for 3 weeks. Then, the cells were additionally treated with either one of these media for 2 weeks. At 5 weeks mRNA expression levels were measured with RT-PCR. mRNA expression levels were normalized to GAPDH expression and expressed as relative difference. Data are expressed as mean ± SD (n = 4). a: periosteum-derived cells (PDCs) vs. bone marrow cells (BMCs). b: O vs. O-O, O-D, O-F; D vs. D-O and D-D; F vs. F-O and F-F. c: Comparison with treatments at week5. **p < 0.01; *p < 0.05.
37
Fig. 11 mRNA expression levels of -SMA in periosteum-derived cells (PDCs) and in bone marrow derived-cells (BMCs) at 5 weeks. As shown in Fig.1, the cells were treated with osteogenic medium (O) or DMEM (D) or fibrogenic medium (F) for 3 weeks. Then, the cells were additionally treated with either one of these media for 2 weeks. At 5 weeks mRNA expression levels were measured with RT-PCR. mRNA expression levels were normalized to GAPDH expression and expressed as relative difference. Data are expressed as mean ± SD (n = 4). a: periosteum-derived cells (PDCs) vs. bone marrow cells (BMCs). b: O vs. O-O, O-D, O-F; D vs. D-O and D-D; F vs. F-O and F-F. c: Comparison with treatments at week5. **p < 0.01; *p < 0.05.
38
Inhibition of phosphorylated Smad3
Western blot analysis was performed for Smad3, p-Smad3, and GAPDH. The ratio of p-Smad3 over Smad3 was increased by TGF-β treatment and
decreased by SIS3 treatment in both cells. Although SIS3-TGF-β treatment recovered the ratio in BMCs, such recovery was not seen in PDCs (Fig 12).
Fig. 12 Western blot of Smad3, phospho-Smad 3 (p-Smad 3) and GAPDH (A) and ratio of p-Smad 3 to Smad 3 (B). Western blot was performed using their respective polyclonal antibodies. The intensities of the developed bands were semi-quantified by image analyzing software.
Runx2 gene expression was higher and not influenced by changes in Smad3 phosphorylation in the 48 h culture of BMCs compared with PDCs (Fig 13A). On the other hand, Osterix, Fgfr1 and α-SMA gene expression was detected to be
stronger in PDCs than in BMCs after change in Smad3 phosphorylation. (Fig. 13B, Fig. 14A and Fog. 14 B). Notably, the single treatment with SIS3 elevated Osterix and α-SMA (Fig 13B and Fig. 14 B)
39
Fig 13 mRNA expression levels of Runx 2 (A) and Osterix (B).
As shown in Fig. 2, periosteum derived cells (PDCs) and bone marrow derived cells (BMCs) were treated with Smad 3 inhibitor (SIS3) and/or TGF-. The mRNA levels of Runx2 and Osterix were normalized to GAPDH mRNA and are expressed as relative difference. Data are expressed as mean ± SD (n=4). a: periosteum-derived cells (PDCs) vs. bone marrow cells (BMCs). b: Comparison in the treatments. **p < 0.01; *p < 0.05.
40
Fig 14 mRNA expression levels of Fgfr1 (A) and -SMA (B).
As shown in Fig. 2, periosteum derived cells (PDCs) and bone marrow derived cells (BMCs) were treated with Smad 3 inhibitor (SIS3) and/or TGF-. The mRNA levels of Runx2 and Osterix were normalized to GAPDH mRNA and are expressed as relative difference. Data are expressed as mean ± SD (n=4). a: periosteum-derived cells (PDCs) vs. bone marrow cells (BMCs). b: Comparison in the treatments. **p < 0.01; *p < 0.05.
41
Immunofluorescence of S100A4 and vimentin
In PDCs, the S100A4 expression did not alter much, regardless of inhibition of Smad3 phosphorylation (Fig. 15 and 17). In contrast, S100A4 expression was
stimulated remarkably with TGF-β in BMCs; however, TGF-β treatment could not recover S100A4 expression that had been downregulated by blocking phosphorylation of Smad3 (Fig. 15 and 17).
Fig. 15 Immuno-fluorescence images of S100A4.
As shown in Fig. 2, periosteum derived cells (PDCs) and bone marrow derived cells (BMCs) were treated with Smad 3 inhibitor (SIS3) and/or TGF-S100A4 was observed in the cytoplasm (green). Cell nuclei were counterstained with DAPI (blue).
Fig. 16 Immuno-fluorescence images of Vimentin.
As shown in Fig. 2, periosteum derived cells (PDCs) and bone marrow derived cells (BMCs) were treated with Smad 3 inhibitor (SIS3) and/or TGF-Vimentin was observed in the cytoplasm (green). Cell nuclei were counterstained with DAPI (blue).
42
In PDCs vimentin expression did not change in all treatments (Fig. 16 and 17). On the other hand, TGF-β treatment prominently rescued vimentin expressionthat was inhibited by blocking phosphorylation of Smad3 in BMCs (Fig. 16 and 17).
Fig. 17 Quantitative data of immuno-fluorescence images of S100A4 and vimentin. Ratios of the fluorescence intensity of S100A4 or vimentin to the one of DAPI were presented.
Discussion
During alveolar ridge regeneration at the tooth extraction socket, gingival closure and granulation are the most indispensable to induce bony filling
underneath the healing soft tissue. The healing process is initiated by an inflammatory cascade, in which TGF-β stimulates macrophages to produce and secrete fibroblast growth factors (FGFs),
43
platelet-derived growth factor (PDGF), tumor necrosis factor alpha (TNF-α), and interleukin-1 (IL-1) 17). Generally, TGF-β induces α-SMA, which is involved in the process of granulation and fibrosis 18). Furthermore, it has been clarified that TGF-β is intimately associated with bone remodeling, which depends on osteoclastic bone resorption and osteoblastic bone formation 19). For executing this study, we assumed that alveolar periosteum might mediate and control alveolar bone and gingiva, not interfered by other soft tissues such as muscles and fat, and that the periosteum could contribute to healing the alveolar ridge by activating both bony regeneration and gingival maturation. Therefore, in the present study, PDCs were examined in comparison with BMCs for potential of osteogenic differentiation and gingiva-fibroblastic differentiation through changing the culture media and TGF-β supplementation.Periosteum was extracted by trimming and peeling it from mouse calvariae, which mimicked damaged periosteum during, for example, tooth extraction in clinical settings. Unquestionably, BMCs exhibited strong potential of osteoblast differentiation with elevated gene
expression of Osterix, except for fibrogenic culture after 3 weeks, and obvious mineralization at 5 weeks upon all subtreatments. In contrast, weak staining with Alizarin red S was detected in PDCs. However, PDCs showed higher gene expression of Runx2 (osteogenic marker), Fgfr1 (fibrogenic marker), and α-SMA (fibroblast-peculiar actin) compared with BMCs in the initial osteogenic culture at 3 weeks. Notably, Runx2 and Fgfr1 genes were still highly expressed in PDCs after subtreatment with the fibrogenic medium at 5 weeks. In contrast, Fgfr1 gene was not stimulated in BMCs in most medium treatments over time, suggesting that PDCs might have potential of both osteogenic and fibrogenic differentiation once the cells were cultured initially in the osteogenic medium (Fig. 18), although the critical gene for osteoblast differentiation, i.e. Osterix 20), showed weak induction after all subtreatments of PDCs during the 5-week-period. Notably, the initial fibrogenic culture condition did not induce the osteogenic markers, Runx2 and Osterix, in PDCs and weakened the fibrogenic genes, Ffgr1 and α-SMA, of them.
Fig. 18 Differentiation characteristics and presence of a non-canonical signal transcription factor in PDCs. Primary osteogenic stimulation might lead PDCs to possess biphasic differentiation ability for osteogenesis and fibrogenesis.
44
Smad3 is a target for phosphorylation in the intracellular canonical pathway of TGF-β signals 21-23). In this study, PDCs were treated in DMEM supplemented with SIS3, an inhibitor of Smad3 phosphorylation, which was followed by additional TGF-β treatment. It was demonstrated that the SIS3-mediated down-regulation of Smad3 phosphoryla-tion was not elevated by subsequent addition of TGF-β in PDCs, while it increased in BMCs. Similarly, immune-staining for S100A4, which is specific tofibrogenesis 24), and vimentin for mesen-chymal cells 25), indicated that TGF-β treatment stimulated or recovered the expression of the two proteins, even after inhibition of Smad3 phosphorylation in BMCs. On the other hand, such recovery or stimulation was not seen in PDCs. Together, this suggests that TGF-β signaling could occur without Smad3 phosphorylation, and suggests the existence of a non-canonical signal trans-cription factor other than Smad3 in PDCs (Fig. 19) 26-30).
Fig. 19 Differentiation characteristics and presence of a non-canonical signal transcription factor in PDCs. TGF-β signaling could occur without Smad3 phosphory-lation in PDCs.
In conclusion, it is likely that osteogenic stimulation might lead PDCs to possess biphasic differentiation ability for osteogenesis and fibrogenesis, where TGF-β, expressed in an early inflammatory phase 17), can contribute to bone remodeling 19). Kim et al. demonst-rated strong osteoblastic differentiation ability in CD90(+) population compared with CD90(-) cells of mouse PDCs 10). In the present study, although the PDCs were not sorted into several populations
by CD antigens, the results suggest the presence of an osteogenic population in the PDCs. The CD90(+) cells might be a candidate for differentiation into fibroblasts for gingival regeneration, and subsequently bone regeneration in tooth extraction sockets. Future studies are necessary to examine the alveolar periosteum and determine the roles of different CD antigen populations of PDCs to clarify the mechanism by which alveolar ridge can be preserved.
45
Conflicts of interestThe authors confirm that there are no conflicts of interest.
Acknowledgement
The authors acknowledge Michiko Suzuki of the Department of Oral Implantology and Regenerative Dental Medicine, Tokyo Medical and Dental University, Tokyo, Japan, for technical advice. This research was supported by the Japanese Society for the Promotion of Sciences Grant #17K11797.
Author Contributions
M.M., H.N., S.K., and S.K. conceived the ideas; M.M., H.N. and S.K. performed the experiments; M.M., H.N. and S.K. analyzed the data; M.M., H.N., S.K., and S.K. contributed to reagents/ materials/ analysis tools; M.M., H.N., S.K., and S.K. wrote the paper.
References
1. Allen, M.R., Burr, D.B. Human femoral neck has less cellular periosteum, and more mineralized periosteum, than femoral diaphyseal bone. Bone 36, 311-316, 2005 2. Ozaki, A., Tsunoda, M., Kinoshita, S.,
Saura, R.Role of fracture hematoma and periosteum during fracture healing in rats: interaction of fracture hematoma and the periosteum in the initial step of the healing process. J Orthop Sci 5, 64-70, 2000
3. Colnot, C. Skeletal cell fate decisions within periosteum and bone marrow during bone regeneration. J Bone Miner Res 24, 274-282, 2009
4. Zhang, X., Xie, C., Lin, A.S., Ito, H., Awad, H., Lieberman, J.R., Rubery, P.T., Schwarz, E.M., O'Keefe, R.J., Guldberg, R.E. Periosteal progenitor cell fate in segmental cortical bone graft transplantations: implications for functional tissue engineering. J Bone Miner Res 20, 2124-2137, 2005 5. Stich, S., Loch, A., Leinhase, I.,
Neumann, K., Kaps, C., Sittinger, M.,
Ringe, J. Human periosteum-derived progenitor cells express distinct chemokine receptors and migrate upon stimulation with CCL2, CCL25, CXCL8, CXCL12, and CXCL13. Eur J Cell Biol 87, 365-376, 2008
6. Hutmacher, D.W., Sittinger, M. Periosteal cells in bone tissue engineering. Tissue engineering 9 Suppl 1, S45-64, 2003
7. Takushima, A., Kitano, Y., Harii, K. Osteogenic potential of cultured periosteal cells in a distracted bone gap in rabbits. J Surg Res 78, 68-77, 1998
8. Chung, M.T., Liu, C., Hyun, J.S., Lo, D.D., Montoro, D.T., Hasegawa, M., Li, S., Sorkin, M., Rennert, R., Keeney, M., Yang, F., Quarto, N., Longaker, M.T., Wan, D.C. CD90 (Thy-1)-positive selection enhances osteogenic capacity of human adipose-derived stromal cells. Tissue Eng Part A 19, 989-997.
9. Yamamoto, M., Nakata, H., Hao, J., Chou, J., Kasugai, S., Kuroda, S. Osteogenic Potential of Mouse Adipose-Derived Stem Cells Sorted for CD90 and CD105 In Vitro. Stem Cells Int 2014, 576358, 2014
10. Kim, Y.K., Nakata, H., Yamamoto, M., Miyasaka, M., Kasugai, S., Kuroda, S. Osteogenic Potential of Mouse Periosteum-Derived Cells Sorted for CD90 In Vitro and In Vivo. Stem Cells Transl Med 5, 227-234, 2016
11. Blum, I.R. Contemporary views on dry socket (alveolar osteitis): a clinical appraisal of standardization, aetio-pathogenesis and management: a critical review. Int J Oral Maxillofac Surg 31, 309-317, 2002
12. Bowe, D.C., Rogers, S., Stassen, L.F., 2011. The management of dry socket/alveolar osteitis. J Ir Dent Assoc 57, 305-310, 2011
13. Mamoun, J. Dry Socket Etiology, Diagnosis, and Clinical Treatment Techniques. J Korean Assoc Oral Maxillofac Surg 44, 52-5, 2018. 14. Hiwatashi, N., Bing, R., Kraja, I.,
46
Branski, R.C. Mesenchymal stem cells have antifibrotic effects on transforming growth factor-beta1-stimulated vocal fold fibroblasts. Laryngoscope 127, E35-E41, 2017 15. Chen, C.A., Chang, J.M., Chang,E.E., Chen, H.C., Yang, Y.L. Crosstalk between transforming growth factor-beta1 and endoplasmic reticulum stress regulates alpha-smooth muscle cell actin expression in podocytes. Life Sci 209, 9-14, 2018 16. Wang, X., Gao, J.L., Zhao, M.M., Zhu,
H.X., Tian, Y.X., Li, R., Jiang, X.H., Yu, L., Tian, J.R., Cui, J.Z. Therapeutic effects of conditioned medium from bone marrow-derived mesenchymal stem cells on epithelial-mesenchymal transition in A549 cells. Int J Mol Med 41, 659-668, 2018
17. Cohen, N., Cohen-Lévy, J. Healing processes following tooth extraction in orthodontic cases. Journal of Dentofacial Anomalies and Orthodontics 17, 304-324, 2014 18. Roson, M.I., Cavallero, S., Della
Penna, S., Cao, G., Gorzalczany, S., Pandolfo, M., Kuprewicz, A., Canessa, O., Toblli, J.E., Fernandez, B.E. Acute sodium overload produces renal tubulointerstitial inflammation in normal rats. Kidney Int 70, 1439-1446, 2006
19. Tang, Y., Wu, X., Lei, W., Pang, L., Wan, C., Shi, Z., Zhao, L., Nagy, T.R., Peng, X., Hu, J., Feng, X., Van Hul, W., Wan, M., Cao, X. TGF-beta1-induced migration of bone mesenchymal stem cells couples bone resorption with formation. Nat Med 15, 757-765, 2009
20. Nakashima, K., Zhou, X., Kunkel, G., Zhang, Z., Deng, J.M., Behringer, R.R., de Crombrugghe, B. The novel zinc finger-containing transcription factor osterix is required for osteoblast differentiation and bone formation. Cell 108, 17-29, 2002 21. Nakao, A., Imamura, T.,
Souchelnytskyi, S., Kawabata, M.,
Ishisaki, A., Oeda, E., Tamaki, K., Hanai, J., Heldin, C.H., Miyazono, K., ten Dijke, P. TGF-beta receptor-mediated signalling through Smad2, Smad3 and Smad4. EMBO J 16, 5353-5362, 1997
22. Shi, Y., Massague, J., 2003. Mechanisms of TGF-beta signaling from cell membrane to the nucleus. Cell 113, 685-700, 2003
23. ten Dijke, P., Hill, C.S. New insights into TGF-beta-Smad signalling. Trends Biochem Sci 29, 265-273, 2004
24. Strutz, F., Okada, H., Lo, C.W., Danoff, T., Carone, R.L., Tomaszewski, J.E., Neilson, E.G. Identification and characterization of a fibroblast marker: FSP1. J Cell Biol 130, 393-405, 1995
25. Franke, W.W., Schmid, E., Osborn, M., Weber, K. Intermediate-sized filaments of human endothelial cells. J Cell Biol 81, 570-580, 1979
26. Heldin, C.H., Miyazono, K., ten Dijke, P. TGF-beta signalling from cell membrane to nucleus through SMAD proteins. Nature 390, 465-471. 27. Mulder, K.M. Role of Ras and Mapks
in TGF-beta signaling. Cytokine Growth Factor Rev 11, 23-35, 2000 28. Sakaguchi, M., Miyazaki, M.,
Sonegawa, H., Kashiwagi, M., Ohba, M., Kuroki, T., Namba, M., Huh, N.H. PKC alpha mediates TGF beta-induced growth inhibition of human keratinocytes via phosphorylation of S100C/A11. J Cell Biol 164, 979-984, 2004
29. Wang, L., Zhu, Y., Sharma, K. Transforming growth factor-beta1 stimulates protein kinase A in mesangial cells. J Biol Chem 273, 8522-8527, 1998
30. Yi, J.Y., Shin, I., Arteaga, C.L., Type I transforming growth factor beta receptor binds to and activates phosphatidylinositol 3-kinase. J Biol Chem 280, 10870-10876, 2005