Investigation of cathode catalyst degradation
under startup and shutdown process for FCV
A Doctoral Thesis
Presented to
Special Doctoral Program for Green Energy Conversion Science
and Technology
Interdisciplinary Graduate School of Medicine and Engineering
University of Yamanashi
March 2017
Contents
Chapter 1 General Introduction
1.1 Background ··· 1
1.2 Polymer Electrolyte Fuel Cells (PEFCs) ··· 4
1.3 Degradation of Pt/CB catalyst during FCVs operation ··· 8
1.4 Objective of This Research ··· 10
1.5 References for chapter 1 ··· 12
Chapter 2 Degradation of Pt catalysts supported on graphitized carbon black during gas-exchange startup operation similar to that used for fuel cell vehicles 2.1 Introduction ··· 14
2.2 Experimental 2.2.1 Preparation of CCMs. ··· 16
2.2.2 Procedure of CCMs evaluation for durability and electrochemical properties. ··· 17
2.2.3 Raman spectroscopy. ··· 20
2.2.4 TEM and STEM measurements. ··· 20
2.3 Results and Discussion
2.3.1 Measurements of the electrode potential during the air-SU cycling. ··· 22
2.3.2 Evaluations of Pt catalyst durability by electrochemical measurements. · 24 2.3.3 STEM examination of the catalysts: initial and after the durability evaluation. ··· 24
2.3.4 GIXD measurements of the catalysts: initial and after the durability evaluation. ··· 29
2.3.5 Raman spectroscopy measurements of the catalyst: initial condition and after the durability evaluation. ··· 32
2.3.6 Investigation of the Pt degradation in the inlet region. ··· 35
2.4 Conclusion ··· 40
2.5 References for chapter 2 ··· 41
Chapter 3 Degradation Mechanisms of Carbon Supports under Hydrogen Passivation Startup and Shutdown Process for PEFCs 3.1 Introduction ··· 44
3.2 Experimental 3.2.1 Preparation of catalyst-coated membranes (CCMs). ··· 46
3.2.2 Procedure of H2-SU/SD and experimental setup. ··· 47
3.2.3 Holding of the cathode potential in step 2 of the air-air cycles. ··· 49 3.2.4 Procedure of CCM evaluation for durability and electrochemical properties.
··· 49
3.3 Results and Discussion 3.3.1 Comparison of the extent of carbon oxidation during air-SU/SD and H2-SU/SD. ··· 50
3.3.2 Effect of presence of Pt catalyst on CO2 generation during H2-SU/SD cycling. ··· 56
3.3.3 Investigation of the timing of CO2 generation during H2-SU/SD cycling.58 3.3.4 Effect of Pt oxidation state on CO2 generation in the H2-SU/SD process.61 3.3.5 Mechanisms of the COR during the H2-SU/SD process. ··· 64
3.4 Conclusion ··· 69
3.5 References for chapter 3 ··· 70
Chapter 4 General Conclusions 4.1 General Conclusions ··· 72
4.2 References for chapter 4 ··· 77
List of publications ··· 78
Meeting abstracts ··· 79
- 1 -
Chapter 1
General Introduction
1. 1 Background
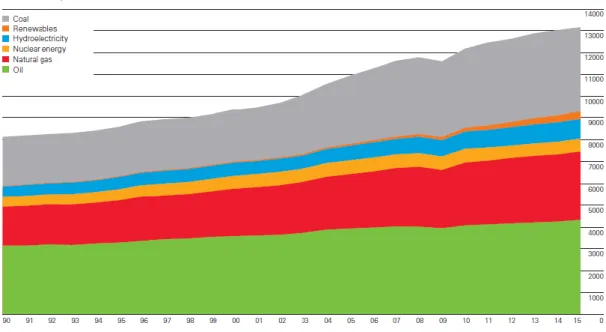
The world population is over 7.4 billions in 2016, and it is expected to continue increasing over the next few decades. As shown in Fig. 1-1,1 the consumption of the primary energy in the world is increasing with increasing the world population and changing our lifestyle to large-scale production and consumption. Amongst that, the ratio of the coal, natural gas and oil consumption is over 80%. The large amount of fossil energies consumption increases the CO2, SOX and NOX concentration in the
atmosphere, and leads environmental problems such as the global warming and the soil, lake and ocean acidification. Fifth assessment report of “Intergovernmental panel on climate change (IPCC)” showed that Substantial emissions reductions over the next few decades can reduce climate risks in the 21st century and contribute to climate-resilient pathways for sustainable development.2 The nuclear energy does not emit the greenhouse gases and air pollution during the power generation, therefore this is the one of the clean energy. As known the serious accidents at Chernobyl, Russia in 1986 and Fukushima, Japan in 2011, however, the nuclear energy has risks for the radiation contamination and high costs for the disposal of nuclear waste and decommissioning of reactor. In order to build a sustainable society, it is required to increase the ratio of the renewable energies, such as wind, solar, hydro-power and geothermal, to total primary energy. As shown in Fig. 1-2 shows the electricity production trends of the solar
- 2 -
Figure 1-1. Trend of primary energy consumption in the world.1
Figure 1-2. (a) Evolution of regional PV installations3 and (b) Annual new capacity, cumulative capacity, and electricity production for IEA Wind member countries.4
- 3 -
(photovoltaic applications, PV)3 and wind energy4. The power generation both from the solar and wind has increased year by year. However, the power generation efficiency both of solar and wind are varied depending on sunshine and wind speed, and the power cannot be generated in the absence of these. In addition, the locations of such renewable energies are not always the same location of much power demand. Therefore, energy storage systems and energy carriers is required to use the energy effectively. Hydrogen has a high energy density, and is able to produce from the renewable energy sources and suitable to be an energy storage systems and energy carriers.5,6 The fuel cells can cleanly and efficiently convert the chemical energy from hydrogen into the electric power, and attract as new energy conversion system with zero-emissions. The polymer electrolyte fuel cells (PEFCs) have a lot of advantages of a high power density, highly efficient, silent, short startup (SU) time and operates at low temperatures.5 Thus PEFCs had been investigated to apply for the various applications.
Fig. 1-3 shows trends in CO2 emissions in each sector from 1990 to 2014. The ratio
of the CO2 emission from the transport to the total CO2 emission was almost 17.3%, and
over 90% of the CO2 from the transport was emitted from the road transport such as the
car, truck and bus in 2014.7 In order to reduce the CO2 and air pollution emission from
the transport, automotive companies put hybrid electric vehicles, electric vehicle and fuel cell vehicles (FCVs). The FCVs “MIRAI” by Toyota Co., Ltd. and “CLARITY FUEL CELL” by Honda Co., Ltd. have started to sell in 2014 and 2016, respectively.
- 4 -
Figure 1-3. Trends in CO2 emissions in each sector. (Figures in brackets indicate relative
increase or decrease to the FY1990 values).4
1.2 Polymer Electrolyte Fuel Cells (PEFCs)
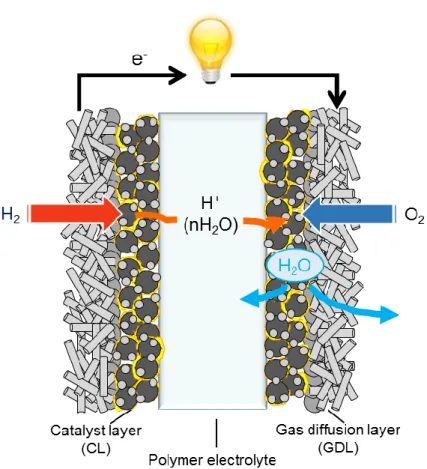
PEFCs include catalyst layers both for an anode and cathode and proton conductive polymer electrolyte with gas diffusion layers, as shown in Fig. 1-4. These compositions are generally called “membrane electrode assembly (MEA)”.
The single cell of PEFC is constructed with MEA and bipolar plates which have gas flow channel for hydrogen, oxygen or air and coolant. At the anode, hydrogen is oxidized to protons (H+) and electrons (e-), as shown in equation (1-1). The protons and electrons move to the cathode through the polymer electrolyte and external electrical load, respectively. At the cathode, the oxygen reduction reaction (ORR) occurs with the protons and electrons, as shown in equation (1-2). The overall reaction is shown in equation (1-3).
- 5 -
Figure 1-4. Schematic of typical MEA for PEFCs.
Anode: H2 → 2 H+ + 2 e- (1-1)
Cathode: 2 H+ + 1/2 O2 + 2 e- → H2O (1-2)
Overall: H2 + 1/2 O2 → H2O (1-3)
The maximum cell voltage, Eo of PEFCs is able to be calculated from following equation (1-4):
Eo = - Δ Go / 2 F (1-4) where ΔGo is Gibbs free energy of equation (1-3) at standard conditions (-237.2 kJ mol-1) and F is the Faraday constant (96485 C mol-1). According to the equation (1-4),
Eo would be 1.23 V.
- 6 -
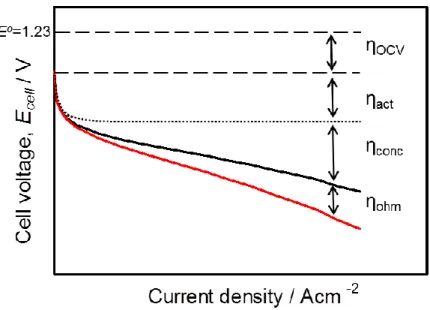
circuit ηOCV, activation overpotential ηact, concentration overpotential ηconc and ohmic
loss ηohm as shown in the typical polarization curve of Fig. 1-5. The ηact and ηconc are
generally dominated by catalytic activity for the ORR and mass transport (proton, electron, and oxygen) in the cathode, respectively, and the several approaches are investigated for the decrease of these overpotentials.
Pt-based catalysts are generally used both for the anode and cathode, which have high catalytic activity at low temperature. Fig. 1-6 shows the breakdown of the fuel cell stack cost.8 The percentage of the catalyst cost is relatively high, because the large amount of Pt is utilized. In order to reduce the amount of the Pt catalyst, Pt nanoparticles dispersed on supports is generally used to improve the mass specific surface area of Pt.9,10 Carbon black (CB), which has a high specific surface area, high electrical conductivity and gas diffusivity, is a one of typical support material. The ηact
and ηconc, and the cost of the catalyst decrease by using the Pt nanoparticle supported on
CB (Pt/CB). Furthermore, in order to increase the catalytic activity for ORR and reduce the amount of the Pt catalyst usage. the Pt alloyed with transition metals such as Fe,11,12
Co11-13 and Ni11-13 have investigated. The ηconc generally increases with decrease of the
oxygen diffusivity to the Pt, which is caused by the inadequate gas pass and the inadequate of the gas pass with generated water in the cathode. In order to decrease the ηconc, the effect of PTFE content in the MPL,14,15 hydrophilic layer in the GDL,16,17
porosity and pore diameter of the GDL,18,19 and flow field designs have been investigated.
However, not only the performance of the power generation but also the stability of the catalyst for the long term operation should be considered to reduce the cost of PEFCs.
- 7 -
Figure 1-5. Typical polarization curve of PEFC with cell voltage loss factors.
Figure 1-6. Breakdown of the 2015 projected fuel cell stack cost at 1,000 and 500,000 systems per year.8
- 8 -
1.3 Degradation of Pt/CB catalyst during FCVs operation
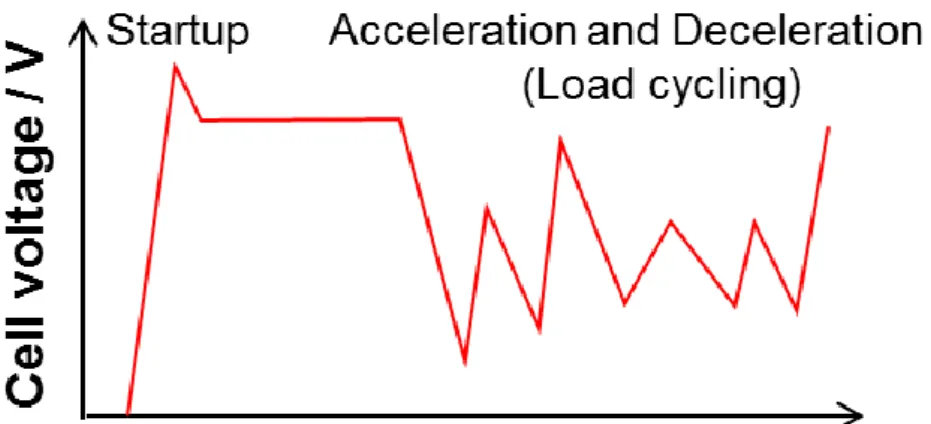
Fig. 1-7 shows the schematic of the cell voltage change during FCVs operation. It is well known that these cell voltage changes cause the catalyst degradations.
Before the SU of the PEFCs, air exists on both the anode and cathode due to air leakage from outside. When FCVs SU, hydrogen is introduced to the anode. The anode is exposed to both air and hydrogen transiently until the replacement of the former with the latter is completed as shown in Fig. 1-8. The electrode potentials in both regions A-1 and A-2 become the same value because of the high electrical conductivity of the CB in the CL and GDL. The anode potential decreased to near 0 V, because the rate of the hydrogen oxidation reaction (HOR) is sufficiently faster than that of the ORR. However the in-plane proton conductivity of the electrolyte is low, thus the concentration of H+ decreases in the region A-2. As a result of these compositions, local cells are formed inside the PEFCs as shown in Fig. 1-8. The H+ is supplied from the region C-2 in the cathode to region A-2 in the anode via oxygen evolution reaction (equation (1-5)) and carbon oxidation reaction (COR, (equation (1-6))).
H2O → 1/2 O2 + 2 H+ + 2 e- (1-5)
C + 2 H2O → CO2 + 4 H+ + 4 e- (1-6)
This phenomenon is generally called “reverse current mechanism”, firstly proposed by Reiser et al.20 The COR occurs during the shutdown (SD) condition in the region C-1. The CB support oxidation reads the agglomeration, dissolution and detachment of the Pt nanoparticles. Severe CB oxidation collapses the structure which is responsible for the reactant gases and water pass, and increase the ηconc of the cathode.20 This SU/SD
process is hereinafter called as “air-SU/SD”.
- 9 -
potential decreases and increases, respectively. These potential changes cause the Pt oxide reduction and re-oxidation, and the growth the Pt nanoparticle size via dissolution and redeposition (Ostwald ripening).21,22 Pt particle growth leads to the decrease of ORR site areas and the cell performance.
Figure 1-7. Schematic of the cell voltage change during FCVs operation.
- 10 - 1.4 Objective of This Research
As described in the last section, there are different mechanisms during the SU/SD and load cycling. It has been reported that the 55% of the performance loss occurs during the SU/SD condition and the performance loss during load cycling is less than SU/SD, 27%.23 Thus, the catalyst degradation during the SU/SD process was focused.
In chapter 2, the durability of Pt supported on two types of catalysts (commercial Pt/graphitized carbon black (Pt/GCB) were investigated, and that prepared in house by the “nanocapsule-method,” n-Pt/GCB) catalysts was evaluated in the practical air-SU process, i.e., the anode gas was successively cycled between air, hydrogen, and nitrogen. The polarization curves and cyclic voltammetry were performed before and after the air-SU evaluation. The degradation of Pt nanoparticles and carbon supports was analyzed by transmission electron microscopy, scanning transmission electron microscopy, and micro-Raman spectroscopy. Glancing incidence X-ray diffraction was also applied in order to observe the depth profiles of the Pt crystallite sizes in various interfacial regions. From these analyses, it was found that the degradation of the Pt catalyst occurred not only in the gas outlet region but also the gas inlet region of the cathode. The degradation in the inlet region is ascribed to both the interim electrochemical evaluations and the potential fluctuations, which cause dissolution of Pt nanoparticles used during the SU process.
From the result of chapter 2, the use of the n-Pt/GCB as the cathode material improved not only the cell performance but also the durability under air-SU process compared with those for a cathode prepared with a commercial Pt/GCB. However the ECSA for n-Pt/GCB still decreased by more than 50% after 1000 cycles of air-SU/SD, compared with that before cycling. In order to improve the SU/SD durability of PEFCs
- 11 -
in FCVs, the hydrogen passivation process (H2-SU/SD) has been proposed.24 The
H2-SU/SD process prevents the construction of local cells, which cause the reverse
current processes in the anode and cathode, and it also suppresses the severe COR and Pt aggregation in the cathode that are observed during the air-SU/SD process. However, it was found that carbon corrosion still occurred during the H2-SU/SD process, even
though it was less severe than that during the air-SU/SD process. In chapter 3, the mechanism of the COR during the H2-SU/SD process was investigated and proposed.
In chapter 4, the results from chapter 2 and 3 were summarized, and a solution to the problem of the catalyst degradation during the SU/SD process was discussed, which was based on the mechanisms.
- 12 - 1.5 References for chapter 1
1. BP Statistical Review of World Energy, published by BP global (2016):
https://www.bp.com/content/dam/bp/pdf/energy-economics/statistical-review-2016/bp-s
tatistical-review-of-world-energy-2016-full-report.pdf.
2. Intergovernmental Panel on Climate Change fifth Assessment Report (IPCC AR5), published by IPCC: http://www.ipcc.ch/
3. Trend 2015 in Photovoltaic applications, published by International energy agency:
http://www.iea-pvps.org/fileadmin/dam/public/report/national/IEA-PVPS_-_Trends_20
15_-_MedRes.pdf.
4. IEA Wind 2015 Annual Report, published by IEA Wind:
https://www.ieawind.org/annual_reports_PDF/2015/2015%20IEA%20Wind%20AR_sm
all.pdf
5. L. Carrette, K. A. Friedrich and U. Stimming, Fuel Cells, 1, 5 (2001). 6. Y. Ando, K. Kuramoto, J. Jpn. Inst. Energy, 85, 494 (2006).
7. National Greenhouse Gas Inventory Report of JAPAN 2016, published by GIO
Greenhouse Gas Inventory Office of JAPAN:
http://www-gio.nies.go.jp/aboutghg/nir/2016/NIR-JPN-2016-v3.0_rev_web.pdf
8. DOE Hydrogen and Fuel Cells Program Record, published by U.S. department of energy: https://www.hydrogen.energy.gov/pdfs/15015_fuel_cell_system_cost_2015.pdf
9. A. Ohma, K. Shinohara, A. Iiyama, T. Yoshida and A. Daimaru, ECS Trans., 41 (1), 775 (2011).
10. L. M. Loen, C. H. Paik and T. D. Jarvi, Electrochem. Solid-State Lett., 7, A19 (2004).
- 13 - (1999).
12. S. Mukerjee, S. Srinivasan, J. Electroanal. Chem., 357, 201 (1993).
13. E. Antolini, R. R. Passos, E. A. Ticianelli, Electrochim. Acta, 48, 263 (2002). 14. H. Li, Y. Tang, Z. Wang, Z. Shi, S. Wu, D. Song, J. Zhang, K. Fatih, J. Zhang, H. Wang, Z. Liu, R. Abouatallh, A. Mazza, J. Power Sources 2008, 178, 103-117.
15. S. Park, J.-W. Lee, B. N. Popou, Int. J. Hydrog. Energy, 37, 5850 (2012).
16. J. H. Chun, K. T. Park, D. H. Jo, J. Y. Lee, S. G. Kim, S. H. Park, E. S. Lee, J. Y. Jyoung, S. H. Kim, Int. J. Hydrog. Energy 2011, 36, 8422-8428.
17. S. Hirakata, M. Hara, K. Kakinuma, M. Uchida, D. A. Tryk, H. Uchida, M. Watanabe, Electrochim. Acta, 120, 240 (2014).
18. H. S. Chu, C. Yeh, F. Chen, J. Power Sources, 123, 1 (2003).
19. S. Hirakata, T. Mochizuki, M. Uchida, H. Uchida, M. Watanabe, Electrochim. Acta, 108, 304 (2013).
20. C.A. Reiser, L. Bregoli, T.W. Patterson, J.S. Yi, J. Deliang, M.L. Perry, T.D. Jarvi,
Electrochem. Solid-State Lett., 8 A273 (2005).
21. X. Wang, R. Kumar, D. Myers, Electrochem. Solid-State Lett., 9, A225 (2006). 22. S. Kawahara, S. Mitsushima, K. Ota, N. Kamiya, ECS Trans., 3, 625 (2006). 23. M. Yamamoto and H. Matsumori, Honda R&D Technical Review, 28, 41 (2016) 24. K. Miyata and C. Wake, Japanese patent 5647079 (2014).
- 14 -
Chapter 2
Degradation of Pt catalysts supported on graphitized carbon
black during gas-exchange startup operation similar to that
used for fuel cell vehicles
2.1 Introduction
The widespread commercialization of polymer electrolyte fuel cells (PEFCs) has been impeded because of the large amount of the platinum catalyst required. During the startup and shutdown (SU/SD) cycles of the PEFCs, air and H2 coexist transiently in the
anode until the replacement of the former with the latter (or vice versa) is completed. As shown in chapter 1, Reiser et al. showed that this situation causes the construction of local cells in PEFCs and the cathode potential to climb to more than 1.5 V due to the so-called “reverse current mechanism”.1 which significantly accelerates the degradation of the catalyst due to the oxidation of the carbon black (CB) and the agglomeration or dissolution of the Pt nanoparticles.2
Several approaches have been taken to both understand and mitigate the decrease of PEFC performance during operation.3 One approach to mitigate the decrease of the cell performance is to use transition metal oxide support materials, for example, titanium-based oxides3-7 and tin-based oxides.8-12 Shintani et al. proposed that that the reverse current during SU/SD can be reduced by decreasing the oxygen reduction
- 15 -
reaction (ORR) current generation on the Ta-doped TiO2-supported Pt anode due to its
high resistivity in air.13
It has developed a graphitized CB (GCB) supported Pt catalyst prepared by the “nanocapsule method” (n-Pt/GCB) to improve the performance of Pt catalysts.14-16
The high dispersion of the Pt nanoparticle catalyst particles on the GCB support prepared by this method provides enhanced ORR activity. It was also found that the durability of the n-Pt/GCB catalyst was improved during a potential cycling evaluation that simulated the variation of the cathode potential during the SU/SD of the PEFCs. These studies have demonstrated important roles of the support carbon and the state of the Pt particles on the supports to lead to high activity and durability for PEFC electrocatalysts.
In order to clarify the mechanism of the performance degradation under the actual SU/SD conditions of PEFCs, In order to clarify the degradation mechanism of the cathode catalysts during SU/SD, Ishigami et al. visualized the distribution of the oxygen partial pressure at the anode in real time and space during the SU/SD.17 Kreitmeier et al. investigated the carbon support corrosion by measuring local CO2 formation with online
mass spectrometry.18 Lamibrac et al. measured the internal current in the cathode during the SU/SD of PEFCs by using a segmented cell.19 Durst et al. also used a segmented cell to correlate the local performance loss of the catalyst layer (CL) with its degradation.20 However, these measurements have included the effects of both the SU and the SD on both the cell performance and the catalyst degradation, so that the individual effects of each are still unclear.
The three unique points of this research are summarized as follows. First, while in our previous research, it was found that a well dispersed Pt catalyst, n-Pt/GCB, showed higher durability than commercial Pt/GCB under a potential cycling evaluation that
- 16 -
simulates SU/SD, in the present research, it was demonstrated that n-Pt/GCB has high durability under actual FCV SU conditions, which involve gas exchange. The changes of the electrochemical active surface area (ECA), cell performance, particle size distribution of Pt and the degradation of the carbon supports were investigated by electrochemical measurements, transmission electron microscopy (TEM), scanning TEM (STEM), and micro-Raman spectroscopy. Second, glancing incidence X-ray diffraction (GIXD)21 was applied for the analysis of Pt degradation in the CL and membrane. This is the first application of GIXD in the PEFC field. GIXD is a simple, non-destructive analytical technique and is a useful way to analyze Pt degradation quickly. Finally, while it has been well recognized that the cathode CL in the gas outlet region degrades severely under the SU condition caused by the “reverse current mechanism,” it was found that the catalyst degrades not only in the outlet region but also in the inlet region during SU. This degradation in the inlet region was associated with the potential cycling caused by the ORR during the SU by using a single cell with two RHEs.
2.2 Experimental
2.2.1 Preparation of CCMs.
Commercial 30 wt% Pt-loaded GCB catalyst supplied by Tanaka Kikinzoku Kogyo K. K. (c-Pt/GCB) and 30 wt% Pt-loaded GCB catalyst prepared in house by the nanocapsule method (n-Pt/GCB)5 were used for the cathodes of the CCMs. A commercial Nafion membrane (NRE 212, Dupont, 50 μm thickness) was used as the polymer electrolyte membrane (PEM). As the anode, commercial 50 wt% Pt catalyst
- 17 -
supported on carbon black supplied by Tanaka Kikinzoku Kogyo K. K. (c-Pt/CB) was used for all experiments. The CCMs were prepared in the same manner as reported in our previous work.16 Briefly, the catalyst pastes were prepared from the each Pt-loaded carbon catalysts with Nafion binder (ion exchange capacity 0.9 meq g-1, DE521, E. I. Du Pont de Nemours & Co., Inc.) and the mass ratio of Nafion binder (dry basis) to carbon black (Nafion binder/carbon) was adjusted to 0.7. The catalyst paste was directly sprayed onto the PEM to prepare the CCM by use of a pulse-swirl-spray apparatus (PSS, Nordson Co.), and then dried at 60 °C in an electric oven. The Pt loading on both cathode and anode sides was 0.5 ± 0.1 mg-Pt cm−2, and the active geometric area of the
electrode was 29.2 cm2. The CCM was pressed at 140 °C and 1.0 MPa for 3 min. The CCM was sandwiched between two gas diffusion layers (GDLs, 25BCH, SGL Carbon Group Co., Ltd.) and was then assembled into a single serpentine pattern cell (Japan Automotive Research Institute (JARI) standard cell) consisting of two carbon separator plates.
2.2.2 Procedure of CCMs evaluation for durability and electrochemical properties. The durability evaluation was performed according to a gas exchange protocol simulating SU conditions (air-SU), as shown in Fig. 2-1 and Table 2-1. The initial ECA of the Pt catalyst in the cathode before the durability evaluation was evaluated by use of cyclic voltammetry (CV) at 40 °C and 65 °C with 100% RH N2 in the cathode and
100% RH H2 in the anode with a potentiostat (HZ-5000 Automatic Polarization System,
Hokuto Denko Co.). The anode was used as both reference electrode and counter electrode for the CV. At 65 °C, the cathode potential was swept at 20 mV s-1 from 0.07 V to 1.0 V, and at 40 oC, it was swept at 50 mV s-1 from 0.05 V to 1.15 V. The value of
- 18 -
ECA was determined from the hydrogen adsorption charge, referred to ΔQH° = 0.21
mC cm−2, the value used conventionally for polycrystalline platinum.22,23 The current-voltage (I-E) curves were measured galvanostatically supplied to the anode and the cathode by use of an electronic load (PLZ-664WA, Kikusui Electronics Co.) operated in the constant current mode (5 min acquisition at each current), controlled by a measurement system (FCE-1, Panasonic Production Engineering Co.) at 65 °C with 100% RH H2 and air under ambient pressure (1 atm) with gas utilizations of 70% and 40%, respectively. The durability evaluation of the c-Pt/GCB and n-Pt/GCB catalysts was performed by repetitive cycles in which the gases supplied to the anode / cathode were switched in the following sequence: (1) dry air/ humidified (100% RH) air, (2) humidified H2/ humidified (100% RH) air, and (3) dry N2 / N2, at a cell temperature of
45 °C. The supply gas was purged to the cell with a holding period of 90 s for air / air and H2 / air and a holding period of 60 s for N2 / N2 during each cycle. The gas flow
rates used during the air-SU cycles are shown in Table 2-1. After every 200 cycles, the ECA values were estimated from CV, and the I-E curves were obtained.
- 19 -
Figure 2-1. Experimental procedures for the air-SU durability evaluation.
- 20 - 2.2.3 Raman spectroscopy.
The structural changes of the GCB support after the air-SU cycling were evaluated from the change of Raman spectra recorded by a confocal micro-Raman instrument (LabRAM HR-800 spectrometer, HORIBA Jobin Yvon, Ltd.). The Raman spectra were obtained by excitation with the radiation from a He-Ne laser operated at approximately 2 mW. The Raman spectroscopic measurements were performed with a 100× magnification objective, a 100-μm confocal aperture for the sample illumination and collection of the scattered light, a 600-line mm-1 grating, and a Peltier-cooled CCD camera as a detector. The instrument control and spectral analysis were performed with the software programs Labspec 5 (HORIBA Jobin Yvon, Ltd.) and GRAMS/AI 8.0 (Thermo Fisher Scientific, Inc.). In order to easily compare the results for each sample, the Raman spectra of the Pt catalysts illustrated in the figures were normalized by the intensity of the peak at ca. 1580 cm-1, which corresponds to the spectrum for a stable graphitic lattice, as discussed below. Curve fitting for the determination of spectral parameters was performed with the software program GRAMS/AI 8.0.
2.2.4 TEM and STEM measurements.
The morphology of CLs and Pt dispersion were characterized by TEM (H-9500, Hitachi High-Technologies Co.; acceleration voltage 300 kV) and by STEM (HD-2700, Hitachi High-Technologies Co.; acceleration voltage 200 kV), respectively. The average Pt particle size and standard deviation for Pt-loaded carbon catalysts were obtained from the image analysis of at least 200 randomly selected Pt particles in the TEM and STEM images for the initial condition and after the air-SU cycling, respectively. To analyze the distribution of the Pt particle degradation along the through-plane direction of the CL,
- 21 -
ultrathin slices of the CCM were prepared with a focused ion beam system (FIB, FB-2200, Hitachi High-Technologies Co.).
2.2.5 GIXD measurements.
The Pt particle size as function of depth along the through-plane direction of the CLs was evaluated by use of the glancing incidence X-ray diffraction (GIXD) method with an X-ray diffractometer (XRD, Smart-Lab, Rigaku Co.; Cu Kα, 40 kV, 20 mA) equipped with a confocal mirror (beam diameter 30 μm). The glancing angle (θ) was varied from 0.2o to 5.0o with steps of 0.2o (0.2 o < θ < 1.0 o) and 1.0o (1.0 o < θ < 5.0 o). The X-ray diffraction intensity of each scanning angle (2θ) was measured with a fixed exposure time of 3 s at each step. In order to detect the θ value corresponding to the interface between the CL and PEM, the GIXD was performed on a MEA, separately prepared in the same manner as that described above but with an additional thin layer of sputtered gold (Au) between them.
- 22 - 2.3 Results and discussion
2.3.1 Measurements of the electrode potential during the air-SU cycling.
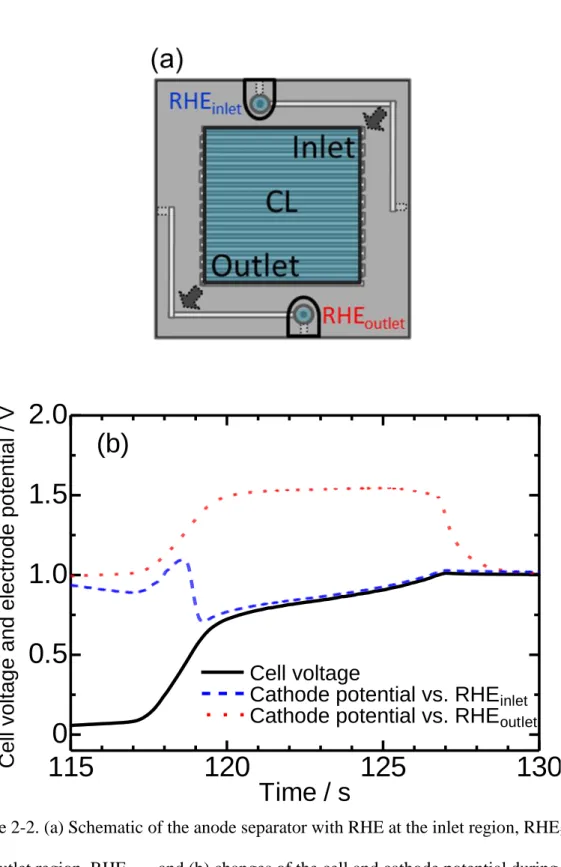
The electrode potentials of the c-Pt/GCB cathode during the air-SU cycling were measured by use of a JARI cell with two reversible hydrogen electrodes (RHE). Those two RHEs, which can observe the potentials of the gas inlet and outlet regions, were individually constructed on the top and bottom of the anode-side bipolar plate (Fig. 2-2 (a)). These RHEs were constructed from gas diffusion electrodes using c-Pt/CB loaded on GDLs (0.5 ± 0.1 mg-Pt cm −2; 2.6 mm diameter).
Fig. 2-2 (b) shows the cell voltage and the cathode potential changes at both the inlet and outlet region during SU conditions (air-SU cycle). The cathode potential in the outlet region increased to around 1.6 V when hydrogen was introduced to the cell. This phenomenon has been explained by the reverse current mechanism.1 On the other hand, the cathode potential in the inlet region temporarily increased and then decreased. It is considered that the potential increase in the inlet region was caused by the reverse current, because the H2-air front gradually moved from inlet region to the outlet region,
and the immediate decrease was caused by the simultaneous ORR associated with the reverse current in the outlet region.
- 23 -
Figure 2-2. (a) Schematic of the anode separator with RHE at the inlet region, RHEinlet
and outlet region, RHEoutlet and (b) changes of the cell and cathode potential during the
air-SU cycling.
115
120
125
130
0
0.5
1.0
1.5
2.0
Ce
ll v
o
lta
g
e
a
nd
e
le
ct
ro
d
e
p
ot
e
nt
ia
l /
V
Time / s
Cell voltage
Cathode potential vs. RHE
inletCathode potential vs. RHE
outlet(b)
- 24 -
2.3.2 Evaluations of Pt catalyst durability by electrochemical measurements.
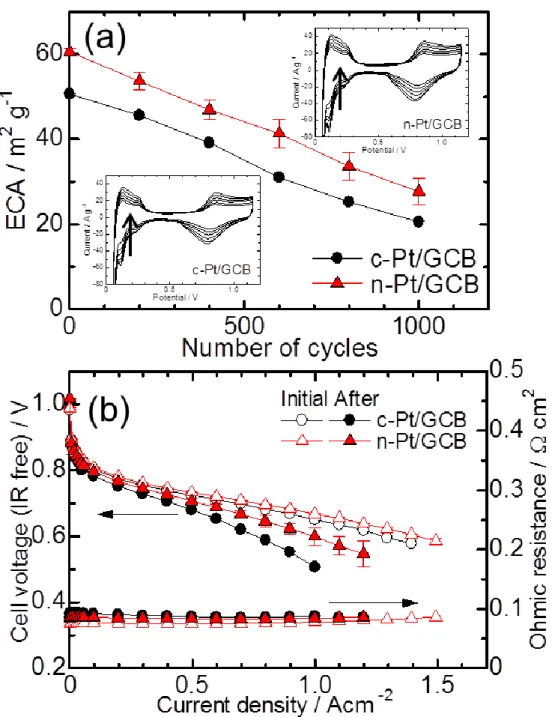
Fig. 2-3 (a) shows cathode ECA changes of the cells using c-Pt/GCB and n-Pt/GCB during the air-SU cycles. The ECA values were calculated from the H adsorption peaks of the CV for c-Pt/GCB and n-Pt/GCB at every 200th cycle up to 1000 cycles. The ECA values of both catalysts decreased to approximately half the initial values at 1000 cycles. However, the ECA value of n-Pt/GCB at the 1000th cycle was equal to that of c-Pt/GCB at about the 700th cycle, because the initial ECA value of n-Pt/GCB was higher, and the degradation rates were nearly the same.
Fig. 2-3 (b) shows the changes in the I-E curves of the cells using the c-Pt/GCB and n-Pt/GCB cathode catalysts before and after the air-SU cycling; the cell performances for both catalysts decreased. The performance of the n-Pt/GCB cell was superior to that of c-Pt/GCB. In the region of current density higher than 0.5 A cm-2, the performance degradation of the c-Pt/GCB cell was clearly more severe than that of the n-Pt/GCB cell. In this current density region, the oxygen mass transport strongly influences the cell performance.24 The ohmic resistances of the cells using both catalysts exhibited nearly the same values after the durability cycles compared with the initial values.
2.3.3 STEM examination of the catalysts: initial and after the durability evaluation.
Fig. 2-4 shows the dark-field STEM images of both (a) c-Pt/GCB catalyst and (b) n-Pt/GCB catalyst in the initial state and after the air-SU durability test, located in the inlet and outlet regions. In the initial images, the Pt particles were more uniformly dispersed on the GCB in the n-Pt/GCB catalyst than in the c-Pt/GCB catalyst. The Pt size of c-Pt/GCB and n-Pt/GCB were 3.3 nm and 2.4 nm, respectively (Table 2-2).
- 25 -
Figure 2-3. (a) ECA changes of c-Pt/GCB and n-Pt/GCB at 65 °C with 100% RH N2 in
the cathode and 100% RH H2 in the anode measured during the air-SU cycling and (b)
I-E curves of c-Pt/GCB and n-Pt/GCB at 65 oC with 100% RH H2 in the anode and air
- 26 -
The images of both the inlet and outlet regions show the cross-section of the CL close to the PEM. In order to remove the effect of FIB-induced ion beam damage, the mean Pt particle-diameters were calculated from the Pt particles that were not directly on the top-surface of the CL slice. The results are shown in Table 2-2, together with those of the center, and close to the GDL side. The numbers in parentheses indicate the distances in μm from the PEM surface. The mean Pt diameter for c-Pt/GCB in the outlet region was not obtainable, because the thickness of CL decreased (Fig. 2-5) and Pt particles were severely agglomerated (Fig. 2-4). The distances from the PEM surface in the outlet region were significantly smaller than those in the inlet region, because the overall thickness of the CL decreased substantially due to the severe carbon corrosion that occurred in the outlet region. In both regions, the Pt particle sizes of both catalysts increased compared with the initial values. In the inlet region, the Pt particle sizes of both c-Pt/GCB and n-Pt/GCB catalysts at the PEM side were smaller than those at the GDL side. In contrast, in the outlet region, the Pt particle size for n-Pt/GCB at the PEM side was larger than those at the center and at the GDL side. The values observed after the air-SU cycles for n-Pt/GCB became smaller than those for c-Pt/GCB. These results indicate that the uniform distribution of Pt particles in the n-Pt/GCB catalyst, which can be observed in the initial image of Fig. 2-4 (b), prevented both the increase of the Pt particle size in the inlet region and the severe aggregation of Pt in the outlet region, compared with the case of c-Pt/GCB. In the next section, the degradation behavior in the depth direction of each region is discussed in detail.
- 27 - F igur e 2 -4. D ar k -f iel d ST E M im ages of ( a) c -P t/ G C B a nd (b) n -P t/ G C B of t he ini ti al st at e and bot h t he inl et and out let r egi ons af ter t he ai r-SU cy cl ing. P t par ti cl e si zes w er e cal cul at ed fr om t he P t par ti cl es t h at w er e not di rect ly on the sur face of t he F IB sl ice of t h e C L w it h in the w hi te fr a m e s show n in the i m ages of t he i nl et r egi on f or c -P t/ G C B a nd bot h i nl et and out let r egi ons f or n -P t/ G C B .
- 28 -
Table 2-2. Pt particle diameters (nm) of c-Pt/GCB and n-Pt/GCB in the initial state and both inlet and outlet regions at several depth positions after the air-SU durability evaluation obtained by STEM images (Fig. 2-4). Values in parentheses show distances from the interface between the PEM and the CL (µm).
Figure 2-5. Dark-field STEM images of (a) inlet region and (b) outlet region of c-Pt/GCB CL cross-section after the air-SU cycling.
- 29 -
2.3.4 GIXD measurements of the catalysts: initial and after the durability evaluation.
Fig. 2-6 shows the relationship between the incident angle of the X-ray and the crystallite size of Pt calculated by the Scherer equation. The crystallite sizes in the inlet and outlet region of both catalysts after air-SU cycling were larger than the initial values. In the inlet region, the crystallite sizes of both catalysts after cycling increased with increasing the X-ray incident angle. In the outlet region, these crystallite sizes decreased in the incident angle range from 0.2 o to 2.0 o and then increased in the ranges larger than 2.0 o. From ancillary measurements in which Au particles were deposited at the interface between the CL and PEM, the incident angle of about 2.0 ° was established as a marker for this boundary, with smaller angles corresponding to the CL itself. In the CL region, i.e., incident angle smaller than 2.0 °, the Pt crystallite sizes for the c-Pt/GCB cathode in the inlet region increased to 4.2 – 5.0 nm from the initial value of 2.6 nm after cycling, and those in the outlet region increased to 8.6 nm - 12 nm. In the case of the n-Pt/GCB cathode, the Pt crystallite sizes in the inlet region increased to 4.0 nm - 4.2 nm from the initial value of 2.5 nm, and those in the outlet region increased to 5.4 nm - 9.5 nm. The Pt crystallite sizes of both CLs in the inlet region were smaller than the Pt particle sizes obtained by the STEM measurements (Fig. 2-4 and Table 2-2). These results indicate that severe aggregation of the Pt particles had occurred, together with Pt re-deposition, during the air-SU cycles, because the present STEM images of the Pt particles were not able to discriminate between large single crystallites and aggregated Pt particles. The Pt crystallite sizes after the cycling of the n-Pt/GCB cathode were also smaller than those for the c-Pt/GCB cathode, similar to the results from the STEM images (Fig. 2-4 and Table 2-2). These results also indicate that the
- 30 -
uniform distribution of the Pt particles in the n-Pt/GCB catalyst prevented both the severe aggregation of Pt, particularly in the outlet region, compared with the case of c-Pt/GCB.
In contrast, in the region corresponding to incident angles larger than 2.0 o, these values were nearly the same and increased with increasing X-ray incident angle θ (Fig. 2-6). Fig. 2-7 shows the cross section of dark-field STEM images of the nearby interface between the cathode CL and the PEM of both CCMs. These Pt particle sizes increased with increasing distance from the cathode CL. The trend of increasing Pt crystallite sizes for both catalysts at the larger θ-values provides information on the Pt particles not only in the CL but also in the PEM, because of the XRD from deeper positions within the PEM. In the PEM region, it is considered that dissolved Pt in ionic form was deposited as the metal by hydrogen permeating from the anode, and the size of the Pt crystallites depended on the hydrogen concentration, which would be closer to the anode.
Figure 2-6. Relationship between the incident X-ray angle and the crystallite size of c-Pt/GCB and n-Pt/GCB before and after the air-SU durability evaluation in the inlet and outlet regions
0 2.0 4.0 6.0 0 5 10 15 20 C ryst a lli te si ze / n m
Incident angle / deg.
Initial Inlet Outlet c-Pt/GCB n-Pt/GCB
- 31 -
Figure 2-7. Dark-field STEM images of MEA cross-sections of c-Pt/GCB and n-Pt/GCB after the air-SU durability evaluation in the inlet and outlet region. The CL thicknesses for c-Pt/GCB and c-Pt/GCB became small due to the ion beam used to prepare the ultrathin slices of the PEMs.
- 32 -
2.3.5 Raman spectroscopy measurements of the catalyst: initial condition and after the durability evaluation.
To clarify the carbon corrosion phenomena during the air-SU cycling, Raman spectroscopic analysis was carried out according to procedures described in our previous work.16 As an indicator of the carbon corrosion, the ratios of AD1-band / AG-band
are shown in Fig. 2-8. The values of the AD1-band / AG-band ratio in the inlet region for
both catalysts after the air-SU cycling were nearly the same compared with those for the initial condition. These results show that the carbon corrosion in the inlet region was negligible. In contrast, the AD1-band / AG-band ratios in the outlet regions of both c-Pt/GCB
and n-Pt/GCB were ca. 1.6 times and ca. 1.3 times higher, respectively, after the air-SU cycling than the initial values. These results show that the carbon corrosion that was caused by the reverse current and the cathode potential change observed in Fig. 2-2 (b) was predominated in the outlet region, which is in good agreement with the results of the CL thickness changes (Table 2-2). The AD1-band / AG-band ratio for n-Pt/GCB in the
outlet region after the air-SU cycling was lower than that for c-Pt/GCB. This result shows that the carbon support degradation for n-Pt/GCB was milder than that for c-Pt/GCB, also in agreement with the CL thickness change results (Table 2-2). In our previous research,4 in the case of c-Pt/GCB, Pt particles were attached densely at defect sites on the GCB support. In the case of n-Pt/GCB, Pt particles were dispersed not only at defect sites, which are easily corroded, but also at stable sites of the graphitized layer on the GCB support. It is considered that the carbon corrosion is accelerated by catalytic oxidation with Pt. It has been also proposed that relatively large cathodic current densities were concentrated in small regions near Pt on c-Pt/GCB, which should be defect sites of GCB, while a more uniform, locally averaged current was obtained on
- 33 -
well dispersed Pt catalysts on n-Pt/GCB.15-17 Thus, the degradation of n-Pt/GCB with well dispersed Pt particles on the GCB support was milder than that of c-Pt/GCB.
The carbon corrosion accelerates both the destruction of the CL and the detachment and aggregation of Pt particles, as well as leading to the degradation of cell performance, particularly in the high current density region. Therefore, it is considered that the cell performance using the n-Pt/GCB cathode was superior to that using c-Pt/GCB in the high current density region after the durability cycling (Fig. 2-3 (b)), because the carbon corrosion was suppressed by the highly uniform Pt distribution of n-Pt/GCB.
- 34 -
Figure 2-8. Raman spectra for (a) c-Pt/GCB and (b) n-Pt/GCB and (c) AD1-band / AG-band
ratios for c-Pt/GCB and n-Pt/GCB before and after the air-SU durability evaluation in the inlet and outlet regions.
- 35 -
2.3.6 Investigation of the Pt degradation in the inlet region.
According to the above results, it was found that degradation of the Pt catalyst occurred not only in the outlet region but also in the inlet region. Two possible scenarios of the Pt degradation in the inlet region were considered. The first is that the interim electrochemical measurements (IM) carried out during the durability evaluation could have affected the Pt dissolution, because the ORR performance in the outlet region decreased during the durability evaluation, and the load (current density) in the inlet region would have increased in order to compensate.25 The second is that the ORR in the inlet region (shown in Fig. 2-2) carried out during the durability evaluation could have accelerated the Pt dissolution and re-deposition during the potential cycling.
To investigate these effects, three durability protocols were evaluated with the same CCM construction using the c-Pt/GCB catalyst. In the first, the IM (CV and I-E) from the air-SU cycles were excluded in order to avoid their influence. In the second and third protocols, potential cycling profiles of 0.8 V to 1.2 V and 0.3 V to 1.2 V, respectively, were evaluated in order to define the effect of the lower potential limit in the inlet region that would be caused by the air-SU cycles. These potential cycling evaluations were applied for 1000 cycles with 100% RH air (360 ml min-1) at the cathode and 100% RH H2 (38 ml min-1) at the anode, as shown in Fig. 2-9.
Fig. 2-10 (a) shows CVs at 40 °C before and after the three evaluation protocols described above and also an air-SU evaluation with the IM (air-SU with IM) included for comparison. The air-SU evaluation that was carried out without the IM is shown as “air-SU without IM.” The two types of potential cycles with different lower potential limits are shown as “PC 0.8-1.2 V” and “PC 0.3-1.2 V.”
- 36 -
Figure 2-9. (a) Experimental procedures for the durability evaluations of the air-SU without IM and potential cycling (PC) and (b) cathode potential changes during the PC.
- 37 -
Fig. 2-10 (b) shows the ECAs calculated from the H adsorption peaks of the CVs shown in Fig. 2-10 (a). In Fig. 2-10 (b), the ECA measured after air-SU without IM was around two times higher than that for the air-SU with IM. This result shows that the IM enhanced the Pt particle degradation.25 The ECA value obtained after the evaluation for PC 0.8-1.2 V was nearly the same as that for the air-SU without the IM, and the ECA value obtained after the evaluation for PC 0.3-1.2 V was lower than those of either the air-SU without IM or PC 0.8-1.2 V. As shown in previous work.26-28 the lower potential limit of the potential cycling enhances the Pt degradation. These results suggest that the degradation of the Pt particles in the inlet region was caused by potential cycling due to a local ORR effect associated with the reverse current in the outlet region.
Fig. 2-11 shows the relationship between the incident X-ray angle and the Pt crystallite size in the inlet region of the cathode with the c-Pt/GCB catalyst before and after the air-SU evaluation with/without the IM. The Pt crystallites examined after the air-SU without IM also increased in size. In the incident angle range from 2.0 ° to 5.0 °, which is the PEM region, the increase of the Pt crystallite size after the air-SU evaluation without the IM was smaller than that for the air-SU with the IM. These results indicate that the air-SU accelerated the Pt dissolution in the inlet region, and the severe growth of the Pt crystallites was caused by the IM.
From the above results, it is conclude that the degradation of the Pt particles in the inlet region can be ascribed to the potential cycling caused by the ORR in the inlet region during the air-SU durability evaluation. In addition, the severe degradation of the Pt catalyst that resulted from the IM, which is similar to the load cycle operation in the actual FCV, occurs not only in the outlet region but also in the inlet region.
- 38 -
Figure 2-10. (a) CVs of c-Pt/GCB at 40 °C with 100% RH N2 in the cathode and 100%
RH H2 in the anode before and after the air-SU durability evaluation both with and
without IM (CV and I-E) and potential cycling (PC) with lower limit potential 0.8 V (PC 0.8–1.2 V) and 0.3 V (PC 0.3–1.2 V); (b) ECAs of c-Pt/GCB calculated from the CVs ((a)).
- 39 -
Figure 2-11. Relationship between the incident X-ray angle and the crystallite sizes of c-Pt/GCB before and after the durability evaluation of air-SU with and without IM (CV and I-E).
0
2.0
4.0
6.0
0
2
4
6
8
10
C
ryst
a
lli
te
si
ze
/
n
m
Incident angle / deg.
Initial
air-SU with IM
air-SU without IM
- 40 - 2.4 Conclusions
The first key point of the present research is that, while it was previously found that a well dispersed Pt catalyst, n-Pt/GCB, showed better durability than commercial Pt/GCB under a potential cycling evaluation that simulates SU/SD, it has been now demonstrated that n-Pt/GCB has high durability under actual FCV SU conditions, which involve gas exchange. The spatial distribution of the degradation of the carbon-supported Pt was investigated to evaluate in more detail the durability of the fuel cell under SU-like conditions, in which the anode gas was successively cycled between air, hydrogen, and nitrogen. Both the ECA values and the I-E performance of the cathode using the n-Pt/GCB catalyst, which was prepared by the nanocapsule method, were maintained at higher levels than that using c-Pt/GCB after 1000 durability cycles. The second key point is that GIXD was applied for the analysis of Pt degradation in the CL and membrane. This is the first application of GIXD in the PEFC field. GIXD is a simple, non-destructive analytical technique and is a useful way to analyze Pt degradation quickly. Both STEM and GIXD measurements indicated that the uniform distribution of Pt particles in the n-Pt/GCB catalyst was largely prevented their severe aggregation, particularly in the outlet region, compared with the case of c-Pt/GCB, with its nonuniform Pt particle distribution. Raman spectroscopy measurements indicated that the carbon corrosion was also suppressed by the uniform Pt distribution of n-Pt/GCB. STEM and GIXD measurements also showed that the degradation of the Pt catalyst occurred not only in the outlet region but also the inlet region. The final key point is that the degradation of Pt particles in the inlet region can be ascribed to both the IM carried out after every 200th cycle and the potential excursions caused by the ORR in the inlet region during the air-SU evaluation. Thus, while it has been well recognized
- 41 -
that the cathode CL in the gas outlet region degrades severely under the SU condition, it was found that the catalyst degrades not only in the outlet region but also in the inlet region during SU.
2.5 References for chapter 2
1. C.A. Reiser, L. Bregoli, T.W. Patterson, J.S. Yi, J. Deliang, M.L. Perry, T.D. Jarvi,
Electrochem. Solid-State Lett., 8 A273 (2005).
2. A. Iiyama, K. Shinohara, S. Iguchi, and A. Daimaru, in Handbook of Fuel Cells, W. Vielstich, H. Yokokawa, and H. A. Gasteiger, Editors, 6, p. 905, John Wiley & Sons, Ltd., West Sussex (2009).
3. A. Taniguchi, T. Akita, K. Yasuda, and Y. Miyazaki, J. Power Sources, 130, 42 (2004).
4. T. Ioroi, T. Akita, M. Asahi, S. Yamazaki, Z. Siroma, N. Fujiwara, K. Yasuda, J.
Power Sources, 223, 183 (2013).
5. S.-Y. Huang, P. Ganesan, and B. N. Popov, Applied Catalysis B: Environmental, 96, 224 (2010).
6. T. B. Do, M. Cai, M. S. Ruthkosky, T. E. Moylan, Electrochim. Acta, 55, 8013 (2011).
7. H. Chhina, S. Campbell, O. Kesler, J. Electrochem. Soc., 156, B1232 (2009). 8. A. Kumar and V. Ramani, ACS Catal., 4, 1516 (2014).
9. A. Masao, S. Noda, F. Takasaki, K. Ito, and K. Sasaki, Electrochem. Solid-State Lett., 12, B119 (2009).
10. Y. Chino, K. Taniguchi, Y. Senoo, K. Kakinuma, M. Hara, M. Watanabe, and M. Uchida, J. Electrochem. Soc., 162, F736 (2015).
- 42 -
11. E. Fabbri, A. Rabis, R. Kotz, and T. J. Schmidt, Phys. Chem. Chem. Phys., 16, 13672 (2014).
12. Y. Liu and W. E. Mustain, Electrochim. Acta, 115, 116 (2014).
13. H. Shintani, Y. Kojima, K. Kakinuma, M. Watanabe, M. Uchida, J. Power Sources, 294, 292 (2015)
14. M. Lee, M. Uchida, K. Okaya, H. Uchida, and M. Watanabe, Electrochemistry, 79, 381 (2011).
15. M. Hara, M. Lee, C.-H. Liu, B.-H. Chen, Y. Yamashita, M. Uchida, H. Uchida, and M. Watanabe, Electrochim. Acta, 70, 171 (2012).
16. H. Yano, T. Akiyama, P. Bele, H. Uchida, and M. Watanabe, Phys. Chem. Chem.
Phys., 12, 3806 (2010).
17. Y. Ishigami, K. Takada, H. Yano, J. Inukai, M. Uchida, Y. Nagumo, T. Hyakutake, H. Nishide, M. Watanabe, J. Power Sources, 196, 3003 (2011).
18. S. Kreitmeier, A. Wokaun, and F. N. Büchi, J. Electrochem. Soc., 159, F787 (2012). 19. A. Lamibrac, G. Maranzana, O. Lottin, J. Dillet, J. Mainka, S. Didierjean, A. Thomas and C. Moyne, J. Power Sources, 196, 9451 (2011).
20. J. Durst, A. Lamibrac, F. Charlot, J. Dillet, L. F. Castanheira, G. Maranzana, L. Dubau, F. Maillard, M. Chatenet, and O. Lottin, Appl. Catal. B-Environ., 138, 416 (2013).
21. R. D. Tarey, R. S. Rastogi, and K. L. Chopra, Rigaku J., 4, 11 (1987). 22. M. Watanabe, and S. Motoo, J. Electroanal. Chem., 60, 259 (1975). 23. M. Watanabe, and S. Motoo, J. Electroanal. Chem., 60, 275 (1975). 24. A. Z. Weber, and J. Newman, Chem. Rev., 104, 4679, (2004).
- 43 -
Acta, 123, 84, (2014).
26. Y.-C. Park, K. Kakinuma, M. Uchida, D. A. Tryk, T. Kamino, H. Uchida, and M. Watanabe, Electrochim. Acta, 91, 195 (2013).
27. M. Uchimura, S. Sugawara, Y. Suzuki, J. Zhang, and S. S. Kocha., ECS Trans., 16(2), 225 (2008).
28. H. Zhang, H. Haas, J. Hu, S. Kundu, M. Davis, and C. Chuy, J. Electrochem. Soc., 160, F840 (2013).
- 44 -
Chapter 3
Degradation Mechanisms of Carbon Supports under
Hydrogen Passivation Startup and Shutdown Process for
PEFCs
3.1 Introduction
In the last chapter, it has been investigated that the durability and degradation mechanisms of the Pt supported on carbon black (Pt/CB) catalyst layer (CL) both under accelerated startup (SU) conditions for fuel cell vehicles (FCVs), which included gas exchange (air-SU).1 It was found that two essential factors for the maintenance of cell performance under SU/shutdown (SD) conditions were the high corrosion resistance of the support material and the uniform dispersion of the Pt nanoparticles on the support. It was able to improve not only the cell performance but also the durability under air-SU conditions by use of a graphitized CB (GCB)-supported Pt catalyst prepared by the “nanocapsule method” (n-Pt/GCB) as the cathode material, compared with those for a cathode prepared with a commercial Pt/GCB.1 However the electrochemical active surface area (ECSA) for n-Pt/GCB still decreased by more than 50% after 1000 cycles of air-SU, compared with that before cycling.
In order to improve the SU/SD durability of polymer electrolyte fuel cells (PEFCs) in FCVs, the hydrogen passivation process (H2-SU/SD) has been proposed.2 In the SD
- 45 -
portion of this process, the O2 in the cathode is consumed by the H2 permeated from the
anode after the closing of the cathode gas valves at both the inlet and outlet, and then the supply of H2 is also stopped. In the SU process, the valves are re-opened, and then
the air and H2 are re-supplied to the cathode and anode, respectively. The H2-SU/SD
process prevents the construction of local cells, which cause the reverse current processes in the anode and cathode, and it also suppresses the severe carbon oxidation reaction (COR) and Pt aggregation that are observed during the air-SU/SD process. However, it was found that carbon corrosion still occurred during the H2-SU/SD process,
even though it was less severe than that during the air-SU/SD process. In this research, it was investigated the mechanism of the COR during the H2-SU/SD process as follows:
(1) the effect of the presence of Pt catalyst on the CO2 generation, (2) the timing of the
CO2 generation and (3) the effect of Pt oxidation state on the CO2 generation. A solution
to the problem of the carbon corrosion in the H2-SU/SD process is proposed, which is
- 46 - 3.2 Experimental
3.2.1 Preparation of catalyst-coated membranes (CCMs).
In order to investigate the effect of the presence of Pt on the carbon oxidation in the cathode, CCMs were constructed from CBs both with and without Pt catalysts (CB (Ketjenblack EC, Tanaka Kikinzoku Kogyo K.K.), Pt/CB (TEC10E50E, 47 wt-Pt%,
Tanaka Kikinzoku Kogyo K.K.)) on each side of the membrane. These two CCMs were designated as “Pt/CB//Pt/CB” and “Pt/CB//CB”, respectively. A commercial Nafion membrane (NRE 211, Dupont, 25 μm thickness) was used as the polymer electrolyte membrane (PEM). The CCMs were prepared in the same manner as reported in our previous work. Briefly, the catalyst pastes were prepared from each of the Pt-loaded carbon catalysts with Nafion binder (ion exchange capacity 0.9 meq g -1, DE521, E. I. Du Pont de Nemours & Co., Inc.), and the mass ratio of Nafion binder (dry basis) to CB (Nafion binder/CB) was adjusted to 0.7. The catalyst paste was directly sprayed onto the PEM to prepare the CCM by use of a pulse-swirl-spray apparatus (PSS, Nordson Co.), and then dried at 60 °C in an electric oven. The Pt loading amount was 0.50 ± 0.05 mg-Pt
cm−2. For two experiments, Pt-free CB CLs were used, and the loading amount of the CB layer was 0.56 ± 0.05 mg-CB cm −2, which was the same as that of the CB in the
Pt/CB CL. The active geometric area of the electrode was 29.2 cm2. The CCM was pressed at 140 °C and 1.0 MPa for 3 min. The CCM was sandwiched between two gas diffusion layers (GDLs, 25BCH, SGL Carbon Group Co., Ltd.) and was then assembled into a single serpentine pattern cell (Japan Automotive Research Institute (JARI) standard cell) containing two carbon separator plates.
- 47 -
3.2.2 Procedure of H2-SU/SD and experimental setup.
Fig. 3-1 shows the schematic of the cell with gas lines. Two solenoid valves were included, on the inlet and outlet of the cathode. The H2-SU/SD process was performed
under the gas conditions shown in Table 3-1 at 50 °C. These gases were humidified at 30% relative humidity (RH) by use of heated water bubblers, controlled by a measurement system (FCE-1, Panasonic Production Technology). In step 1, H2 and
CO2-free artificial air (N2 80%; O2 20%), were supplied to the anode and cathode,
respectively. In step 2, both solenoid valves were closed in order to seal off the cathode as the SD step. In step 3, both solenoid valves were opened in order to supply the air to the cathode as the SU step. These three steps were defined as one “air-air” cycle. During the early air-air cycles, amorphous portions of the CB particles can easily be oxidized, and the CO2 concentration in the cathode exhaust, which was generated during the
air-air cycles, decreased with increasing number of cycles. It was confirmed that the CO2 concentration did not change greatly after 100 cycles. Therefore, all data for the
H2-SU/SD durability evaluations were obtained after 99 air-air cycles. The CO2
concentration in the cathode exhaust was measured by use of a non-dispersive infrared (NDIR, GMP343, Vaisala) detector on the downstream side of the solenoid valve on the cathode outlet. Thus, the total amount of CO2 generated in steps 2 and 3 was measured
after both solenoid valves were opened. In order to investigate the effects of O2 on the
COR in step 2, N2 was supplied to the cathode during the first step. These three steps
were defined as one N2-air cycle, as shown in Table 3-1. From a comparison of the
results between the air-air cycles and the N2-air cycles, it is able to separate the values
- 48 -
Figure 3-1. Schematic of the cell with gas lines equipped with two solenoid valves and a non-dispersive infrared (NDIR) detector.
Table 3-1. Conditions of anode and cathode gas for both the air-air cycle (H2-SU/SD
- 49 -
3.2.3 Holding of the cathode potential in step 2 of the air-air cycles.
The cathode potential was decreased at a scan rate of 50 mV s -1 and then held at various potentials from 0.6 V to 1.0 V in steps of 0.1 V during step 2 of the air-air cycles (Ehold) in order to investigate the influence of the Pt oxidation-state upon the oxidation
amount of the CB. The cathode potential was controlled with a potentiostat (HZ-5000 Automatic Polarization System, Hokuto Denko Co.). The anode was used as both reference electrode and counter electrode. The cathode potential increased after the cell was switched to open circuit at the end of step 2.
3.2.4 Procedure of CCM evaluation for durability and electrochemical properties. The ECSA of the Pt catalyst in the cathode was evaluated both before and after 100 H2-SU/SD cycles by use of cyclic voltammetry (CV). The CV was measured between
0.075 V and 1.0 V at a scan rate of 20 mV s -1 with a potentiostat both at 40 °C (100% RH) and 50 °C (30% RH), with H2 in the anode and N2 in the cathode. The anode was
used as both reference electrode and counter electrode. The value of ECSA was determined from the hydrogen adsorption charge (QPt-H), referred to ΔQH° = 0.21 mC
cm−2, the value used conventionally for polycrystalline platinum.3 The electric charge for Pt oxidation (QPt-oxidation) was obtained by integration of the anodic peak area (ca. 0.6
V to 1.0 V) and was corrected for the anodic baseline of the electric double layer capacitive (EDLC) current of the voltammogram. The electric charge for the Pt oxide reduction (QPtO-reduction) was obtained by the integration of the cathodic peak area (1.0 V
to each final potential, to 0.6 V in steps of 0.1 V), with correction for the cathodic baseline of the EDLC current. The current-potential (I-E) curves were measured both before and after the 100 H2-SU/SD cycles galvanostatically supplied to the anode and
- 50 -
the cathode by use of an electronic load (PLZ-664WA, Kikusui Electronics Co.) operated in the constant current mode (5 min acquisition at each current), controlled by a measurement system (FCE-1, Panasonic Production Engineering Co.) at 65 °C with 100% RH H2 and air under ambient pressure (1 atm) with gas utilizations of 70% and
40%, respectively.
3.3 Results and discussion
3.3.1 Comparison of the extent of carbon oxidation during air-SU/SD and H2-SU/SD.
Concentrations of CO2 generated in the cathode of a cell using Pt/CB for both the
anode and cathode were measured during the air-SU/SD and H2-SU/SD cycling. The
steps of the air-SU/SD process, in which air and H2 are alternately supplied to the anode
and artificial air is continuously supplied to the cathode, are shown in Table 3-2.1 Fig. 3-2(a) shows the changes of both the cell voltage (Ecell) and CO2 concentration at the
100th cycle during the air-SU/SD and H2-SU/SD processes (air-air cycle in Table 3-1).
In step 1 of the air-SU/SD process, the Ecell decreased immediately after the air feed was
initiated and approached 0 V, and the CO2 concentration temporarily increased to about
30 ppm. In step 2, the Ecell increased to over 1.1 V after the H2 was initiated, and the
CO2 concentration increased again nearly simultaneously, reaching 133 ppm and then
decreasing to 0 ppm. These phenomena were caused by the COR in the cathode outlet region as a result of the depletion of H+ due to their consumption in the anode outlet region for the ORR, which is the well-known reverse current phenomenon. In the H2-SU/SD process, the Ecell gradually decreased from 1.0 V to 0.15 V after both valves
- 51 -
were closed in step 2. This voltage decrease was caused by O2 consumption in the
cathode, due to reaction with the H2 permeating from the anode to cathode through the
membrane. The permeation rate of H2 obtained from linear sweep voltammetry was
0.86 mA cm-2 at 50 oC and 30% RH under ambient pressure with H2-supplied anode and
N2-supplied cathode. The total volume of remaining O2 was 3.3 mL, which was
calculated as the sum of the volumes of the channel of the cell (1.5 mL), of the gas lines between the cell and valves (1.3 mL), of the GDL (0.5 mL), and of the CL (26.2 µL). Thus, the estimates for the time required to react the remaining O2 were 7.4 min. for the
total volume and 1.2 min. for the sum of the volumes of the GDL and CL. The actual time during the H2-SU/SD cycles (12.0 min.) was longer than that estimated for the
consumption of O2 in the total volume in Fig. 2(a). It is considered that this difference
was caused by the delay of O2 diffusion into the CL from the channel. In step 3 of the
H2-SU/SD process (artificial air resupplied), the Ecell rose to 1.0 V after the valves were
opened and air was introduced to the cathode. The gas volumes of the channel of the cell, the CL and the GDL were 1.5 mL, 26.2 µL and 0.5 mL, respectively. The air flow rate was 100 ml/min. Thus, the air-front passage time was estimated to be 1.2 s. The CO2 concentration nearly simultaneously increased to 28 ppm and then decreased to 0
ppm. Fig. 2(b) shows the weight ratios of the oxidized CB to the total CB in the CL at the 100th cycle during both the air-SU/SD and H2-SU/SD processes, which were
calculated from the CO2 peak areas in Fig. 2(a). It was found that the carbon oxidation
in the H2-SU/SD process was only one-eighth of that in the air-SU/SD process, and thus
- 52 -
Table 3-2. Conditions of anode and cathode gas for the air-SU/SD cycle.32
Figure 3-2. (a) Changes of the Ecell and CO2 concentration and (b) ratio of the oxidized
- 53 -
Fig. 3-3(a) shows cathode CVs at 40 oC obtained before and after 100 H2-SU/SD cycles.
The cathode ECSA decreased about 13 % to 60 m2 g-1 from the initial value 69 m2 g-1 (Fig. 3-3(b)). Fig. 3-4(a) shows the I-E curves at 65 oC obtained before and after the H2-SU/SD durability evaluation. The MA at 0.85 V decreased about 26% to 102 A g-1
from the initial value 137 A g-1 (Fig. 3-4(b)). It is considered that the degree of the carbon corrosion occurring during the H2-SU/SD cycling cannot be ignored for the
long-term operation of FCVs, because the extent of oxidative degradation (55 ppm after 100 cycles) during the H2-SU/SD process would be expected to lead to a 5.5%
degradation after 1,000 cycles, and the degradations of the ECSA and MA even at 100 cycles were approximately 13% and 26%, respectively.
- 54 -
Figure 3-3. (a) CVs at 40 °C with 100% RH N2 in the cathode and 100% RH H2 in the
anode and (b) ECSA changes determined from the QPt-H of CVs shown in (a) both
- 55 -
Figure 3-4. (a) I-E curves at 65 °C with 100% RH H2 in the anode and air in the cathode