COMPREHENSIVE ASSESSMENT OF DROUGHT, ITS
IMPACTS AND MITIGATION STRATEGIES IN A
DROUGHT PRONE AREA OF INDIA
(
ン
の旱魃頻発地域における渇水とその影響及び
軽減策の包括的評価)
山梨大学大学院
医学工学総合教育部
博士課程学位論文
2015
年 9 月
Dedicated to my Guru (Professors),
my beloved parents, wife and daughter.
, | प , ||
"Guru Brahma Guru Vishnu Guru Devo Maheshwara, Guru Sakshat Param Brahma
Tasmai Shri Gurave Namah"
(Meaning: Guru (teacher) is verily the representative of Brahma, Vishnu and Shiva. He creates, sustains knowledge and destroys the weeds of ignorance. I salute such a Guru.)
i
ABSTRACT
About 40% of the Maharashtra State falls under drought prone area (DPA), having annual average rainfall less than 750 mm. Agriculture (e.g. rainfed cropping, livestock) is a major source of income generation of over 64% of the state’s population. Drought typically occurs in the state once every 5 years. About 80% of drinking water sources in the state come from groundwater. The groundwater in the state acts as a buffer for long-term rainfall and surface water shortage. The average residence time of the shallow and accessible groundwater in the state is less than four years. Therefore, prolonged droughts (i.e. greater than two years duration) or consecutive years of reduced monsoon rainfall severely threaten livelihoods. Still, few studies have endeavored to identify drought impacts at the local and regional scale. There is a need for region specific, local level analysis to evaluate the agronomic and economic impacts of drought. Also, in the state of increasing drought impacts, it is important to inform policy makers on the causes of drought, its impacts, various adaptation responses and possible mitigation measures perceived at local levels in order to alleviate human sufferings. The concept of providing short-term drought relief without much reference to the major constraints and problems does not significantly help the region or the poor. Hence understanding micro level i.e. village and household level drought impacts are equally important as of macro level (national) impacts, in order to identify the most appropriate, effective and efficient responses that could be taken by national, state or local governments to build self reliance and preparedness to mitigate drought.
In this background the objectives of present study are to assess drought, its local socio-economic-environmental impacts, adaptation and mitigation strategies, and to prepare drought risk map using drought hazard and vulnerability indices. The framework of this study is applied in a drought prone catchment (the Upper Bhima Catchment) of Maharashtra State. Secondary data from various sources and primary data were collected (during drought 2012-13) by interviewing 223 households from farming community and 22 focus group discussions from 22 villages. Also, eighteen drinking (pot) water samples were collected and analyzed in a laboratory by Ion Chromatography. The Standardized Precipitation Index (SPI) is used for drought characterization. Water availability and use were estimated through a pilot study. The statistical analysis of interview results was done in SPSS software package and MATLAB by using descriptive and inferential statistics. Key drought vulnerability factors were identified from qualitative and quantitative analysis of questionnaire data and from secondary literature. The risk of drought was estimated by multiplication of drought hazard and vulnerability.
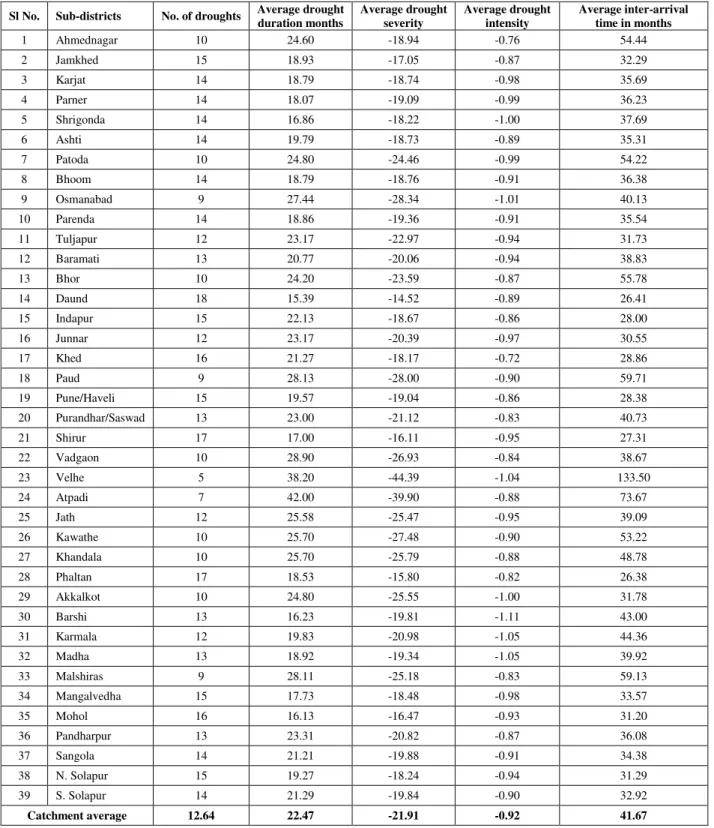
Being a drought prone area, the Upper Bhima Catchment always suffers recurrent drought events. The average recurrence time between two consecutive drought events in the catchment is 41.67 months with average drought duration of 22.47 months. It is seen that the
ii
society is somehow resilient to drought of short duration (less than 1 year) due to groundwater use (which acts as buffer to deficient rainfall), but still it affects agricultural production to large extent due to large percentage of rainfed cropping systems. The situation of water scarcity deteriorates if a drought lasts for two years or more. The surface water unavailability and declined groundwater levels make it impossible to withstand the water scarcity situation in the catchment causing heavy damage to agriculture, its allied activities and domestic water supply. A recent extremely dry drought, which commenced in 2011 and further deteriorated in 2012, had devastating impacts on domestic water supply, agricultural production and socio-economic activities of rural farming community.
The results of the study show that decrease in yield of cereals, horticultural crops, livestock production and loss of employment, all associated with decreased income of farmers, were the most immediate economic impacts of drought. Social impacts such as population migration, impacts on health and schooling of children, hopelessness and sense of loss, conflicts in society for water, and malnutrition due to changed food preferences were also reported. The environmental impacts such as increases in average atmospheric temperature, pasture-forest degradation, deteriorated water quality, damage to fish habitat-wild life, and groundwater depletion were perceived by farmers to high extent. On an average a respondent household suffered a loss of about 86% in production of major crops. High reduction in on-farm unskilled employment opportunities and increase in unskilled labor in off-farm rural employment activities were reported. It was found that about 69% of respondents were availing loans and 79% of them delayed repayment of loans due to the consequences of drought. The results indicated that the extent of drought damage varied based on households’ size, annual income, landholding size, irrigation extent, and drought intensity. The effects of these factors on community’s drought resilience were reported with empirical evidences. Respondent with large family size, low to marginal land holding size, low income, and low irrigation extent or rainfed farming systems found to be more vulnerable to drought impacts and special attention should be given towards increasing their resilience while designing drought management strategies.
As a consequence of drought, access to domestic water supply was cumbersome and time spent for water collection activities was almost doubled than that of year with normal rainfall. The large size and low income households found to be more vulnerable to drought impacts in terms of domestic water collection activities as compared to households with small size and high income. Drinking water was supplied to the drought affected areas with government and private water supply tankers, however the amount of water supplied per capita was far below the requirement (40 litres per capita per day). Dried up or low yielding dug wells and borewells, tanker water supply from remote sources, untimely water supply, and deteriorated water quality were the major problems reported during droughts. In addition to the rural drinking water availability, quality of water was major concerning issue identified during
iii
drought and found neglected by local administration. Serious contamination of drinking water with nitrate-nitrogen (and fluoride in few cases) is found in the analyzed samples.
To mitigate the drought impacts farmers used various drought preparedness and adaptation measures. With anticipated drought, farmers stored crop harvest (grains), stored crop residues for livestock, saved money, migrated for employment, sold livestock for income generation (because they were unable to provide food and water for the livestock), and sought alternative sources of income. As a part of autonomous adaptation, considerably small proportion of farmers adopted variety of agricultural adaptations. These included changing their crop calendar, changing to low water consuming crops, keeping land unsown when there is possibility of drought, changing traditional irrigation practices to sprinkler, drip irrigation, water harvesting through farm pond, water storing structures etc. and reducing wastage of water during drought years. There was lack of knowledge and awareness of these potential adaptation practices observed. Also less or no education, small land holding size and less income were other constraints observed in adoption of these adaptation strategies. Farmers with high land holding size and high income are more likely to adopt various adaptation strategies. Besides household level adaptation measures, administrative strategies played a very crucial role in adapting to drought. As a response to serious drought events in the state, the government has undertaken various relief measures such as provision of employment, supply of drinking water and distribution of fodder in cattle camps, compensations to agricultural damage or crop insurance schemes, agricultural loans with low interest rates, and waived electricity bills. It was observed that the major mitigation measures provided relief to affected households to some extent, but the level of satisfaction was still low amongst farmers due to ineffective planning and management, which needs better governance.
In order to evaluate at local/sub-district level drought risk in the Upper Bhima Catchment, we calculated drought hazard by a simple index (probability of seasonal rainfall below 75% of long term average). The vulnerability to drought is obtained by identifying local/region specific socio-economic indicators (available and quantifiable) which has direct relation with adaptive capacity. Drought risk is obtained by multiplying hazard and vulnerability indices at sub-district levels. From obtained results, we developed index-based maps to assess spatial drought hazard, vulnerability, and risk. Study found that the sub-districts from scarcity zone (middle and lower reaches) of the catchment) found to be at higher drought risk in comparison with sub-districts from far upper reaches of the catchment and there is a need to prioritize development and drought proofing activities in these sub-districts in order to increase their drought resilience. Similar methodology can be used to identify sub-districts of Maharashtra State (total 353 sub-districts), which are more vulnerable and at a greater risk of drought for prioritizing development and drought proofing activities and to design location specific mitigation strategies.
iv
Based on findings, the study recommends various strategies to improve the farmers’ resilience and to encourage farmers and governments to combat future droughts. Studies emphasizing policies which can be implemented in the short- to medium-term, to reduce the length of time taken by farming community to recover the loss and productive capacity after a drought event needs to be carried out. The study highlights a need of future research in the development of effective drought monitoring, early warning systems, effective impact assessment, pro-active risk management, drought preparedness plans and effective emergency response programmes to reduce drought risk in DPAs of India.
v ACKNOWLEDGEMENTS
I express my sincere gratitude to my previous supervisor, Assoc. Prof. Yutaka Ichikawa (currently affiliated with Kyoto University, Japan). Without his guidance and persistent help, this dissertation would not have been possible. Also I sincerely thank him for his continuous help throughout my stay in Japan. I express my sincere thanks to my supervisor, Assoc. Prof. Hiroshi Ishidaira for his help throughout my studies. I am earnestly indebted to both supervisors for their positive support and encouragements for the active participation in national and international conferences, internships, and training programs during my doctoral studies.
I would like to thank my dissertation committee members, Prof. Futaba Kazama, Prof. Tadashi Suetsugi, Prof. Junko Shindo, and Prof. Masutani Keiichi for their time to time precious guidance, feedbacks and suggestions in my research at University of Yamanashi, Japan. I am thankful to Prof. Futaba Kazama and Asst. Prof. Takashi Nakamura for motivating and helping me with water quality aspects of this research work. I am also thankful to Asst. Prof. Jun Magome and Dr. Wang Jie for their continuous technical support while being one of the members of Hydro-engineering laboratory at International Research Center for River Basin Environment (ICRE).
I express my sincere thanks to Assoc. Prof. Kei Nishida for his encouragement and arrangements in shortest possible way to participate in an internship at University of Newcastle, Australia, which enhanced my understanding of drought research. I am also thankful to Dr. Anthony Kiem (University of Newcastle, Australia) for supporting my internship for his guidance in my doctoral research and Prof. Sudhindra Nath Panda (Indian Institute of Technology, Kharagpur) for providing useful data for this research. I express my sincere gratitude to Prof. Sakamoto Yasushi, Assoc. Prof. Souma Kazuyoshi and Asst. Prof. Sano Testuya, for their positive suggestions in research group seminars.
I express my sincere thanks to Dr. Sujata Manandhar (Tohoku University, Japan) for her continuous guidance and support during my doctoral studies. I am also thankful to Mr. Ning Shaowei for discussing new ideas and planning future research activities based on current study.
I express my heartfelt gratitude to my M. Eng. supervisor, Assoc. Prof. Sangam Shrestha (Asian Institute of Technology, Thailand) for his precious guidance to pursue doctoral studies at University of Yamanashi, Japan and his strong recommendation for the same. I am thankful to the ICRE management committee for recommending me to Ministry of Education, Culture, Sports, Science and Technology (MEXT-Monbukagakusho) Scholarship Program and also thankful to the MEXT program for providing scholarship for this research. I am very
vi
much grateful to all the staffs of ICRE including Ms.Wakae Sano, Ms. Ishihara Maki, Ms. Yoko Takano, Ms. Mayumi Sano and Ms. Sachiko Murayama for their academic and logistic support.
I express my heartfelt thanks to Dr. Vishnu Prasad Pandey, Dr. Temur Khujanazarov, Dr. Risky Ayu Kristanti, Dr. Do Thu Nga, Dr. Dao Nguyen Khoi, Dr. Sujan Shrestha, Dr. Salina Shrestha, Dr. Thushara Wickramaarachchi, Dr. Masakazu Hashimoto, Dr. Sadhana Shrestha, Dr. Deeptha Amarathunga, Dr. Li Yan, Dr. Hasti Widyasamratri and Dr. Heng Sokchhay for their precious suggestions and moral support for this research work.
I am also thankful to all my friends- Mr. Ning Shaowei, Ms. Hieu Thi Bui, Ms. Phuong Mai Nguyen, Mr. Nguyen Minh Vuong, Ms. Nguyen Y Nhu, Mr. Tatsuru Kamei, Mr. Ebata Kazunori, Mr. Shankar Shrestha, Mr. Bhesh Raj Thapa, Mr. Luis Alfaro, Ms. Hein, Ms. Rawintra Eamrat , Mr. Bikesh Malla, Ms. Nurul Nadiah Binti Norzon, Mr. Yuya Takabe, Mr. Tomoaki Kozono and Mr. Takehiro Okamoto, whose positive support helped me to achieve this study and who made my pleasant stay in Japan. I am thankful to Dr. Raman Kumar Singh for his continuous guidance and support throughout my stay in Japan. I express my sincere gratitude to all members of ICRE for their love and support throughout my stay in Japan.
vii CONTENTS ABSTRACT ... i ACKNOWLEDGEMENTS ... v CONTENTS... vii LIST OF FIGURES ... xi LIST OF TABLES ... xv
LIST OF ABBREVIATIONS ... xvii
CHAPTER 1: INTRODUCTION ... 1
1.1 Background ... 1
1.2 Statement of problems ... 3
1.3 Need of research ... 5
1.4 Objectives and scope ... 7
1.5 Organization of the dissertation ... 8
CHAPTER 2: LITERATURE REVIEW ... 11
2.1 Background ... 11
2.2 Types of drought ... 11
2.3 Drought indices ... 13
2.3.1 Percent rainfall deficit ... 13
2.3.2 Deciles... 14
2.3.3 Standardized Precipitation Index (SPI) ... 15
2.4 General drought impacts and response strategies ... 16
2.5 Highlights of impacts of drought 2012 in Maharashtra State ... 19
2.6 Previous literatures on assessment of drought impacts and response strategies ... 21
CHAPTER 3: METHODOLOGY ... 25
3.1 Research framework ... 25
3.2 Materials and methods ... 26
3.2.1 Instruments ... 26
3.2.2 Procedure ... 26
3.2.3 Data analysis ... 28
viii
3.3.1 Location ... 30
3.3.2 Climate and rainfall... 31
3.3.3 Land use ... 32
CHAPTER 4: CHARACTERIZATION OF DROUGHT AND WATER SCARCITY . 33 4.1 Background ... 33
4.2 Drought characterization ... 34
4.2.1 Rainfall deviations ... 34
4.2.2 Standardized Precipitation Index ... 37
4.3 Assessing water scarcity through a pilot study ... 43
4.3.1 Background ... 43
4.3.2 Materials and methods ... 43
4.3.3 Data analysis ... 44
4.3.4 Results ... 47
4.4 Summary ... 50
CHAPTER 5: QUALITATIVE ASSESSMENT OF DROUGHT IMPACTS AND MITIGATION STRATEGIES ... 51
5.1 Background ... 51
5.2 Profile of the farming households ... 52
5.3 Perception of drought and its impacts ... 53
5.3.1 General perception of drought ... 53
5.3.2 Perception of socio-economic impacts ... 54
5.3.3 Perception of environmental impacts... 58
5.4 Adaptation and mitigation measures ... 60
5.4.1 Household level adaptations ... 60
5.4.2 Administrative mitigation measures ... 64
5.5 Summary ... 69
CHAPTER 6: QUANTITATIVE ASSESSMENT OF DROUGHT IMPACTS ... 73
6.1 Background ... 73
6.2 Impacts of drought on domestic water supply ... 75
6.3 Impacts of drought on crop production ... 79
ix
6.5 Impacts of drought on household income and indebtedness ... 87
6.6 Summary ... 91
CHAPTER 7: RURAL DRINKING WATER ISSUES DURING DROUGHT ... 95
7.1 Introduction ... 95
7.2 Research design ... 96
7.2.1 Study area... 96
7.2.2 Materials and methods ... 97
7.3 Results and discussion ... 98
7.3.1 Status of water resources during a drought ... 98
7.3.2 Impacts of drought on rural domestic water supply ... 100
7.3.3 Tanker water delivery as reactive mitigation measure ... 104
7.3.4 Drinking water quality during drought year ... 105
7.4 Summary ... 108
CHAPTER 8: DROUGHT RISK ASSESSMENT ... 109
8.1 Background ... 109
8.2 Drought hazard ... 111
8.3 Drought vulnerability ... 113
8.4 Drought risk... 116
8.5 Summary ... 117
CHAPTER 9: SUMMARY OF THE STUDY ... 119
9.1 Summary ... 119
9.2 Findings and conclusions ... 120
9.3 Recommendations and scope for future research ... 124
REFERENCES ... 127
APPENDIX A: QUESTIONNAIRE ... 143
xi LIST OF FIGURES
Figure 1.1 Number of drought disasters as recorded by EM-DAT 1974–2004 (Source:
Adapted from UNISDR, 2009 [10]). ... 2
Figure 1.2 Districtwise annual average rainfall for Maharashtra State. ... 4
Figure 1.3 Why to assess drought impacts? ... 6
Figure 1.4 Structure of dissertation. ... 9
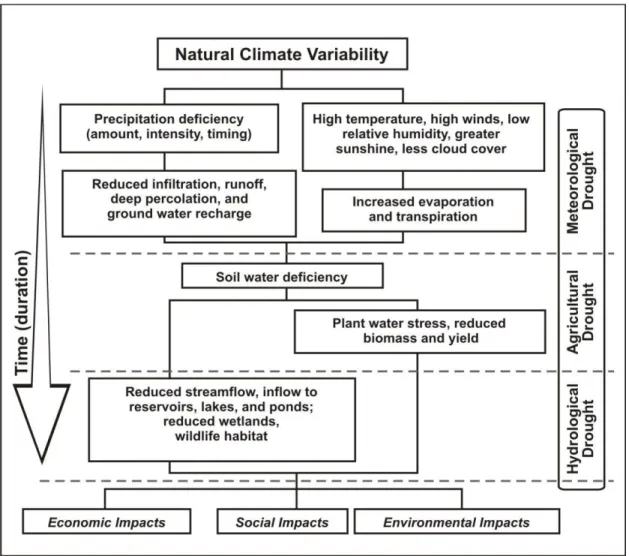
Figure 2.1 Sequence of drought occurrence and impacts for commonly accepted drought types (Source: National Drought Mitigation Center, University of Nebraska-Lincoln, U.S.A.) [43] ... 12
Figure 2.2 Explanation of terms used for drought characterization by using SPI. ... 16
Figure 3.1 Research framework. ... 25
Figure 3.2 Location map of the Upper Bhima Catchment in the Maharashtra State of India. ... 31
Figure 4.1 Divisions of Maharashtra State and location of the study area. ... 33
Figure 4.2 Spatial distribution of average annual rainfall from 1951-2012... 34
Figure 4.3 (a) Average annual rainfall (mm) and (b) deviation from 62 years average annual rainfall for the Upper Bhima Catchment. ... 35
Figure 4.4 The 12-months SPI (1951-2012) for (a) Central Maharashtra and (b) Marathwada divisions of Maharashtra State. ... 38
Figure 4.5 The SPI (12-months time scale) for Ahmednagar station. ... 38
Figure 4.6 Drought characterization for sub-districts located in the Upper Bhima Catchment a) number of drought events (b) average drought duration in months (c) average drought severity (d) average drought intensity and (e) average inter-arrival time between consecutive droughts in months over the period of 1951-2012 (applied natural breaks classification with 4 classes). ... 41
Figure 4.7 12 months SPI for the Upper Bhima Catchment over the period 1951-2012. ... 42
Figure 4.8 Spatial distribution of drought over the Upper Bhima Catchment in September 2012... 42
Figure 4.9 GWL fluctuations and response to rainfall. ... 45
Figure 4.10 (a) Comparing groundwater abstraction and recharge (b) stage of groundwater development (I7). ... 48
Figure 4.11 Stage of groundwater development in sub-districts of the Upper Bhima Catchment during 2004 (Source: GSDA [104]). ... 49
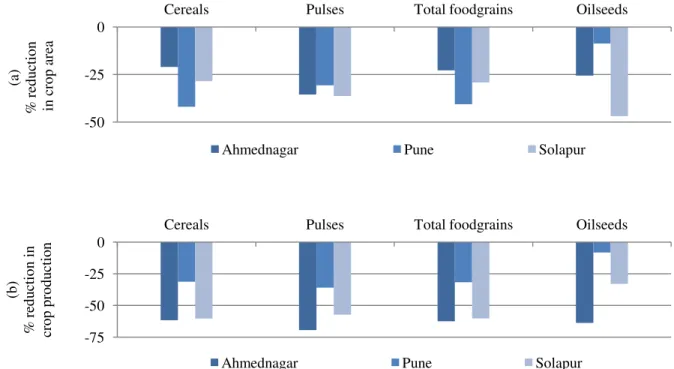
Figure 5.1Farmers’ perceived drought impacts in the Upper Bhima Catchment (n = 223). 54 Figure 5.2 Percent reduction in (a) cropped area and (b) production for the year 2012-13 compared to average of 2005-06 to 2010-11 in districts which falls either completely or partially in the Upper Bhima Catchment [132]... 55
xii
Figure 5.3 Example of kharif (monsoon) crops affected due to weak monsoon 2012 (a) Maize crop started wilting (Karjat Taluka, Central Maharashtra) and (b) a farmer destroying cotton crop due to poor growth (Shrigonda Taluka, Central Maharashtra). ... 55 Figure 5.4 (a) Sugarcane crop (Shrigonda Taluka, Central Maharashtra) and (b) Citrus fruit garden (Ahmednagar Taluka, Central Maharashtra) impacted by the drought 2012. ... 56 Figure 5.5 Farmers’ perception of various socio-economic impacts in the Upper Bhima Catchment (n = 223). ... 57 Figure 5.6 Farmers’ perception of various environmental impacts in the Upper Bhima Catchment (n = 223). ... 59 Figure 5.7 Drought preparedness measures adopted by farmers in the Upper Bhima Catchment (n = 223). ... 61 Figure 5.8 Major agricultural adaptation measures adopted by farmers in the Upper Bhima Catchment (n = 223). ... 62 Figure 5.9 Example of successful adoption of drip irrigation for (a) cotton crop during kharif 2012 (Karjat Taluka, Central Maharashtra) and (b) Papaya fruit garden during summer 2013 (Solapur Taluka, Central Maharashtra). ... 63 Figure 5.10 Example of employment generation by government during drought under rural employment act 2005 (Karjat Taluka, Central Maharashtra). ... 65 Figure 5.11 Level of satisfaction amongst beneficiaries about Government drought mitigation measures in the Upper Bhima Catchment. ... 66 Figure 5.12 Example of rural drinking water supply during a drought year: (a) tanker drops water into the well and villagers take water with the help of rope bucket, which is not only cumbersome but also makes the water dirty (Indapur Taluka, Central Maharashtra) and (b) example of private water supply tanker (Haveli Taluka, Central Maharashtra). ... 67 Figure 5.13 Example of government funded cattle camps during drought year (a) cattle and (b) water supply in the cattle camp (Ashti Taluka, Marathwada). ... 68 Figure 6.1 Comparison of normal- and drought-year domestic water collection activities. .. 76 Figure 6.2 (a) Area under different crop types and (b) crop calendar of Kharif (rainy) and
Rabi (winter) season crops grown in the Upper Bhima Catchment. ... 80 Figure 6.3 Comparative histograms for normal- and drought-year production of major Kharif and Rabi season crops ... 81 Figure 6.4 Comparative histograms for normal- and drought-year on- and off-farm employment activities. ... 86 Figure 6.5 Comparison of normal- and drought-year income, loans availed, and their source and purpose. ... 89 Figure 7.1 Location of the Upper Bhima Catchment and randomly selected villages for FGDs. ... 97
xiii
Figure 7.2 Annual rainfall averaged over the Upper Bhima Catchment for the period 1998-2013. Average annual rainfall over the Catchment during the period was 679 mm (shown by the horizontal red line). ... 99 Figure 7.3 Percentage of live storages of the representative major irrigation projects in the Upper Bhima Catchment. The storage capacities are presented in millions of m3 (Mcum), shown in parentheses. ... 99 Figure 7.4 Groundwater levels in the Upper Bhima Catchment (November of 2010 to May of 2013). ... 100 Figure 7.5 Sub-district wise distribution of rural households’ (a) sources of drinking water and (b) distances to water supply sources. ... 101 Figure 7.6 (a) The number of villages and hamlets provided with tanker water deliveries and (b) the number of water delivery tankers deployed to the districts fully or partially located in the Upper Bhima Catchment during peak water scarcity in the pre-monsoon season... 104 Figure 8.1 Sub-districts and districts fully or partially located in the Upper Bhima Catchment. ... 110 Figure 8.2 DHI map for sub-districts of the Upper Bhima Catchment. ... 113 Figure 8.3 Drought vulnerability map for sub-districts of the Upper Bhima Catchment. ... 116 Figure 8.4 Drought risk map for sub-districts of the Upper Bhima Catchment... 117
xv LIST OF TABLES
Table 1.1 Number of droughts and their impacts sorted by continent during 1900 to 2014.... 1
Table 1.2 Top ten most important drought disasters for the period 1900 to 2014 sorted by numbers of people affected at the country level. ... 2
Table 2.1 List of major drought indicators used for drought monitoring. ... 14
Table 2.2 Drought classification based on deciles. ... 14
Table 2.3 SPI drought category. ... 15
Table 2.4 Classification of drought impacts. ... 17
Table 3.1 Data type and sources... 28
Table 4.1 Drought events based on rainfall deviation from long term average annual rainfall (Fill: Dark red- severe drought; Orange-moderate drought; Gray- 0 to 25% below normal rainfall). ... 36
Table 4.2 Drought characteristics for Ahmednagar sub-district based on SPI (1951-2012). 39 Table 4.3 Drought characteristics for sub-districts of the Upper Bhima Catchment averaged over 1951-2012. ... 40
Table 4.4 Summary of groundwater indicators in the Dhubdhubhi Watershed. ... 48
Table 5.1 Socio economic characteristics of farming households in the Upper Bhima Catchment. ... 52
Table 5.2 Farmers’ perception of various socioeconomic impacts in the Upper Bhima Catchment (asymptotic significance values, n = 223). ... 58
Table 5.3 Farmers’ perception of various environmental impacts in the Upper Bhima Catchment (asymptotic significance values, n = 223). ... 60
Table 5.4 Drought preparedness measures adopted by farmers in the Upper Bhima Catchment (asymptotic significance values, n = 223). ... 61
Table 5.5 Major agricultural adaptations adopted by farmers in the Upper Bhima Catchment (asymptotic significance values, n = 223)... 64
Table 5.6 NREGA employment act and households responses in the Upper Bhima Catchment. ... 65
Table 6.1 Descriptive and inferential statistics for water-fetching activities during normal and drought years. ... 76
Table 6.2 Comparison of domestic water collection activities across different respondent groups. ... 78
Table 6.3 Descriptive and inferential statistics for normal- and drought-year production of major Kharif and Rabi season crops. ... 82
Table 6.4 Comparison of normal- and drought-year production of major Kharif and Rabi season crops across respondent groups. ... 83
xvi
Table 6.5 Descriptive and inferential statistics for on- and off-farm rural employment activities during normal and drought years. ... 85 Table 6.6 Comparison of normal- and drought-year rural employment activities across respondent groups. ... 87 Table 6.7Descriptive and inferential statistics for households’ financial status during normal and drought years. ... 88 Table 6.8 Comparison of annual household income during normal- and drought-year and loan amount across respondent groups. ... 90 Table 6.9 Kendall's Tau correlation matrix. ... 91 Table 7.1 The primary and secondary data type and their sources. ... 98 Table 7.2 Public drinking water supply sources during normal and drought years and problems in the villages as reported in the FGDs (May of 2013). ... 103 Table 7.3 Tanker water delivery characteristics of the villages that participated in the FGDs (May of 2013). ... 105 Table 7.4 Results of ion chromatography. ... 107 Table 8.1 Probability of drought based on IMD definition. ... 112
xvii LIST OF ABBREVIATIONS
DHI Drought Hazard Index DPA Drought Prone Area DRI Drought Risk Index
DVI Drought Vulnerability Index EM-DAT Emergency Events Database FAO Food and Agriculture Organization FGDs Focus Group Discussions
GDP Gross Domestic Product
GEC Groundwater Estimation Committee
GSDA Groundwater Survey and Development Agency
ICRE International Research Center for River Basin Environment IMD India Meteorological Department
IPCC Intergovernmental Panel on Climate Change
MRSAC Maharashtra Remote Sensing and Application Center NDMC National Drought Mitigation Center
NREGA National Rural Employment Guarantee Act SPI Standardized Precipitation Index
UNESCO United Nations Organization for Education, Science and Culture UNISDR United Nations International Strategy for Disaster Reduction WHO World Health Organization
1
CHAPTER 1: INTRODUCTION
1.1 Background
A warmer climate with increasing climate variability will increase the risk of climate extremes [1, 2]. This will consequently alter the magnitude, frequency, duration and spatial extent of natural hazards such as flood and drought. Among all the natural hazards, drought ranks first in terms of the number of people directly affected [3, 4, 5]. Drought is a creeping phenomenon, difficult to understand and define due to differences in hydro-meteorological variables and socio-economic factors along with the stochastic nature of water demand in various regions of the world [5]. Although specific definitions of drought may vary by sector and region, it is basically an extended period of months or years, in which precipitation is less than the annual average, resulting water scarcity. Generally droughts are classified as either a meteorological drought (lack of precipitation over a region for a period of time), hydrological drought (a period with inadequate surface and sub-surface water resources), agricultural drought (a period with declining soil moisture and consequent crop failure due to lack of surface water resources) or socio-economic drought (failure of water resources systems to meet water demands, which impacts human activities both directly and indirectly) [1, 5, 6, 7].
According to EM-DAT database [8], about 646 drought events recorded across the world during 1900 to 2014 killing 11.7 million people and affecting 2.17 billion people (Table 1.1). The total economic damage caused due to these drought events were reported to be US$133.01 Billion. Asia ranks first in case of number of people killed (9.67 million) and affected (1.71 billion) by drought disasters causing economic damage of about US$34.25 billion. From Table 1.2 it can be seen that India and China are the hardest hit countries in terms of numbers of people affected for top 10 drought disasters during 1900-2014. The worst drought in India (Jul-2002) and China (Jan-1994) affected 300 and 82 million people respectively.
Table 1.1 Number of droughts and their impacts sorted by continent during 1900 to 2014.
Sr.No. Continent No. of Events No. of People Killed No. of people affected Damage (1000
1 Asia 153 9,663,389 1,712,836,029 34,251,865 2 Africa 292 847,143 364,425,799 2,984,593 3 Americas 137 77 69,835,746 58,771,139 4 Europe 42 1,200,002 15,488,769 25,481,309 5 Oceania 22 660 8,034,019 11,526,000 Total 646 11,711,271 2,170,620,362 133,014,906 Source: EM-DAT [8]
2
Table 1.2 Top ten most important drought disasters for the period 1900 to 2014 sorted by numbers of people affected at the country level.
Sr. No. Country Disaster Date Total Affected
1 India Drought May-87 300,000,000
2 India Drought Jul-02 300,000,000
3 India Drought 1972 200,000,000
4 India Drought 1965 100,000,000
5 India Drought Jun-82 100,000,000
6 China P Rep. Drought Jan-94 82,000,000 7 China P Rep. Drought Apr-02 60,000,000 8 China P Rep. Drought Oct-09 60,000,000
9 India Drought Apr-00 50,000,000
10 China P Rep. Drought Jun-88 49,000,000
Total 1,301,000,000
Source: EM-DAT [8]
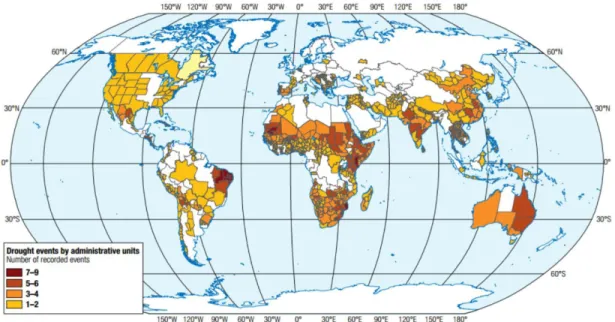
The numbers of drought disasters reported worldwide over the period of 1974-2004 are shown in Figure 1.1. It shows that the Africa, Asia, Australia and Latin America have faced 5-9 drought events over past 30 year’s period. The Fourth Assessment Report of the Intergovernmental Panel on Climate Change [9] has stated that the tropics of Asia and Africa could experience a significant change in the frequency and intensity of droughts for mid- to late 21st century.
Figure 1.1 Number of drought disasters as recorded by EM-DAT 1974–2004 (Source: Adapted from UNISDR, 2009 [10]).
3
According to the report, likely increase in frequency of droughts will have negative impacts on agriculture, forestry and ecosystem (land degradation, crop damage, lower yields, increased livestock deaths, and increased risk of wildfire); water resources (more widespread water stress); human health (increased risk of food and water shortage, malnutrition, and water- and food- borne diseases); and industry, settlements and society (water shortages for industry and societies, reduction in hydropower generation potentials and increased potential for population migration).
Due to increasing temperature, water stress, frequency of El Nino events, and decreasing number of rainy days, production of rice, maize and wheat has declined in many parts of Asia in the past few decades [11]. The Centre for Low Carbon Futures [12] reports that there will be a marked increase in drought severity across much of Asia in the 2020’s compared to the 1990-2005 period, affecting wheat and maize production in China and India (Asia’s largest food producers) and ultimately threatening Asia’s food security over at least the next two decades. It is well accepted that developing countries are most vulnerable to drought as compared to developed countries [13]. India is amongst the most vulnerable drought prone countries in the World.
1.2 Statement of problems
Nearly one-sixth of India is defined as a Drought Prone Area (DPA), with recurring drought the major challenge in the DPA. About two-thirds of India’s gross cropped area is drought prone [14]. The population is mainly engaged in the crop farming, livestock rearing and unskilled agricultural labor activities. Out of total work force of India, about 54.6% (24.6% agricultural cultivators and 30% agricultural laborers) were engaged in agriculture and allied activities in 2011 [15]. This shows a heavy dependence of an agrarian economy on rainfall. About 60% of the total cultivated area in India still relies on natural rainfall (rainfed agriculture) and hence changes to rainfall patterns are a significant threat to India’s agrarian economy. During the period from 1901 to 2010, about 17% were drought years in India with associated severe impacts on agriculture, water resources, food security, economy and social life in the country [16]. Since the mid-nineties, India has been experiencing prolonged and widespread droughts in consecutive years, with increasing frequency in recent times [17]. Although agriculture contributes only 14.62% of India’s GDP [18], the majority of the Indian population depends on agriculture and allied activities for livelihood. In the decade from 2002-2012 India had three major droughts (2002, 2009 and 2012), with the 2012 drought causing 0.5% reduction in India’s gross domestic product (GDP) [19], which is equivalent to US$9 billion.
About 54.6% of the labor force in India is dependent on agriculture as a source of living, whereas in United States of America and Australia, this figure is 0.7 and 3.6%, respectively
4
[20], which helps put into context the widespread hardship that a drought can cause in India. Drought impacts vary from region to region, but the overall issues are similar and Maharashtra State is indicative of the rest of the DPAs (drought prone Areas) in India. In this background this study focuses on one of the important state of India, which contributes about 15% of the country’s gross domestic product (GDP) - Maharashtra State (Figure 1.2).
Figure 1.2 Districtwise annual average rainfall for Maharashtra State.
The location map and districtwise annual average rainfall using natural breaks classification for Maharashtra State is shown in Figure 1.2. About 40% of the Maharashtra State falls under DPA, having annual average rainfall less than 750 mm. Agriculture (e.g. rainfed cropping, livestock) are the major sources of income generation of over 64% of the state’s population. About 5 to 6 major drought events have reported in the state during
1974-5
2004. Drought typically occurs in the state once every 5 years [21]. The state has experienced a moderate drought in the year which commenced in 2011 and further deteriorated in 2012. During the monsoon season of 2012, the Central Maharashtra and Marathwada divisions of the state received 546 mm and 458 mm rainfall which corresponds to a -25% and -33% rainfall deficit, respectively, when compared with the long term average [22] resulting devastating impacts on domestic water supply, agricultural production and socio-economic activities of rural farming community. However intensity and hence impacts of drought varied at local level. About 80% of drinking water sources in the Maharashtra State are groundwater dependent. The groundwater in the state acts as buffer for long-term rainfall and surface water shortage. The average residence time of the shallow, accessible groundwater in the state is less than four years [23]. Therefore, prolonged droughts (i.e. greater than two years duration) or consecutive years of reduced monsoon rainfall severely threaten livelihoods.
1.3 Need of research
Still, few studies have endeavored to identify drought impacts at the local and regional scale [24]. Studies by Sivakumar et al. [25], Meadow et al. [26], and Abraham [27] recommend region specific, local level analysis to evaluate the agronomic and economic impacts of drought. Figure 1.3 highlights the need for drought impacts assessment. In the state of increasing drought impacts, it is important to inform policy makers on the causes of drought, its impacts, various adaptation responses and possible mitigation measures perceived at local levels in order to alleviate human sufferings [28, 29]. Also, the concept of providing short-term drought relief without much reference to the major constraints and problems does not significantly help the region or the poor [30, 31, 32, 33]. Understanding micro level i.e. village and household level drought impacts are equally important as of macro level (national) impacts [34], in order to identify the most appropriate, effective and efficient responses that could be taken by national, state or local governments to build self reliance and preparedness to mitigate drought [35, 30, 36].
Only few studies assessing local impacts of drought on domestic water supply and crop production, at various levels has been carried out in India, for example studies by Asha latha et al. [37] (a case study of Karnataka from Dharwad district, impacts of drought 2006 on agriculture productivity); The World Bank report [38] (a case study of Maharashtra (Ahmednagar and Nashik districts) and Andhra Pradesh (Chittoor and Anantapur districts), (impacts of drought 2002-2003 on crop production and income); Khurana and Mahapatra [39] (impacts of drought 2003-08 on rural drinking water in Bundelkhand region) etc. However these studies lack full range quantification of various drought impacts, which is of a great importance for its planning and mitigation.
6
Figure 1.3 Why to assess drought impacts?
Drought impacts on domestic water collection, unskilled employment activities and farmer’s indebtness are often neglected, while attention focuses mainly on the direct impacts on crop production and income [40]. Due to drought driven water scarcity, long time is being spent in daily water collection from remote distance sources (particularly by women and children), which reduces the time available for unskilled employment activities and less time for schooling of children and can also have negative impact on health. Failure of agriculture due to drought subsequently affects local employment opportunities and economy, resulting in financial hardships and forcing farmers to borrow loans with high interest rates. The situation worsen if drought prolongs, which results in household food insecurity and accumulation of availing loan along with its interest amount. Therefore in addition to impacts of drought on crop and income, attention must be given for assessing drought impacts on domestic water collection, rural employment activities, and financial status considering availing loan amounts.
In relief and mitigation measures by local administration attention is given towards making enough water available to community during drought; however water quality remains neglected issue. Therefore attention should be given on provision of sufficient amount of water with adequate quality. To design appropriate drought preparedness and mitigation strategies and to overcome the problem of rural drinking water supply it is of great importance to understand rural drinking water issues through public participation. Knutson et al [41] recommends consideration of public input while dealing with the issues of appropriateness, urgency, equity, and cultural awareness in drought risk analysis. Limited
To understand complex impacts of
drought
To know where to direct drought relief To justify mitigation
actions
To identify vulnerability factors and vulnerable
areas To prioritize drought proofing and development activities Pro-active risk management Why to assess drought impacts
7
studies have been carried out to investigate impacts of drought on rural public water supply in terms of availability and quality in rural drought prone areas of India. Also, to know where to direct drought relief, prioritize drought proofing activities and for proactive management of drought, local level (sub-districts, districts etc.) drought risk assessment is essential. While assessing drought risk, in addition to understanding and addressing natural component of drought hazards like precipitation deficit, equal importance should be given to adaptive capacity of a particular society. In this background this study set up following objectives.
1.4 Objectives and scope
The objectives of this study are to assess drought, its local socio-economic-environmental impacts, adaptation and mitigation strategies, and to prepare drought risk map using drought hazard and vulnerability indices.
Specific objectives
i. Historical analysis of drought events with their characteristics (i.e. beginning and end of drought, severity, duration and intensity) and to assess water scarcity through a pilot study.
ii. Assessment of socio-economic and environmental impacts of drought in qualitative and quantitative terms
iii. To identify local level adopted adaptations and administrative drought mitigation strategies
iv. To assess drought hazard, vulnerability and risk at local scale. Scope of the study
This study deals with (1) analysis of historical drought events and water scarcity ; (2) assessment of drought impacts on water resources, agriculture, food security, and adopted adaptation and mitigation measures; (3) qualitative assessment of farming community's perception of drought impacts on their socio-economic activities and environment, and household and administrative level adaptation and mitigation measures respectively; (4) quantitative assessment of drought impacts on domestic water supply, agriculture production, unskilled agricultural and rural employment, and financial status of rural farming community and severity of drought impacts across different respondent characteristics; (5) identification of rural drinking water issues during drought; and finally (6) preparation of drought risk
8
maps using drought hazard and vulnerability factors for a representative drought prone catchment of the state - the Upper Bhima Catchment.
1.5 Organization of the dissertation
The organization of dissertation is shown in Figure 1.4. The brief descriptions of chapter contents are given below.
Chapter 1 - Introduction: This chapter provides general background, statement of problems, need of research, objectives of the study and briefly describes dissertation outline.
Chapter 2 - Literature review: This chapter provides the information from previous studies on drought identification and characteristics, drought impacts assessments, strategies to mitigate drought, drought hazard - vulnerability and risk assessment.
Chapter 3 - Methodology: This chapter provides detailed description of research framework, materials & methods and study area details.
Chapter 4 – Characterization of drought and water scarcity: This chapter presents situation of water scarcity through a pilot study and analyses historical drought events with their characteristics by using Standardized Precipitation Index.
Chapter 5 - Qualitative assessment of drought impacts and mitigation strategies: This chapter presents rural farming community’s perception of drought impacts on their socio-economic activities and environment, their adaptation at the household level and opinions on government drought mitigation measures.
Chapter 6 - Quantitative assessment of drought impacts: This chapter identifies severity of impacts of a recent drought on domestic water supply, crop production, unskilled rural employment and financial status of the rural households.
Chapter 7 - Rural drinking water issues during drought: This chapter is designed to assess rural drinking water supply issues during drought in terms of drinking water quality and availability.
Chapter 8 - Drought risk assessment: This chapter is designed to assess the drought risk using drought hazard and vulnerability indices at a local (sub-district administrative level) in the study area. The drought hazard is obtained from probability of rainfall deficit. The local level vulnerability indicators were identified from qualitative and
9 Figure 1.4 Structure of dissertation.
Chapter 1
Introduction
General background related to drought and drought impacts, statement of problems, need of research, objectives and structure of dissertation
Chapter 2 Drought identification and characteristics, drought impacts assessments, strategies Literature review to mitigate drought, drought hazard, vulnerability and risk assessment
Chapter 3
Methodology
Research framework
Drought characterization, assessment of drought impacts, adaptation and mitigation strategies (Questionnaire survey, focus group discussion and water quality analysis), drought risk mapping
Study area
Location Demographics, Climate and rainfall Land use
Chapter 4
Characterization of drought and water scarcity
Assessment of water scarcity through a pilot study and historical analysis and characterization of droughts using SPI
Chapter 5
Qualitative assessment of drought impacts & mitigation strategies
Farmers’ perception of drought impacts, local adaptation and administrative mitigation measures/strategies
Chapter 6
Quantitative assessment of drought impacts
Quantitative assessment of impacts of drought on domestic water supply, crop production, unskilled rural employment and financial status of the rural households
Chapter 7
Rural drinking water issues during drought
Assessment of rural drinking water supply issues during drought (quality and availability of rural drinking water)
Chapter 8
Drought risk assessment
Assessment of drought hazard and vulnerability followed by preparation of drought risk maps
10
quantitative assessment of drought impacts as given in chapter 5 & 6. In addition the useful and simple indicators suggested by secondary literatures are also used to assess the local level vulnerability to drought.
Chapter 9 – Summary of the study: This chapter gives the summary of the overall research with important findings, conclusions, recommendations and scope for future research work.
11
CHAPTER 2: LITERATURE REVIEW
2.1 Background
Differences in hydro meteorological variables and socioeconomic factors along with the stochastic nature of water demands in various regions of the world posed difficulties in defining drought [42]. Generally drought is defined as an extended period of months or years in which precipitation is less than the annual average resulting in water scarcity problems in a particular region. It can be defined as a natural phenomenon causing temporary decrease in water quantity over a region such as rainfall deficiency. Whereas water scarcity is human driven phenomenon, in which water demand for human activities exceeds available water resources in a region. Water scarcity and drought are interrelated as; drought always results in water scarcity. The following sections provides literature about various aspects of droughts in terms of - types of drought, its characterization using indices, general impacts of drought and adopted response strategies. Presents highlight of drought impacts in the Maharashtra State as a whole. Finally, it provides literature for various data elicitation process for field investigations and their findings.
2.2 Types of drought
Generally droughts are classified in four classes as: Meteorological drought (lack of precipitation over a region for a period of time); Hydrological drought (a period with inadequate surface and subsurface water resources); Agricultural drought (a period with declining soil moisture and consequent crop failure without surface water resources) and Social drought (failure of water resources systems to meet water demands resulting impact on human activities including indirect as well as direct impacts). Economic drought reflects the impacts of precipitation related reductions in water availability on productive activities including the provision of water for human consumption rather than water availability itself. Figure 2.1 shows sequence of drought occurrence and impacts for commonly accepted drought types. According to National Drought Mitigation Center [43], all droughts are originates from a deficiency of precipitation or meteorological drought and other types of drought and impacts begins from this deficiency. Meteorological drought is defined usually on the basis of the degree of dryness (in comparison to some normal or average) and the duration of the dry period. Definitions of meteorological drought generally considered region specific since the atmospheric conditions that result in deficiencies of precipitation are highly variable from region to region. Other definitions may relate actual precipitation departures to average amounts on monthly, seasonal, or annual time scales. Precipitation deficiency (amount, intensity, timing) resulting in reduced infiltration, runoff, deep percolation and groundwater recharge; and high temperature, high wind, low relative humidity, greater
12
sunshine, less cloud covers resulting in increased evaporation and transpiration are components of drought. The meteorological drought results in soil water deficiency causing agricultural drought, which results in plant water stress, reduced biomass and yield. Agricultural drought occurs during dry, hot periods of low precipitation, and may occur during periods of average precipitation when soil conditions or agricultural techniques require extra water.
Figure 2.1 Sequence of drought occurrence and impacts for commonly accepted drought types (Source: National Drought Mitigation Center, University of Nebraska-Lincoln, U.S.A.)
[43]
Hydrological drought is associated with the effects of periods of precipitation (including snowfall) deficits on surface water resources (i.e., streamflow, reservoir and lake levels, groundwater) [43] and its frequency and severity is often defined on a watershed or river basin scale. Hydrological droughts are usually out of phase with or lag the occurrence of meteorological and agricultural droughts. It takes longer to see the impacts of precipitation deficiencies on the hydrological system such as soil moisture, streamflow, and groundwater
13
and reservoir levels. Socioeconomic drought associates the supply and demand of some economic good with elements of meteorological, hydrological, and agricultural drought. It differs from the other types of drought because its occurrence depends on the time and space processes of supply and demand to identify or classify droughts. In most instances, the demand for economic goods is increasing as a result of increasing population and per capita consumption. Supply may also increase because of improved production efficiency, technology, or the construction of reservoirs that increase surface water storage capacity in the region. If both supply and demand are increasing, the critical factor is the relative rate of change of supply and demand. If demand increasing more rapidly than supply then, vulnerability and the incidence of drought risk may increase in the future in that particular region [43]. These aforementioned types of drought have various socio-economic and environmental impacts. General description of drought impacts and adoption of response strategies in Indian context are given in Section 2.4 and 2.5.
2.3 Drought indices
The preparedness and planning to cope with drought impacts depend on the information about its onset, severity, duration, intensity and withdrawal. This information can be obtained using drought indices, which provides useful information to decision makers about characteristics of droughts [44]. Until now various drought indices have been developed and proposed for characterization of droughts. Few of them are given in Table 2.1. These indices are normally continuous functions of any one or more hydro-meteorological variables such as precipitation, temperature, soil water, streamflow, groundwater, potential evapotranspiration etc. [45]. The most commonly used drought indices based on precipitation are described as follows.
2.3.1 Percent rainfall deficit
The percent of normal precipitation is one of the simplest measurements of rainfall for a location. Analyses using the percent of normal are very effective when used for a single region or a single season. Percent of normal is also easily misunderstood and gives different indications of conditions, depending on the location and season. It is calculated by dividing actual precipitation by a normal precipitation (typically a 30-year mean) and multiplying this result by 100%. This can be calculated for a variety of time scales. Usually these time scales range from a single month to a group of months representing a particular season, to an annual or water year. Normal precipitation for a specific location is considered to be 100%. The IMD has classified drought as moderate drought when rainfall deficiency is 25-50% and severe drought when rainfall deficiency is more than 50% of long term annual average (i.e. rainfall less than 50% of the climatological normal).
14
Table 2.1 List of major drought indicators used for drought monitoring.
Sr. No. Index Name Reference
1 PDSI Palmers Drought Severity Index Palmer [46] 2 RAI Rainfall Anamoly Index Moron [47]
3 Deciles - Gibbs and Maher [48]
4 CMI Crop Moisture Index Palmer [49]
5 BMDI Bhalme and Mooly Drought Index Bhalme and Mooley [50] 6 SWSI Surface Water Supply Index Shafer and Dazeman [51] 7 NDI NOAA drought Index Strommen and Motha [52] 8 SMDI Soil Moisture Deficit Index Narasimhan and Srinivasan [53] 9 CSDI Crop Specific Drought Index Meyer et al. (1993) [54] 10 SPI Standardized Precipitation Index McKee et al. [55] 11 RDI Reclamation Drought Index Weghorst [56] 12 VCI Vegetation Condition Index Liu and Kogan [57] 13 EDI Effective Drought Index Byun and Wilhite [58] 14 MPDI Modified Perpendicular Drought Index Ghulam et al. [59] 15 RDI Reconnaissance Drought Index Tsakiris et al. [60]
2.3.2 Deciles
Arranging monthly precipitation data into deciles is another drought-monitoring technique developed by [48] to avoid some of the weaknesses within the “percent of normal” approach. The technique they developed divided the distribution of occurrences over a long-term precipitation record into tenths of the distribution. They called each of these categories a decile. The first decile is the rainfall amount not exceeded by the lowest 10% of the precipitation occurrences. The second decile is the precipitation amount not exceeded by the lowest 20% of occurrences. These deciles continue until the rainfall amount identified by the tenth decile is the largest precipitation amount within the long-term record. The classification of drought based on deciles is given in Table 2.2.
Table 2.2 Drought classification based on deciles.
Deciles % of historical totals Drought category
lowest 5% Severe deficiency lowest 5-10% Serious deficiency 1 lowest 10% Very much below average 2-3 lowest 10 - 30 % Below average
4-7 middle 40% Average
8-9 highest 10 - 30 % Above average 10 highest 10% Very much above average
15
2.3.3 Standardized Precipitation Index (SPI)
The understanding that a deficit of precipitation has different impacts on groundwater, reservoir storage, soil moisture, snowpack, and streamflow, McKee et al. [55] developed the SPI. The SPI was designed to quantify the precipitation deficit for multiple time scales. These time scales reflect the impact of drought on the availability of the different water resources. Soil moisture conditions respond to precipitation anomalies on a relatively short scale. Groundwater, streamflow, and reservoir storage reflect the longer-term precipitation anomalies. For these reasons, McKee et al. [55] originally calculated the SPI for 3–, 6–, 12–, 24–, and 48–month time scales. The SPI calculation for any location is based on the long-term precipitation record for a desired period. This long-long-term record is fitted to a probability distribution, which is then transformed into a normal distribution so that the mean SPI for the location and desired period is zero. Positive SPI values indicate greater than median precipitation, and negative values indicate less than median precipitation. Because the SPI is normalized, wetter and drier climates can be represented in the same way, thus wet periods can also be monitored using the SPI. The drought classification system based on SPI is shown in Table 2.3.
Table 2.3 SPI drought category.
Drought category SPI
Near normal -0.99 < SPI ≤ 0.99 Moderately dry -1.49 < SPI ≤ -1.00 Severely dry -1.99 < SPI ≤ -1.50 Extremely dry -2.00 ≤ SPI
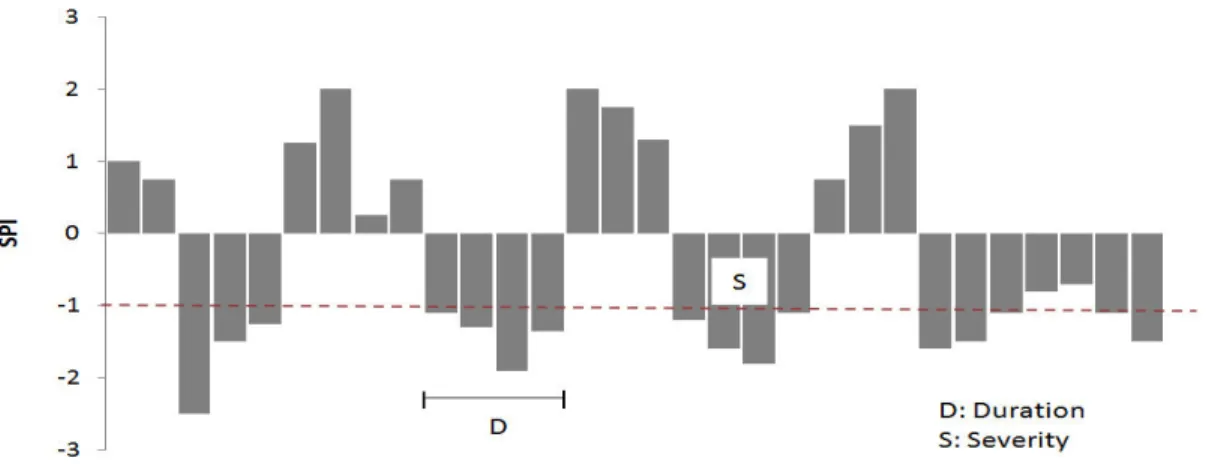
Figure 2.2 illustrates the characterizations of drought based on SPI. By using SPI values beginning and end, duration, severity, intensity and inter-arrival time of droughts can be obtained. These terms are defined below:
Beginning and end of a drought event: When SPI values crosses -0.99 values then its onset of drought, whereas when SPI becomes positive (>0) during the same event, it is the end of that drought.
Duration of drought: The months between beginning and end of a drought event. Drought severity: sum of all negative SPI for a drought event
Drought intensity: the ratio of drought severity and duration
16
Figure 2.2 Explanation of terms used for drought characterization by using SPI.
2.4 General drought impacts and response strategies
The agriculture in India is primarily dependent on monsoon rainfall. Due to temporal and spatial uncertainties of monsoon rainfall, Indian agriculture is always at the threat resulting crop failure, second sowing or less agricultural production etc. The most immediate impact of drought is reduction in crop production, due to inadequate and poorly distributed rainfall resulting in water scarcity for irrigation. In country, the total area equipped for irrigation is 39% of total cultivated area, in which groundwater and surface water contributes 63 % and 37 % respectively (FAO aquastat, 2010). High percentages of area equipped for irrigation by groundwater shows that groundwater is used as buffer instead of relying irrigation mostly on surface water resources and uncertain monsoon rainfall. About 61 % of the total cultivated area in country relies on rainfall (rainfed agriculture), resulting dependence of crops, vegetables, fruits production on rainfall, creating threat to an agrarian economy.
Various direct and indirect impacts of drought on agriculture, household (domestic), industrial and environmental sector are listed Table 2.4. The direct impact of drought on agriculture is decrease in crop (food grains, cereals, oilseeds etc.), vegetable and fruit production. It also affects the unskilled labor opportunity in farms. This creates drastic reductions in farmers’ income. Crop failure subsequently results in debiting from banks or money lender with high interest rate or delay in repayment of previous loan taken for agricultural development. Unable to repay the debt results in selling of fixed assets such as farmland or house etc. The situation becomes worse if the drought prolongs and the groundwater availability for irrigation (as a buffer to sparse and variable rainfall) also declines. Generally residues of the harvested crop are used as feed for the farm animals. Crop failure by drought; subsequently result in unavailability of crop residues to feed the farm animals. Also pasture production is also likely to be reduce, (although output from natural
17
pastures tends to be less vulnerable to drought than crop production). Low rainfall causes poor pasture growth and may also lead to a decline in fodder supplies from crop residues affecting daily fodder supply to the animals.
Table 2.4 Classification of drought impacts.
Tangible/ Market (Economic Cost)
Damage
Type Sector Impacts
A. Direct damages
a.
Agriculture
1. Reduction in agricultural crop production 2. Reduction in livestock production 3. Livestock death
b. Industry
1. Water scarcity for water industry 2. Reduction hydroelectric production 3. Nursery and garden industries c. Services 1. Loss of navigation
B. Indirect Damages
a.
Agriculture
1. Unemployment
2. Delay in repayment of crop loans
b. Industry
1. Loss in production due to lack of raw material for agriculture based industries
2. Loss in operational hours due to lack of water and electricity
c. Domestic/ Social
1. Money and time spent for water collection 2. Disease due to less consumption of household water
3. Times wasted in disease situation by patient and accompanying care takers
d. Services
1. Increase in food prices 2. Transportation
3. Reduced tax revenues 4. Trade loss 5. Decrease in tourism Intangible / Non-market Direct and Indirect damages a. Social
1. Loss of human life/ farmers suicide 2. Stress & psychological damage 3. Human Malnutrition 4. Migration Population b. Environment 1. Forest Degradation 2. Pasture degradation 3. Deteriorated water quality 4. Loss of wetlands
5. Damage to wild life and fish habitat
6. Reduced quality or loss of recreational sites resulting aesthetic impacts
18
Water scarcity in drought year limits the drinking water availability to farm animals. The reduction in fodder and water consumption by farm animals leads to less milk production, weight loss and susceptibility to disease. In severe drought years farmers use to sell their animals mainly because of two reasons. One is the inability of farmer to provide fodder and water to farm animals, and second is to cope up with the loss caused by failure of crop by selling farm animals to very low prices. Drought increases the chance of food insecurity, shortage of drinking water, mental and physical health problems, migration for work, and debt etc. These impacts can vary significantly from one region to another region. Human drivers, such as increasing water demand and poor water management can further exacerbate the drought impacts. Because of the interplay between a natural drought event and various human factors drought perception varies amongst the people from region to region.
The Intergovernmental Panel on Climate Change (IPCC) defines climate change adaptation as “adjustment in natural or human systems (ecological or social, economic systems) in response to actual or expected climatic stimuli or their effects or impacts, which moderates harm or exploits beneficial opportunities [61]. It refers changes in processes, practices, or structures to moderate or offset potential damages or to take advantage of opportunities associated with changes in climate. There are other definitions used often are as follows; Adaptation is a process by which strategies to moderate, cope with and take advantage of the consequences of climatic events are enhanced, developed and implemented” [62]. Adaptation to climate change is the process through which people reduce the adverse effects of climate on their health and well-being, and take advantage of the opportunities that their climatic environment provides [63]. Adaptation involves adjustments to enhance the viability of social and economic activities and to reduce their vulnerability to climate, including its current variability and extreme events as well as longer term climate change. The term adaptation means any adjustment, whether passive, reactive or anticipatory, that is proposed as a means for ameliorating the anticipated adverse consequences associated with climate change. Adaptation to climate change includes all adjustments in behavior or economic structure that reduces the vulnerability of society to changes in the climate system [63].
There might be slight differences exist among these definitions and have some practical implications under certain circumstances. Various types of adaptation can be distinguished as including anticipatory, autonomous and planned adaptation [61]. Anticipatory adaptation takes place before impacts of climate change are observed (also referred to as proactive adaptation/preparedness). Autonomous adaptation - that does not constitute a conscious response to climatic stimuli but is triggered by ecological changes in natural systems and by market or welfare changes in human systems (also referred to as spontaneous adaptation/reactive/bottom up approach). Planned adaptation- is the result of a deliberate policy decision, based on an awareness that conditions have changed or are about to change


![Figure 4.11 Stage of groundwater development in sub-districts of the Upper Bhima Catchment during 2004 (Source: GSDA [104])](https://thumb-ap.123doks.com/thumbv2/123deta/7694862.1216857/69.918.239.706.658.960/figure-stage-groundwater-development-districts-upper-catchment-source.webp)