保健医療科学 2018 Vol.67 No.1 p.21-33
Corresponding author: Hiroshi Terada 2-3-6 Minami, Wako, Saitama 351-0197, Japan.
Tel. +81-48-458-6263; Fax +81-48-458-6270; Email: [email protected]
Regulation values and current situation of radioactive materials in food
Hiroshi Terada
1), Ichiro Yamaguchi
1), Tsutomu Shimura
1),
Erik R. Svendsen
2), Naoki Kunugita
1) 1) Department of Environmental Health, National Institute of Public Health2) Division of Environmental Health, Department of Public Health Sciences, Medical University of South Carolina
< Review >
Abstract
After the Fukushima Dai-ichi Nuclear Power Plant accident, the Ministry of Health, Labour and Welfare set the provisional regulation values for radioactive materials in foods by adopting Indices for Food and Beverage Intake Restriction. The indices were established based on 5 mSv of effective dose and 50 mSv of committed equivalent dose to the thyroid in compliance with the recommendations of the International Commission on Radiological Protection and others. On April 1, 2012, the present standard limits were put in force for the exiting exposure situations. The standard limits were intended not to exceed 1 mSv/year from food intake. One milli-Sievert per year of maximum permitted level conforms with the intervention exemption level (reference level) adopted by the Codex Alimentarius Commission. The provisional regulation values and the present standard limits of Japan are lower than the derived intervention levels of the U.S., the EU and Codex.
Immediately after the monitoring of foods began, public concern was raised since many samples of leafy vegetables and raw milk were found to be above the provisional regulation values. Thus, several public health protection measures were taken to decrease the concentrations of radioactive materials in foods by the Ministry of Agriculture, Forestry and Fisheries, the local governments and the farmers, such as feeding livestock with safe food and the application of potassium fertilizer. Due to these measures, almost all of the marketed foods in Japan are below the standard limits and concentrations of radioactive cesium are sufficiently low at this moment. Results of dose estimation with the monitoring data and total diet studies also show committed effective doses from food are well below the maximum permissible level; thus, it can be concluded that the measures taken by Japan after the Fukushima accident were reasonably successful.
However, there are still some foods found with radiocesium concentrations above the standard limit like wild mushrooms, wild animal meat, wild vegetables, freshwater fish, and some saltwater fish whose feeding or cultivation management are difficult to control. Thus, monitoring of those foods should be continued.
keywords: standard limit, provisional regulation value, radioactive cesium, dose estimation, total diet study
(accepted for publication, 15th February 2018)
I
.Introduction
Even before the Fukushima Dai-ichi Nuclear Power Plant (FDNPP) accident, there existed regulatory values for radioactive materials in foods, namely the interim limit and Indices for Food and Beverage Intake Restriction (hereinafter referred to as "the indices") in Japan.
The interim limit was established for foods imported from the European region after the Chernobyl Nuclear Power Plant accident [1]. The Ministry of the Health and Welfare set the limit to 370 Bq/kg as a sum of the radiocesium concentration (134Cs + 137Cs). Any lots of such foods that exceeded the limit were recalled, reshipped or disposed of
Topics: Lessons learned on public health from the Fukushima Daiichi Nuclear Power Plant accident
on the basis of the Food Sanitation Act [2].
On the other hand, the indices were established by the Nuclear Safety Commission of Japan (NSCJ) to prepare for a radiological emergency situation. In accordance with the indices, the Nuclear Emergency Response Headquarters (NERHQ) would begin discussion on whether to adopt restriction measures for intake of domestic foods and beverages if a radiological event were to occur. Initially, the index for 131I was set in 1980, and the indices for radioactive cesium, radioactive strontium, plutonium, uranium and other alpha-emitting transuranic elements were set in light of the Chernobyl Nuclear Power Plant accident and the JCO criticality accident [3].
For these reasons, the indices were adopted as the provisional regulation values (PRVs) for radioactive materials in foods under the Food Sanitation Act after the FDNPP accident, on March 17, 2011 [4]. The PRVs were set so urgently by the Ministry of Health, Labour and Welfare (MHLW) that the MHLW requested that the Food Safety Commission of Japan (FSCJ) assess the suitability of the PRVs. In response to this request, the FSCJ concluded that "the provisional regulation values established by MHLW are based on and in line with such a bit too stringent safety criteria" on March 29, 2011 [5]. However, because there was a strong need for new radiological standards, the present standard limits were prepared by the MHLW and put in force on April 1, 2012.
In this section, the following 3 topics will be reviewed: basic concepts for establishing the PRVs and the present standard limits, current situation of radioactive materials in food, and estimation of effective dose from food consumption.
II
.Basic concepts for establishing the PRVs
and the present standard limits
1. The provisional regulation values
The MHLW set the PRVs by adopting the indices prepared by the NSCJ [4].
The NSCJ’s basic concepts for establishing the indices were as follows [6]:
• The indices were not equivalent to the concentration limits of the radioactive materials in foods which represent the upper limit not to cause an adverse health effect, but the guidance levels to adopt restriction measures for food and beverage intake as low as is reasonably achievable for radioprotection.
• Five mSv of effective dose and 50 mSv of committed equivalent dose to the thyroid were adopted as the upper level of the intervention dose levels in compliance with the recommendations of the International Commission on Radiological Protection (ICRP), International Atomic
Energy Agency (IAEA) and others [7,8].
R adioactive materials concentrations in foods corresponding to the intervention dose levels (hereinafter referred to as DILs from "derived intervention levels") were derived on the basis of the following requirements: 1) radioactive iodine, radioactive cesium and strontium, plutonium and alpha emitting transuranic radionuclides, and uranium were taken into consideration, 2) foods were grouped into five categories (drinking water, milk and dairy products, vegetables, grains, and others), 3) for radioactive cesium, an annual dose of 1 mSv was assigned to each food group, 4) radioactivity ratio of 90Sr to 137Cs in the environment was assumed to be 0.1, 5) for the long-lived radionuclides, the average concentrations of contaminated foods were assumed to be half of the peak concentration, whereas a dilution factor of 1 was applied for short-lived radionuclides. More details on the derivation of DILs were described by Suga et al. [6], Hamada et al. [3] and Inaba [9].
The indices were obtained by rounding down the DILs. For instance, the DILs for radioactive cesium in milk was induced at 270 Bq/kg, then later the indices of radioactive cesium in milk was set to 200 Bq/kg. The RPVs for radioactive cesium were shown in Table 1. They were set to 200 Bq/kg for drinking water, and milk and dairy products, and 500 Bq/kg for vegetables, grain, meat, eggs, and fish.
For radioactive iodine, the indices were set to 300 Bq/ kg for drinking water, milk and other dairy products, and 2,000 Bq/kg for vegetables (other than root vegetables and potatoes which were considered much less contaminated with radioactive iodide than other vegetables). Therefore, the indices were not given for root vegetables and potatoes. For the similar reason, grain, meat, eggs, and fish also were not given the indices for the short-lived radioactive iodide. On the contrary, high levels of radioactive iodine which exceeded the PRVs for vegetables were detected in fish after the FDNPP incident. In response to this issue, the MHLW decided to adopt a PRV of 2,000 Bq/kg for radioactive iodine in fish and fishery products on April 5, 2011 [10].
The PRVs were followed by food safety policies based on the Food Basic Safety Act in an emergency situation. According to an immediate report to the MHLW, the FSCJ stated that “the thyroid equivalent dose of 50 mSv per year was concluded, at the present situation, to be sufficiently safe for prevention of radiation”, and as regarding radioactive cesium, “the annual effective dose of 5 mSv was considered as highly conservative”, on March 29, 2011 [11]. But they also stated in this report that “It should be clearly heeded that this emergency report is not appropriate as a basis for risk management measures under normal circumstances” [11].
Regulation values and current situation of radioactive materials in food
2. Present standard limits
The FSCJ finally submitted the “Risk Assessment Report on Radioactive Nuclides in Foods” to the MHLW on October 27, 2011. This report concluded that:
• Cumulative effective doses more than around 100 mSv : cumulative effective doses of radiation during the lifetime could increase the risk of the effect on health. The amount does not include radiation from the natural environment and medical exposure.
• Babies, infants and children are considerably more susceptible to radiation than adults, posing a possibility of developing thyroid cancer and leukemia.
• Although some epidemiological studies indicate the potential health hazard by exposure of radiation doses at levels below 100 mSv, there exist many uncertainties regarding their data reliability [12].
As a risk manager, the MHLW decided that new radiological standards for foods in the existing exposure situation were based on 1 mSv/year as the maximum permissible dose due to food consumption. This maximum permissible dose fulfills the FSCJ’s conclusion and conforms with the intervention exemption level (reference level) adopted by the Codex Alimentarius Commission (CAC), which is an intergovernmental body established by the Food and Agriculture Organization and the World Health Organization (WHO) [13]. Then, the MHLW prepared the present standard limits for radioactive material in
foods. The basic concepts for establishing the limits were described below.
(1) Target radionuclides
The present standard limits were put in force in April 2012, more than 1 year after the FDNPP accident. Thus, the long-lived radioactive materials including 134Cs, 137Cs, 106Ru, 238Pu, 239Pu, 240Pu and 241Pu were selected as the target radionuclides. Radioactive iodine was not considered due to its short half-life. These remaining nuclides were placed on the trial calculation list of the Nuclear and Industrial Safety Agency (NISA) as substances emitted by the FDNPP accident. Uranium was not chosen as a target radionuclide since there was no significant change between the nuclear power plant site compared to other environment.
(2) Food Categories
Foods were classified into 4 categories (drinking water, infant foods, milk, and general foods). Drinking water, infant food and milk were chosen as different categories for the following reasons: 1) There was no substitution for water, its consumption is large and it is a requirement for human life, 2) the FSCJ pointed out that “It should be noted that children are considerably more susceptible to radiation than adults”.
Other foods above were categorized as “General Foods" for the following reasons: 1) it makes the influence of individual differences in eating habits (deviation of the foods to be consumed) minimal, 2) makes the regulations
Table 1 Derived Intervention Levels for radioactive materials in foods adopted by the United States, the European Union, the Codex Alimentarius Commission and Japan
1) Accidental Radioactive Contamination of Human Food and Animal Feeds: Recommendations for State and Local Agencies
2) Council Regulation (Euratom) 2016/52 of 15 January 2016 laying down maximum permitted levels of radioactive contamination of food and feed following a nuclear accident or any other case of radiological emergency, and repealing Regulation (Euratom) No 3954/87 and Commission Regulations (Euratom) No 944/89 and (Euratom) No 770/90
3) Codex General Standard for Contaminants and Toxins in Food and Feed (Codex Stan 193-1995) 4) Foods were grouped into the following 5 categories: (1) drinking water, (2) milk and dairy products, (3)
vegetables, (4) grains, (5) meat, egg, fish and the others.
5) For radionuclides in foods, WHO proposed 5 mSv/y for emergency exposure situation and IAEA indicated 1mSv/y for existing exposure situation as reference levels.
Table 1 Derived Intervention Levels for radioactive materials in foods adopted
by the United States, the European Union, the Codex Alimentarius Commission
and Japan
Unit (Bq/kg) Food category USA 1) EU 2) CAC 3) Provisional regulatory Japan
values 4) standard limitsPresent
Drinking water 1,200 1,000 1,000 200 10 Milk 1,200 1,000 1,000 200 50 General Foods 1,200 1,250 1,000 500 100 Infant foods 1,200 400 1,000 50 Intervention
level5) 5 mSv/year 1 mSv/year 1 mSv/year 5 mSv/year 1 mSv/year
Fraction of food
affected 30% 10% 10% 50% 50%
1) ACCIDENTAL RADIOACTIVE CONTAMINATION OF HUMAN FOOD AND ANIMAL FEEDS: RECOMMENDATIONS FOR STATE AND LOCAL AGENCIES
2) Council Regulation (Euratom) 2016/52 of 15 January 2016 laying down maximum permitted levels of radioactive contamination of food and feed following a nuclear accident or any other case of radiological emergency, and repealing Regulation (Euratom) No 3954/87 and Commission Regulations (Euratom) No 944/89 and (Euratom) No 770/90
3) CODEX GENERAL STANDARD FOR CONTAMINANTS AND TOXINS IN FOOD AND FEED (CODEX STAN 193-1995)
4) Foods were grouped into the following 5 categories: (1) drinking water, (2) milk and dairy products, (3) vegetables, (4) grains, (5) meat, egg, fish and the others.
5) For radionuclides in foods, WHO proposed 5 mSv/y for emergency exposure situation and IAEA indicated 1mSv/y for existing exposure situation as reference levels.
intelligible for common people, 3) it is consistent with international organizations, such as the CAC.
(3) Age and sex
The standard limits for regulation of radioactive materials in general foods were set by taking age differences in food consumption into consideration. The difference in the amount of food intake between the sexes was taken into considerations except for the age category of less than 1 year old. Pregnant women were also given a separate category. There are five age categories (less than 1 year old, 1 to 6 years old, 7 to 12 years old, 13 to 18 years old, and 19 years old or older) in male and female. As a result, a total of 10 categories were used.
(4) Standard limit for drinking water
According to the WHO's guidelines, the guidance level of 10 Bq/kg for radioactive cesium was adopted as a standard limit for drinking water [14]. Annual dose from drinking water was calculated to be approximately 0.1 mSv/year by using the standard intake rate for drinking water (2 liters/day) estimated by the WHO and the standard limit mentioned above.
(5 ) Contribution of radionuclides other than radioactive cesium
Radionuclides other than 134
Cs and 137
Cs are not suitable as indices for routine monitoring because of the requirement of longer measurement times. Thus, the contribution of radionuclides other than radioactive cesium to the effective dose was estimated from the initial ratio of the concentration and the transfer factor of each radionuclide according to the transfer pathway from its origin to human consumption (e.g. from soil to crops, crops to human; from fresh water to freshwater fish, freshwater fish to human; and so forth) [15]. The initial ratio of the radionuclide concentration was obtained from monitoring data of soil and rivers [16-18] and the trial calculation list of the NISA [19]. For instance, the contribution of these nuclides was estimated to be about 12% in the case of people aged 19 and older.
(6) The fraction of affected food
On the basis of monitoring results and the food self-sufficiency rate of Japan, it was assumed that 50% of foods distributed were affected. Therefore, the standard limits were set so that the effective dose of the most vulnerable age group was expected to be below 1 mSv/year, even if as much as 50% of the foods were at the limit value. As for milk and infant food, it was conservatively assumed that all the distributed foods are affected since those foods are mostly produced in Japan and “During childhood people are considerably more susceptible to radiation than adults” [12].
(7) Determination of the standard limits
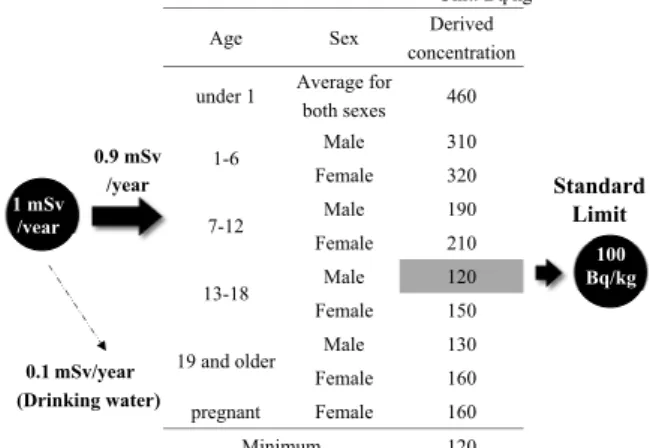
Fig. 1 shows the concept of the limit for general foods.
Annual effective dose from drinking water was calculated to be approximately 0.1 mSv/year as described above. Thus, effective dose from foods other than drinking water should be below 0.9 mSv in order not to exceed the maximum permissible annual dose (1 mSv/year). Radioactive materials concentrations in general foods corresponding to 0.9 mSv were derived on the basis of the dose coefficients and food intakes according to age and sex. As shown in Fig. 1, the minimum derived concentration was 120 Bq/kg for the category of 13 to 18 years old males. The standard limit for general foods was set to be 100 Bq/kg by rounding down the minimum derived concentration. The standard limits for milk and infant foods were set to be 50 Bq/kg, because all of these foods were assumed to be affected with maximum levels of radioactive materials concentrations. More details on derivation of the standard limits were described by Iwaoka [15].
(8) Comparison with USA, EU and CAC
The DILs for radioactive materials in each food category are shown in Table 1. The United States, the European Union and CAC adopt DILs for general foods at 1,200 Bq/ kg, 1,250 Bq/kg, 1,000 Bq/kg, respectively [13, 20, 21]. The intervention levels of 1 mSv per year are set in the EU and CAC as well as the standard limits of Japan [13, 21]. On the other hand, Protective Action Guides (PAGs) of 5 mSv for committed effective dose or 50 mSv for committed equivalent dose to an individual tissue or organ are used in the USA, as in the same manner with the PRVs of Japan [20]. The difference in the values of DILs mainly causes from distribution ratio of food intake assumed to be affected. Japan conservatively assumed that 50% of foods distributed were affected as described before, while it was assumed that 10% of the dietary intakes were affected by the EU and CAC [13, 21]. As for the U.S., an additional factor of three was applied to account for the fact that sub-populations might be more dependent on local food supplies [20].
Age Sex concentration Derived under 1 Average for both sexes 460
1-6 Male 310 Female 320 7-12 Male 190 Female 210 13-18 Male 120 Female 150
19 and older Male 130
Female 160 pregnant Female 160 Minimum 120 1 mSv /year 100 Bq/kg Standard Limit 0.9 mSv /year 0.1 mSv/year (Drinking water) Unit: Bq/kg
Regulation values and current situation of radioactive materials in food
III
. Current situation of radioactive
materi-als in food
1. Monitoring of radioactive materials in Foods
After the FDNPP accident, the guideline for the monitoring of radioactive materials in foods was established by the Nuclear Emergency Response Headquarters (NERHQ) on April 4, 2011 [22]. In this guideline, the items subject to monitoring and the frequency of monitoring were designated. The guideline was reviewed annually by the NERHQ in light of the monitoring results (latest revision: March 24, 2017) [23].
Any lot of such foods that exceeded the standard values shall be recalled or disposed of based on the Food Sanitation Act. If affected areas are found to be extended, the shipping restrictions will be issued by designating the areas and items based on the Act on Special Measures Concerning Nuclear Emergency Preparedness. The restrictions would not be lifted until the monitoring results confirm that the concentrations of radioactive materials are below the standard values.
The monitoring for this purpose is mainly implemented by the local governments and focused especially on the items that are likely to contain higher levels of radioactive cesium. There are two ways to monitor foods,
i.e., a detailed monitoring and an efficient screening test. As a detailed monitoring, radionuclide analysis is conducted using a germanium semiconductor detector. For an efficient screening test, an NaI (TI) scintillation spectrometer is used. An NaI scintillation spectrometer is inferior to a germanium semiconductor detector in terms of measurement accuracy, but can shorten the time required for the monitoring and is cheaper. If the measurement using an NaI scintillation spectrometer suggests the existence of radioactive cesium exceeding the standard limits, a monitoring is conducted again using a germanium semiconductor detector [24]. Adding to this, each municipality provides a food monitoring service to its residents.
The monitoring results are compiled by the MHLW, and the compiled data are released on its website weekly [25]. On this website, the monthly reports written in English are also available. And there exists a searchable site regarding the monitoring results of the radioactive materials in foods managed by the National Institute of Public Health (NIPH) [26]. Users can search based on the production area or the item name, or search through designating detailed conditions and can also refer to information on shipping restrictions on this website.
Table 2 Monitoring results for radioactive materials in foods collected by March of 2012
Food category Number of tests Number of violations
Vegetable 21,121 451 Fishery Products 9,408 245 Milk·Dairyproducts 2,991 23 Meat·Egg 94,155 286 Grain 5,553 2 Others 3,808 197 Subtotal 137,036 1,204
Table 2 Monitoring results for radioactive materials in foods collected by March of 2012
Table 3 Monitoring results for radioactive materials in foods collected after setting present standard limits on April 1, 2012, by January 23, 2018
Table 3 Monitoring results for radioactive materials in foods collected after setting present standard limits on April 1, 2012, by January 23, 2018
Food category Number of tests Number of violations
Agricultural products 206,384 1,242
Livestock products 1,424,202 (1,413,999)* 4 (2)*
Fishery products 122,728 1,509
Milk·Infant foods 23,572 0
Wild animal meat 7,967 1,898
Drinking water 5,046 13
Others 55,814 212
Subtotal 1,845,713 4,878
2. Monitoring results on the radioactive materials in foods
Approximately two million tests of radioactive materials in foods have been conducted as of January 23, 2018. The tests results are shown in Table 2 and 3. Tables 2 lists the results of the samples collected by March 31, 2012, namely based on the PRVs. The PRVs were exceeded in 1,204 samples out of 137,036.
Table 3 lists the results of the samples collected after April 1, 2012. The standard limits were exceeded in 4,878 samples out of 1,845,713. About three fourths of the samples was beef and the vast majority of the tests (92%) were done before shipment. The violation rate for all of the samples was 0.26%. Those of the foods other than beef before shipment and after shipment were 1.6%, 0.051%, respectively.
The results of representative items were described below.
3. Leafy vegetables
During the early stage of the FDNPP accident, radioactive iodide or cesium exceeding the PRVs were detected in many samples of leafy vegetables. In fact, the highest concentration of radioactive iodide and cesium in all of the samples were found in a spinach sample at 54,100 Bq/kg, and Brassica leafy vegetable at 82,000 Bq/ kg, respectively. Shipment of those vegetables was then restricted in Fukushima Prefecture, Ibaraki Prefecture, Tochigi Prefecture, Gunma Prefecture (since March 21), and Chiba Prefecture (since April 4, 2011). However, the concentrations of these radionuclides in leafy vegetables decreased rapidly as shown in Fig. 2. Shipping restrictions were lifted in Ibaraki Prefecture, Tochigi Prefecture, Gunma Prefecture and Chiba Prefecture by June, 2011. The restrictions were also lifted in Fukushima Prefecture, except for Futaba Town and areas where habitation is difficult in Minamisoma City, Tomioka Town, Okuma Town, Namie Town, Katsurao Village and Iitate Village [27]. At this moment, radioactive cesium is not detected in almost all samples of leafy vegetables.
4. Raw milk
Immediately after the food monitoring began, raw milk samples which exceeded the PRVs were found. Therefore, the Ministry of Agriculture, Forestry and Fisheries (MAFF) issued the following notifications to the prefectural governments:
• Notification to prefectures in the vicinity of the nuclear station of precautions regarding feed, water, feeding locations, etc (on March 19, 2011) [28]
• Notification of the standards for radioactive materials
in feed to ensure that produced meat and milk does not exceed the provisional regulation values stipulated in the Food Sanitation Act (on April 14, 2011) [29]
• Notification of a guideline on the production and utilization of feed for avoiding radioactive contamination of beef cattle and milk (on April 22, 2011) [30]
As a result, none of the raw milk samples exceeded the PRVs or the standard limit since March 23, 2011. Shipping restrictions of raw milk were imposed in Fukushima Prefecture and Ibaraki Prefecture on March 2011, but the restrictions have already been lifted other than the following areas: Minamisoma City, Kawamata Town, Tomioka Town, Okuma Town, Futaba Town, Namie Town, Katsurao Village and Iitate Village [27].
5. Beef
Regardless of the notifications mentioned above, samples of beef cattle containing radioactive cesium above the PRV were found on July 8, 2011. Soon afterward, rice straw was found highly contaminated with radioactive cesium, and identified as the cause. It was revealed that many beef samples which exceeded the PRV were distributed in the market. Therefore, the MAFF set the provisional tolerable values for feed including rice straw [31], and the MHLW issued a request to local governments concerned to implement surveys on beef distribution channels, to ensure that beef that exceeded the PRVs was not put into circulation [32]. In addition, some local governments have begun to monitor radioactive cesium in beef for all cattle shipped to the slaughterhouses. Though no beef sample exceeded the standard limit since October 26, 2012 and the vast majority were below the detection limit (Fig. 2), such monitoring still continues. Thus, efficiency of continued monitoring was discussed by Shimura et al [33].
Rice straw was not fed to chickens and pigs because they cannot digest it. Furthermore, almost all their feed was imported from outside of Japan. Thus, no chicken sample violated the PRV or the standard limit. With regard to pork, only one sample exceeded the standard limit.
6. Rice
Until now, 116 rice samples were above the PRV or the standard limit. However, no rice sample exceeded the standard limit since July 13, 2015.
Safety of rice is ensured through restricting planting, taking measures to inhibit radiocesium absorption by application of potassium fertilizer and conducting postharvest inspections, etc. In addition, all bags of brown rice produced in Fukushima Prefecture have been tested since 2012, ten million samples annually. The tests results are not contained in Table 3 because the tests are apart
Regulation values and current situation of radioactive materials in food
Fig. 2 Radiocesium and Iodide-131 concentrations in foods after Fukushima nuclear power plant accident The open circle symbols represent the maximum concentration for each month. The square symbols, the triangle symbols, the X mark and the cross symbols represent 95th percentiles, median, 5th percentiles, minimum, respectively. The solid lines, broken lines correspond the present standard limit and the provisional regulatory values for radioactive materials in foods, respectively.
0.1
1
10
100
1000
10000
100000
Mar 2011 Mar 2013 Mar 2015 Mar 2017
rad
io
ce
siu
m c
on
ce
ntr
atio
n
sampling month
0.1
1
10
100
1000
10000
100000
Mar 2011 Mar 2013 Mar 2015 Mar 2017
rad
io
ce
siu
m c
on
ce
ntr
atio
n
sampling month
0.1
1
10
100
1000
10000
100000
Mar 2011 Mar 2013 Mar 2015 Mar 2017
rad
io
ce
siu
m c
on
ce
ntr
atio
n
sampling month
0.1
1
10
100
1000
10000
100000
Mar 2011 Mar 2013 Mar 2015 Mar 2017
rad
io
ce
siu
m c
on
ce
ntr
atio
n
sampling month
0.1
1
10
100
1000
10000
100000
Mar 2011 Mar 2013 Mar 2015 Mar 2017
rad
io
ce
siu
m c
on
ce
ntr
atio
n
sampling month
unit: Bq/kg
Spinach
Mushroom
Fishery products
Wild animal meat
0.1
1
10
100
1000
10000
100000
Mar 2011 Jul 2011 Nov 2011 Mar 2012
Io
di
de
-1
31
c
on
ce
ntr
atio
n
sampling month
Beef
Spinach
provisional regulatory value
standard limit
present standard limit
present standard limit
provisional regulatory value
from the ones based on the NERHQ’s guideline. The results of all bags tests can be obtained on the website of the council for ensuring the safety of foods produced in Fukushima Prefecture [34]. According to this website, no bag exceeded the standard limit since 2015. In light of these results, Fukushima Prefecture decided to switch in the near future to monitoring by random sampling of rice in accordance with the NERHQ’s guideline [35].
7. Mushrooms
As shown in Fig. 2, the concentrations of radioactive cesium in mushrooms are still high. In particular, 440 samples of shiitake mushroom exceeded the PRVs or the standard limit. The MAFF established provisional safety standards for mushrooms logs and beds wherein mushroom fungi are planted [36]. Since FY2014, only 10 samples of shiitake mushrooms violated the standard limit. Thus, cultivated mushrooms can be controlled not to exceed the standard limit by proper radiological protection and management. On the other hand, wild mushrooms are difficult to control, so that they should be continuously monitored. Shipping restrictions of wild mushrooms are still imposed in some regions of 12 prefectures (Fukushima, Aomori, Iwate, Miyagi, Ibaraki, Tochigi, Gunma, Saitama, Chiba, Yamanashi, Nagano and Shizuoka) [27].
8. Wild animal meat
Wild animal meat has the highest radiocesium concentrations compared to other foods. As shown in Fig. 2, median of their concentrations were above the standard limit until FY2012 and violation rates were much higher than those of other foods (Fig. 3). Even now, radiocesium concentrations above 10,000 Bq/kg were detected in their meat. Shipment of their meat remain restricted in some
regions of 10 Prefectures (Fukushima, Iwate, Miyagi, Yamagata, Ibaraki, Tochigi, Gunma, Chiba, Niigata and Nagano) [27].
9. Fishery products
The concentrations of radioactive cesium in fishery products decrease gradually as shown in Fig. 2. Since September 2012, the 95th percentile of radiocesium concentrations was below the standard limit. The numbers of the fish samples above the standard limit are as follows: 253 (FY2011), 1,072 (FY2012), 301 (FY2013), 100 (FY2014), 14 (FY2015), 11 (FY2016), 11 (FY2017). Since April 2015, no ocean fish exceeded the standard limit. At the current moment, some freshwater fish such as a char, Oncorhynchus masou (kind of trout) were above the limit in Fukushima Prefecture, Tochigi Prefecture, Gunma Prefecture, Chiba Prefecture.
After the FDNPP accident, coastal and trawl fishing were banned in Fukushima Prefecture. However, the safety of certain species of fish has been confirmed by trial monitoring inspections. Since April, 2017, the scope of trial fishing has been extended to all species of fish and shellfish except fish species under the shipment ban (10 species). All fish produced from the trial fishing undergo monitoring for radioactive materials.
IV
.Estimation of effective dose from foods
To evaluate the effectiveness of the measures described before, dose estimation due to food consumption has been attempted by various methods. One of them was dose estimation based on the monitoring data of radioactive materials in food published by the MHLW. The Radioactive Material Response Working Group in the Food Sanitation Subcommittee of the Pharmaceutical Affairs and Food Sanitation Council reported such dose estimation results on October 31, 2011 using monitoring data collected immediately after the accident up to September, 2011. Adding to this, the effective dose and thyroid equivalent dose integrated up to December 2012 from immediately after the accident were reported by Yamaguchi et al [37]. The method for estimation was described below. A food monitoring dataset provided by the MHLW was used for this study. The dataset reflects the concentrations of radioactivity in food from Fukushima and 16 neighboring prefectures. Each sample was pre-treated according to the manual and was measured at 'ready to cook' status. Concentrations of non-detected samples were set to be the detection limits for each measurement or 10 Bq/kg for 131I, 134Cs and 137Cs, respectively. When 60% of samples of a food category (total n= 99) were below the detection 0 10 20 30 40 50
Mar 2011 Mar 2012 Mar 2013 Mar 2014 Mar 2015 Mar 2016 Mar 2017
violation
rate
(%)
sampling month
Fig. 3 Violation rates of regulatory values for radioactive materials in foods by month
The open circle symbols, the square symbols, the triangle symbols, the X mark and the cross symbols represent wild animal meat, mushrooms, fishery products, beef, spinach, respectively.
Regulation values and current situation of radioactive materials in food
limits during a month, concentrations in the food category were set to be half of these values for that month. When 80% of samples of a food category were below the detection limits during a month, concentrations in the food category were set to be quarter of these values for that month. The unmonitored food category concentrations were assumed to be 0 Bq/kg. The non-detected food sampled after June 2011, 131
I concentration was assumed to be 0 Bq/kg. It was assumed that 10 grams of tealeaves were used for 500 ml of tea and the concentration of cooked rice was assumed to be 1/4 of the concentration of brown rice due to the polishing effect. Food consumption in each 99 food categories was made available by using the original data of the Japanese National Food Consumption Survey, which was conducted in 2010 [38]. Food concentration and food consumption in each category were randomly picked up (N=100,000) every 4 days during first two months then every month by using random sampling. The levels of radioactive iodine and cesium were summed and then converted to the effective doses in each month. The values of the ingestion dose coefficients used for equivalent doses to the thyroid were taken from the ICRP Database [39]. The results were shown in Table 4. The estimated committed effective dose by age group derived from the radioiodine and radiocesium in food after the FDNPP accident showed the highest median value (0.19 mSv) in 13-18 years age. The highest 95th percentile value, 0.33 mSv, was shown in age group 1-6 years of age up to December 2012, showing the benefits of the food safety management activities after the accident.
Dose estimation due to food consumption were also attempted by the total diet studies (TDS) and the whole-body counter (WBC) survey. In the TDS, daily intake of radioactive materials via foods are calculated with the concentrations of radioactive materials in the food samples and food consumption. Contrary to the TDS, the WBC
survey can measure the amounts of radioactive materials in the body directly.
After the FDNPP accident, the TDS were conducted by Harada et al. [40], Sato et al. [41], the NIPH [42], the National Institute of Health Sciences (NIHS) [43] and so on. Harada et al. performed the TDS for the residents of 3 regions (Fukushima Prefecture, Kanto, western Japan) on December, 2011. Their results showed estimated dose level was in the range of <2.6–99 μSv/year [40]. Similar results were obtained by Sato et al. who conducted the TDS for the residents of Fukushima Prefecture from November 2011 to March 2012 and from June 2012 to September 2012 [41]. The TDS by the NIPH was performed for the residents of 15 regions in Japan from FY 2012 to FY2014 [42]. Fig. 4 shows the results of 3 cities (Fukushima, Sendai, Tokyo). In FY2014, the highest committed effective dose among the 3 cities was 0.89 μSv, equals up to 0.09% of the maximum permitted level due to foods (1 mSv). In our studies, radioactive strontium and plutonium which are not targets of the routine monitoring were also examined. The results
median 95th percentile
Age 1-6y 7-12 13-18 19- 1-6 7-12 13-18
19-Sex Male Male Male Male Male Male Male Male
Committed equivalent dose to thyroid No regulation 1) 6.00 3.16 2.09 1.04 21.39 8.91 7.80 5.43 Apply PRV 2) 1.72 0.90 0.77 0.49 4.57 1.88 1.75 1.31 Apply present standard limit 3) 1.71 0.90 0.76 0.49 4.57 1.88 1.75 1.30 Committed
effective dose
No regulation 0.40 0.29 0.30 0.24 1.20 0.63 0.72 0.64
Apply PRV 0.16 0.14 0.19 0.17 0.33 0.22 0.31 0.30
Apply present standard limit 0.16 0.14 0.19 0.17 0.33 0.22 0.31 0.30 1) calculated on the assumption that foods exceeding the standard limits or the PRVs are distributed
2) calculated on the assumption that marketed foods do not exceed the PRVs 3) calculated on the assumption that marketed foods do not exceed the standard limits
Table 4 Effective dose from foods
Yamaguchi I., Terada H., Kunugita N., Takahashi K. Dose estimation from food intake due to the Fukushima Daiichi nuclear power plant accident. J. Natl. Inst. Public Health. 2013; 62(2): p.138-143. (in Japanese)
Fig. 4 Committed effective dose from radiocesium after Fukushima nuclear power plant accident
2011: results obtained by market basket method 2012~2014: results obtained by duplicate portion method
0 5 10 15 20 2011 2012 2013 2014 C om m itt ed e ffe cti ve dos e( μSv ) Year Sendai City Fukushima City Tokyo
Fig. 4 Committed effective dose from radiocesium after Fukushima nuclear power plant accident
2011: results obtained by market basket method 2012~2014: results obtained by duplicate portion method
suggest that concentrations of those radionuclides were within the range of before the FDNPP accident. Similar results were found by the NIHS [43].
The WBS surveys were conducted by Tsubokura et al. Their results also suggested that annual additional effective dose from internal radiation exposure of Fukushima residents were below 1 mSv and consistent with estimation by WHO and United Nations Scientific Committee on the Effects of Atomic Radiation (UNSCEAR) [44-48].
According to Sugiyama et al., committed effective doses from radioactive cesium were below 0.4 μSv before the FDNPP accident [49]. Though the internal doses are still higher than before the accident, we can conclude that committed effective doses due to food consumption are estimated to be sufficiently below the maximum permissible level and that measures taken by the Government of Japan after the FDNPP accident were reasonably successful from the results described above.
V
.Conclusion
The FDNPP accident was the second severest nuclear disaster ever. However, almost all of the foods other than wild mushrooms, wild animal meat, wild vegetables, freshwater fish, and some saltwater fish are below the standard limits. Furthermore, committed effective doses due to food consumption are estimated to be sufficiently below the maximum permissible level. Thus, it can be concluded that measures taken by the Government of Japan after the FDNPP accident were reasonably successful. The lessons learned from the experience of the FDNPP accident will help responses to future nuclear disasters.
Acknowledgements
This study was partially supported by special research funding from the Japanese Ministry of Health, Labour, and Welfare.
Conflict of Interests
The authors declare that there is no conflict of interests regarding the publication of this article.
References
[1] Iwashima K. Interim limit for radiocontamination of imported foods in Japan (tentative translation). Jpn J Health Phys. 1988;23:63-67. (in Japanese)
[2] MHLW. Results of Monitoring and Guidance Based on the Imported Foods Monitoring and Guidance Plan for
FY 2016 2017. http://www.mhlw.go.jp/topics/yunyu/ keikaku/dl/16-08.pdf (accessed 2018-01-10)
[3] Hamada N, Ogino H. Food safety regulations: what we learned from the Fukushima nuclear accident. J Environ Radioact. 2012;111:83-99.
[4] MHLW. Handling of food contaminated by radioactivity (Relating to the accident at the Fukushima Nuclear Power Plant). 2011. http://www.mhlw.go.jp/english/ topics/foodsafety/dl/food-110317.pdf (accessed 2018-01-10)
[5] FSCJ. All concerned in overseas: Message from chairperson of FSCJ On the occasion of completing an emergency report on radioactive nuclides in foods.2011. http://www.fsc.go.jp/english/emerg/radiolog_iincho_ danwa.pdf (accessed 2018-01-10)
[6] Suga S, Ichikawa R. On the revision of control index levels on the ingestion of food and water in the guidelines for radiological emergency preparedness and countermeasures in Japan. Jpn J Health Phys. 2000;35:449-466. (in Japanese)
[7] ICRP. Principles for intervention for protection of the public in a radiological emergency. ICRP Publication 63. Ann. ICRP. 1992;22(4).
[8] IAEA. International basic safety standards for protection against ionizing radiation and for the safety of radiation sources. IAEA. 1996. Safety Series No. 115.
[9] Inaba J. On the criteria of protective action for consumption of food and drinking water. Jpn J Health Phys. 2011;46:184-188. (in Japanese)
[10] MHLW. Handling of provisional regulation values for radioactive iodine in fishery products. 2011. http://www. mhlw.go.jp/english/topics/2011eq/dl/food-110405.pdf (accessed 2018-01-10)
[11] FSCJ. Emergency report on radioactive nuclides in foods. 2011. http://www.fsc.go.jp/english/emerg/ emergency_report_radioactive_nuclides.pdf (accessed 2018-01-10)
[12] FSCJ. Risk assessment report on radioactive nuclides in foods. 2011. http://www.fsc.go.jp/english/emerg/ abstract_risk_assessment_report.pdf (accessed 2018-01-10)
[13] CODEX. Codex general standard for contaminants and toxins in food and feed.
http://www.fao.org/fao-who-codexalimentarius/sh-proxy/ fr/?lnk=1&url=https%253A%252F%252Fworkspace. fao.org%252Fsites%252Fcodex%252FStandards%252F CODEX%2BSTAN%2B193-1995%252FCXS_193e.pdf (accessed 2018-01-10)
[14] WHO. Guidelines for drinking-water quality 4th ed. 2011.
Regulation values and current situation of radioactive materials in food 1/9789241548151_eng.pdf (accessed 2018-01-10)
[15] Iwaoka K. The current limits for radionuclides in food in Japan. Health Phys. 2016;111:471-478.
[16] MEXT. Results of the nuclide analysis of Plutonium and Strontium by MEXT. 2011. http://radioactivity.nsr.go.jp/ en/contents/5000/4167/24/1750_093014.pdf (accessed 2018-01-10)
[17] MEXT. Results of the survey on the distribution of radioactive substances by MEXT (Survey on the movement of radioactive substances in river water and well water). 2011. http://radioactivity.nsr.go.jp/en/conte nts/5000/4173/24/1750_102018.pdf (accessed 2018-01-10)
[18] MEXT. Preparation of distribution map of radiation doses, etc. (Maps of concentration of Tellurium 129m and Silver 110m in Soil) by MEXT. 2011. http:// radioactivity.nsr.go.jp/en/contents/5000/4168/24/1750_1 031e_2.pdf (accessed 2018-01-10)
[19] NISA. Regarding the evaluation of the conditions on reactor cores of units 1, 2 and 3 related to the accident at Fukushima Dai-ichi Nuclear Power Station, Tokyo Electric Power Co. Inc., 2011. http://dl.ndl.go.jp/view/pr epareDownload?itemId=info%3Andljp%2Fpid%2F6017 222&contentNo=1 (accessed 2018-01-10)
[20] FDA. Accidental radioactive contamination of human food and animal feeds: recommendations for state and local agencies. 1998.
https://www.fda.gov/downloads/MedicalDevices/.../ UCM094513.pdf (accessed 2018-01-10)
[21] Council Regulation (Euratom). 2016. Laying down maximum permitted levels of radioactive contamination of food and feed following a nuclear accident or any other case of radiological emergency, and repealing Regulation (Euratom).
http://eur-lex.europa.eu/legal-content/EN/TXT/PDF/?ur i=CELEX:32016R0052&from=EN (accessed 2018-01-10)
[22] NERHQ. Concepts of inspection planning and the establishment and cancellation of items and areas to which restriction of distribution and/or consumption of foods concerned applies.
http://www.mhlw.go.jp/stf/houdou/2r98520000017tmu-att/2r98520000017ts1.pdf (accessed 2018-01-10) (in Japanese)
[23] NERHQ. The revision of the "Concepts of inspection planning and the establishment and cancellation of items and areas to which restriction of distribution and/or consumption of foods concerned applies", 2017. http://www.mhlw.go.jp/english/topics/2011eq/dl/food_ revision_24_March_2017.pdf (accessed 2018-01-10) [24] MHLW. The method for testing radioactive cesium in
foods (tentative translation), 2012. http://www.mhlw. go.jp/shinsai_jouhou/dl/shikenhou_120316.pdf (accessed 2018-01-10) (in Japanese)
[25] MHLW. Levels of radioactive contaminants in foods tested in respective prefectures. 2012-2017. http://www. mhlw.go.jp/english/topics/2011eq/index_food_radioactive. html (accessed 2018-01-10)
[26] MHLW. Database of radioactive substances in food. 2013-2018.
http://www.radioactivity-db.info (accessed 2018-01-10) (in Japanese)
[27] MHLW. Restrictions on distribution and/or consumption of foods based on the Act on Special Measures Concerning Nuclear Emergency Preparedness on January 18, 2018 (tentative translation). 2018. http://www.mhlw.go.jp/ file/04-Houdouhappyou-11135000-Shokuhinanzenbu-Kanshianzenka/0000166097_34.pdf (accessed 2018-01-23) (in Japanese))
[28] MAFF. Regarding the feeding management of livestock in light of the nuclear power plant accident (tentative translation). 2011. http://www.maff.go.jp/j/kanbo/joho/ saigai/pdf/seisan_110321.pdf (accessed 2018-01-10) (in Japanese)
[29] MAFF. Regarding the standards for radioactive materials in feed to ensure that produced meat and milk does not exceed the provisional regulation values (tentative translation). 2011. http://www.maff.go.jp/j/syouan/pdf/5-10.pdf (accessed 2018-01-10) (in Japanese)
[30] MAFF. Regarding production and utilization of feed in light of the nuclear powerplant accident (tentative translation), 2011. http://www.maff.go.jp/j/press/syouan/ tikusui/110822.html (accessed 2018-01-10) (in Japanese) [31] MAFF. Regarding establishing the provisional tolerable
values for fertilizer, soil-improving material, soil and feeding including radioactive cesium (tentative translation), 2011. http://www.maff.go.jp/j/syouan/soumu/ saigai/shizai.html (accessed 2018-01-10) (in Japanese) [32] Prime Minister of Japan and His Cabinet. Press
Conference by the Chief Cabinet Secretary (Excerpt). 2011. http://japan.kantei.go.jp/incident/press_conferences/ ccs/201107/110719_1606_p.html (accessed 2018-01-10) [33] Shimura T, Yamaguchi I, Terada H, Yunokawa T,
Svenden ER, Kunugita N. Efficiency of excess monitoring for beef after the Fukushima accident. Food Safety. 2015;3:84-91.
[34] The council for ensuring the safety of foods produced in Fukushima Prefecture. Infomation on results of all bag tests for radioacite materials (tentative translation), 2014-2018. https://fukumegu.org/ok/kome/year/17 (accessed 2018-01-10) (in Japanese))
future direction of all bag tests for radioacite materials in rice(tentative translation), 2018. https://www.pref. fukushima.lg.jp/uploaded/attachment/250538.pdf (accessed 2018-01-26) (in Japanese)
[36] MAFF. Regarding provisional safety standards for mushrooms logs and beds (tentative translation), 2012. http://www.rinya.maff.go.jp/j/tokuyou/shiitake/sihyouti. html (accessed 2018-01-10) (in Japanese)
[37] Yamaguchi. I, Terada. H, Kunugita. N, Takahashi. K Dose estimation from food intake due to the Fukushima Daiichi nuclear power plant accident, J Natl Inst Public Health. 2013;62:138-143. (in Japanese)
[38] MHLW. The National Health and Nutrition Survey of Japan 2010.
https://www.e-stat.go.jp/stat-search/files?page=1&l ayout=datalist&toukei=00450171&kikan=00450& tstat=000001041744&cycle=7&tclass1=0000010 51129&survey=%E5%81%A5%E5%BA%B7&res ult_page=1&second2=1 (accessed 2018-01-10) (in Japanese)
[39] ICRP. ICRP Database of dose coefficients: Workers and members of the public; Ver. 3.0. http://www.icrp.org/ page.asp?id=145 (accessed 2018-01-10)
[40] Harada KH, Fujii Y, Adachi A, Tsukidate A, Asai F, Koizumi A. Dietary intake of radiocesium in adult residents in Fukushima Prefecture and neighboring regions after the Fukushima Nuclear Power Plant accident: 24-h Food-duplicate survey in December 2011. Environ Sci Technol. 2013;47:2520-2526.
[41] Sato O, Nonaka S, Tada JI. Intake of radioactive materials as assessed by the duplicate diet method in Fukushima. J Radiol Protect. 2013;33:823-838.
[42] Terada H, Iijima I, Miyake S, Yamaguchi I, Ota T, Kodama H and Sugiyama H. Evaluation of various radioactive materials intake from foods in Japan. MHLW Grant Research Report (FY2012-FY2014) (tentative translation). 2015 (in Japanese)
[43] Tsutsumi T, Nabeshi H, Ikarashi A, Hachisuka A, Matsuda E. Estimation of the committed effective dose of radioactive cesium and potassium by the market basket method. Food Hyg Saf Sci. 2013;54:7-13. (in Japanese)
[44] Tsubokura M, Gilmour S, Takahashi K, Oikawa T, Kanazawa Y. Internal radiation exposure after the Fukushima Nuclear Power Plant disaster. JAMA. 2012;308:669-670.
[45] Tsubokura M, Kato S, Nihei M, Sakuma Y, Furutani T, Uehara K, et al. Limited internal radiation exposure associated with resettlements to a radiation-contaminated homeland after the Fukushima Daiichi Nuclear disaster. Plos One. 2013; 8(12):e81909.
[46] Tsubokura M, Kato S, Nomura S, Morita T, Sugimoto A, Gilmour S, et al. Absence of internal radiation contamination by radioactive cesium among children affected by the Fukushima Daiichi nuclear power plant disaster. Health Phys. 2015;108:39-43.
[47] UNSCEAR. Annex A: Levels and effects of radiation exposure due to the nuclear accident after the 2011 great east-Japan earthquake and tsunami, UNSCEAR 2013 report: sources, effects and risks of ionizing radiation. 2014;
http://www.unscear.org/docs/publications/2013/ UNSCEAR_2013_Annex-A-CORR.pdf (accessed 2018-01-10)
[48] WHO. International Expert Working G. Health risk assessment from the nuclear accident after the 2011 Great East Japan Earthquake and Tsunami, based on a preliminary dose estimation. http://www.who. int/ionizing_radiation/pub_meet/fukushima_risk_ assessment_2013/en/ (accessed 2018-01-10)
[49] Sugiyama H, Terada H, Takahashi M, Iijima I, Isomura K. Contents and daily intakes of gamma-ray emitting nuclides, 90Sr, and 238 using market-basket studies in Japan. J Health Sci. 2007;53(1):107-118.
Regulation values and current situation of radioactive materials in food