地域別騒音の場所的分布 第9報 : 東京都内の公園の騒音
10
0
0
全文
(2) ^m^fi^K^ (JSgZgRA) ^Ifj- Bgffl62^10j:3. Journal of Hokkaido University of Education (Section II A) Vol. 38, No. 1 October, 1987. i^o^m^w w w n % %9^g ^ww&swm.^-. w^is^w^wm-^m Noise Distribution Report No. 9 Park Noises in Tokyo. Shigeru TAKEUCHI Physics Laboratory, Asahikawa College, Hokkaido University of Education Asahikawa 070. Abstract We report the summarized result of measurements made of noises at three parks in Tokyo.. The measurements were carried out from about the end of July until the early of Aug., 1986, at Ueno Park, Hibiya Park and the Outer Gardens of the Imperial Palace. In each of the above mentioned zones the noises were measured at 10 different point, chosen by an arbitrary sampling method. The main results are as follows:. a ) Sound levels and conditions at each of the measuring points are shown in Table 1—3. b) Examples of the measurement of noise levels at each park are summarized in Fig. 1—6.. c ) Photographs of the representative landscape of each park.. 1. Introduction Street noises in Tokyo have already been measured by J. Morita (1953)1), while the noise distribution in various zones has been measured by T. Mochizuki and N. Imaizumi (1967)2', Noise-induced shifts in the pitch of pure and complex tones have also been studied by Adrianus J. M. Houtsma (1981)3'. The noises of busy streets and underground markets in Tokyo and Sapporo have subsequently been measured by S. Takeuchi (1982)4', (1984)6>, (1985)8>, (1986)9> and (1986)10>, who has also measured commercial, industrial, residential and amusement zone noises. in Asahikawa (1983)6', (1985)7) and (1987)n>.. (17).
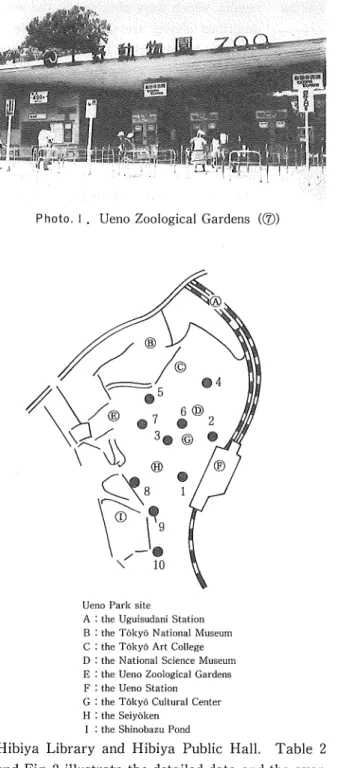
(3) 18. Shigeru TAKEUCHI The purpose of the present investigation was to measure noises in certain Tokyo Parks,. as calculated by a sound level meter (type 1015A). Accordingly, three locations weve selected: Ueno Park, Hibiya Park and Outer Gardens of the Imperial Palace. Noises were measured at 10 different points at the above mentioned sites, some of the points chosen arbitrarily. The meaning of arbitrary selection is as follows. In arbitrary selection the observation points are chosen so as to represent the general level of noise in the area. At each point, the sound level. in dB (A) is measured 50 times at intervals of 5 seconds. If N. L.-variation from time to time is divided into M {M—>W) N. L. s having equal durations which are sufficiently small AT, the average value of N. L. s. <+AT. lim. (D. N. Ldt, AT = TIM.. M—>co ^y •T J t. and each is considered to represent one 'instant value'. The sound level in the AT eterm at the unit variation,. (2). m/M = f(x)d.x, F(x) = f f{x)dx, F(oo) = 1 -00. f(x)dx and F(x) is the ratio of the number of the unit variation in the T. At the same time F(x) and f(x) is the N. L. s time rate distribution and density function in the T. The Mode, Median and 90% range were obtained statistically from these 50 pieces of data to represent the noise level distribution. These precedures are in accordance with the Japanese Industrial Standard JJSZ-8731 "IVtethods of Measurement of Sound Levels".. 2. Result of investigation a) Ueno Park site Let us first examine the noise levels of the Ueno Park site, near Ueno Station. It is bounded on the east by Ueno Station, on the west by Tobyo Art College, on the north by Uguisudani Station, on the South by Shinobazu Pond. Table 1 and Fig. 1 illustrate the detailed data and the average sound level at 10 different points selected arbitrarily around the Ueno Park site. Both the cawing of crows and distant vehicular traffic noises show that it is a quiet place. The measured results, which were obtained in the way described above, are shown in Table 1. As in the lower part of Fig. 1, the median sound levels are arranged in an order. increasing in magnitude as the circular Tablet Sound levels and conditions of the measuring spots plot the measured values in the. points: Ueno Park site, Tokyo _^ g^g ^gy^^ ^^g ^ ^^ ^ represent-. Test. z< Park. CatcEory Public garden. Mode. No.. d). ® ® ® ® ® ® ® ®. 10. 20 10. 30 10. 53 11. 0-J 11. 39 II. 50 12. 15 12. <7 13. 05 13. 18. 59 57 62. 55. 58, 60. 60 57 58 S2 55 55. Sound levels dB (A) Median. 59 58 62 60 60 56 59 52 55 56. ed by the black spots. Solid lines move 90% range S7—63 54—72. 61~6<. 52—68 58-67 53—62 S7--62 50—61 53-60 54—61. (18). up and down to show the difference within a 90% range. A central solid line shows the average value of the medians. and indicates that the average sound level is 57.7 dB (A). The dotted lines.
(4) Noise Distribution Report No. 9 Park Noises in Tokyo. 19. show both its lowest and highest points as well as the average values with both lower limit values and upper limit values within a 90% range. Their average sound levels are shown as 54.9 and 64.0. dB (A) respectively. In the upper part of Fig. 1 values from d) to ® show the position of the measured points, while letters from A to I are used to show the most conspicuously noisy places at the Ueno Park site. Photo. 1 affords an. Photo. I . Ueno Zoological Gardens (@). example of this.. b) Hibiya Park site Let us now examine the noise. levels at the Hibiya Park site, near the Hibiya Moat. It is bounded on the north by the Hibiya Moat, on the south by the. Ueno Park site the Uguisudani Station the Tokyo National Museum the Tokyo Art College the National Science Museum the Ueno Zoological Gardens the Ueno Station the Tokyo Cultural Center the Seiyoken the Shinobazu Pond. Hibiya Library and Hibiya Public Hall. Table 2 and Fig. 2 illustrate the detailed data and the average sound level at 10 different points selected arbitrarily around the Hibiya Park site. Both the sounds of the cicada and distant vehicular traffic noises show that it is a quiet place. The measured. (19). Fig. I . Examples of measurement at. park quarter : Ueno park site, Tokyo 10 measuring points and sound levels obtained..
(5) 20. Shigeru TAKEUCHI. Ta b Ie 2 Sound levels and conditions of the measuring points; Hibiya Park site, Tokyo Category. Test No.. ® © ® ® © ® ® ® ® ®. Time 15. 36 15. 54 16. 10 16. 23 16. 34 16. 51 17. 01 17. 17 17. 27 17. 37. Sound levels dB (A) Mode. 67. Median. 59. 61. 59. 63. 58. 68. 58. 59 62. 68 61. 61. 59 63 58 68. described above, are shown in Table 2.. As in the lower part of Fig. 2, the median. Public garden. Park. results, which were obtained in the way. 90% range 65-79 59-64 59~63 57-61 59-6G 56-59 66-68. 58. 57-59. 59. 58-64. 61. 59-63. sound levels are arranged in an order increasing in magnitude as the circular. spots plot the measured values in the same figure, while the modes are re-. presented by the black spots. Solid lines move up and down to show changes. within a 90% range. A central solid line shows the average value of the median and indicates that the average sound. level is 61.6 dB (A). Dotted lines show both its lowest and highest points as well as the average values with both lower. limit values and upper limit values within a 90% range. Their average sound. levels are shown as 59.5 and 64.5 dB (A) 90 Photo. 2. Large Fountain ((3)). ^ m T3. 80. ®®@ -0. 0 ?1. 0. 0). 70. 0. 60. 0 ®. "&"0. ®®®®® Hibiya Park. 50. the Hibiya Moat. Fig. 2. Examples of measurement at. the Shinji Pond the Park Center. park quarter ; Hibiya Park site,. the Large Fountain the Hibiya Public Hall. Tokyo 10 measuring points and sound levels obtained.. the Hibiya Library. (20).
(6) 21. Noise Distribution Report No. 9 Park Noises in Tokyo Table 3 Sound levels and conditions of the measuring points: Outer Gardens of the Imperial Palace site, Tokyo Zone Park. Test. Cateeory PubHc garden. Sound levels dB (A). Mode. No,. ~w ® ® ® ® ® ®. 0. 38 0. 51 1. 0-1 1. 29 I. 2. 2. 2. 3. 3.. ® ®. W K) 26 41 01 17. Median. 56 54 60 62 59 56. 58, 59. 57 58 65. 56 55 62 62 59 55 59 59 66 65. respectively. In the upper part of Fig. 2 values from ® to ® show the position of the measured points, while letters from A. 90% range 51-58 54—59 60-67 60—68 58—70 54—58 57-65 55—64 58-74 59—80. to F are used to show the most conspicu-. ously noisy places at the Hibiya Park site. Photo. 2 affords an example of this.. c) Outer Gardens of the Imperial Palace We also examined the noise levels. at the Outer Gardens of the Imperial Palace. It is bounded on the north by Kikyo Moat and Wadakura Bridge, on the south by Gaisen Moat and Hibiya Moat, on the west by Hamaguri Moat and Niju-bashi Moat, on the east by 90. Photo. 3 . Double Bridge before the entrance to the. \\. Imperial Palace (@). lot.. ©@®®®. ^\ ^ v^'.y^'. ^ /. ^>. ^>. -d. ri y 0 M 70(-. .•-. (D. c®. 60k. Outer Gardens of the Imperial Palace site the Wadakura Bridge. •-0. _u. L?_J). ®®®@. the Babasaki Moat the Hibiya Meat the Gaisen Moat. 501. the Sakurada Gate. Fig. 3. the Sakurada Moat. Examples of measurement at park quarter : Outer Gardens. the Double Bridge before the entrance to the Imperial Palace the Niju-basht Moat. of the Imperial palace site, Tokyo 10 measuring points. the Hamaguri Moat. and sound levels obtained.. the Kikyo Moafc. (21:.
(7) 22. Shigeru TAKEUCHI. Babasaki Moat and Hibiya Moat. Table 3 and Fig. 3 illustrate the detailed data and the average sound level at 10 different points selected arbitrarily along the Outer Gardens of the Imperial Palace site. Both distant vehicular traffic noises and the sound of foot steps show that it is a quiet place. The measured results, which were obtained in the way described above, are shown in Table 3. As in the lower part of Fig. 3, the median sound levels are arranged in an order increasing in magnitude as the circular spots plot the measured values in the same. figure, while the mode is represented by the black spots. Solid lines move up and down to show the difference within a 90% range. A central solid line shows the average value of the median and indicates that the average sound level is 59.8 dB (A). The dotted lines show both its lowest and highest points as well as the average values with both lower limit values and upper limit values within a 90% range. Their average levels are shown as 56.9 and 66.1 dB (A) respectively. In the upper part of Fig. 3 values from (D to ® show the position of the measured points, while letter from A to J are used to show the most conspicuously noisy places at the Outer Gardens of the Imperial Palace site. Photo. 3 affords an example of this.. ^. &. G <u y. 0'. h 101-. 50. 55. 60 65. lA 75. Sound level dB (A) Fig. 4. Relation between the sound level and the frequency percentage in the Ueno Park site. The solid line is calculated by the equation of Gaussian distribution curve and the measured values are represented by the triangular spots.. (22).
(8) Noise Distribution Report No. 9 Park Noises in Tokyo. 23. 3. Discussion a) Ueno Park site This area was the quietest in our sample and the average sound level was 58.3 dB (A), once dropping to 50.0 dB (A). For example, the lowest sound level recorded in front of the Seiyoken (®) was 50.0 dB (A), as aforesaid ; it is marked both by few people and the cawing of crows. But in front of the Fountain (@), the average sound level was 62.1 dB (A), because of both the sound of the Fountain and the Sounds of crows. The distribution percentage y of sound levels is give by the equation of the Gaussian distribution curve. A. &. 55. 60. 65 70 75. 80. Sound level dB (A) Fig. 5 . Relation between the sound level and the frequency percentage in the Hibiya Park site. The solid line is calculated by the equation of Gaussian distribution curve and the measured values are represented by the triangular spots.. y =. ], (x-mV. Ttff. (3). e 2o-2. in which o" is the standard deviation, o-2 the dispersion, x the sound level and m the average. sound level at the Ueno Park site. Fig. 4 is the relation between the sound level and the frequency percentage at the Ueno Park site. The solid line is calculated by the equation of the Gaussian distribution curve and the measured values are represented by the triangular spots.. (23).
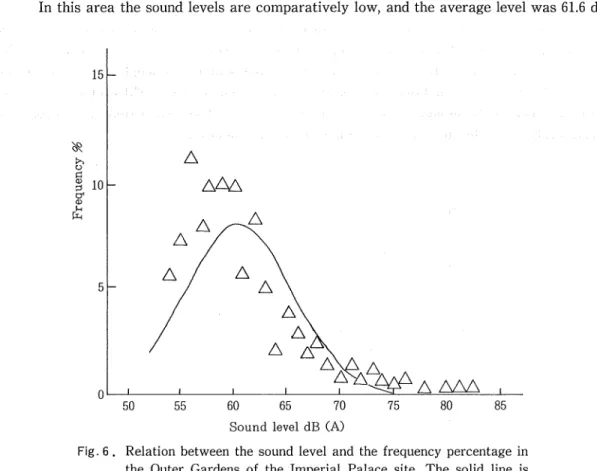
(9) 24 Shigeru TAKEUCHI. The measured values is in satisfactory agreement with the Gaussian distribution curve.. b) Hibiya Park site In this area the sound levels are comparatively low, and the average level was 61.6 dB. 50. 55. 60 65 70. 80. 85. Sound level dB (A) Fig. 6 . Relation between the sound level and the frequency percentage in the Outer Gardens of the Imperial Palace site. The solid line is calculated by the equation of Gaussian distribution curve and the measured values are represented by the triangular spots.. (A), often dropping to 55—57 dB (A). For example, the lowest sound levels were recorded in the neighborhood of the Hibiya Library (©), where the average sound level was 57.1 dB (A), because there were neither vehicular noises nor the sounds of passersby. But in front of the. Shinji Pond (®), the average sound level was 67.8 dB (A), because there were vehicular traffic noises. In the same manner as for the preceding data, Fig. 5 shows the relation between the. sound level and the frequency percentage at the Hibiya Park site. The solid line is calculated by the equation of the Gaussian distribution curve and the measured values are represented by the triangular spots. The measured values are very scattered, but their tendency coincides. approximately with the Gaussian distribution curve. c) Outer Gardens of the Imperial Palace In this area the sound levels were low, and the average sound level was 60.4 dB (A), often dropping to 52—54 dB (A). For example the lowest sound levels were recorded in front of the. (24).
(10) Noise Distribution Report No. 9 Park Noises in Tokyo 25. Sakurada Gate (®), where the average sound level was 60.4 dB (A), because there were neither high vehicular noises nor the sounds of passersby. But in front of the Kikyo Moat (®), the average sound level was 67.0 dB (A), because there were both much vehicular traffic and the quacking of spot bill ducks. In the same manner as for the preceding data, Fig. 6 shows the relation between the sound level and the frequency percentage at the Outer Gardens of the Imperial Palace. The solid line is calculated by the equation of the Gaussian distribution curve and the measured values are represented by the triangular spots. The measured values almost. coincide with the Gaussian distribution.. 4. Conclusion The average median sound levels at the Ueno Park site, Hibiya Park site and Outer Gardens of the Imperial Palace site were 57.7, 61.6 and 59.8 dB (A) respectively ; the average of the highest sound levels are 64.0, 64.5 and 66.1 dB (A); the averages of the lowest sound levels are 54.9, 59.5 and 56.9 dB (A). The average levels of sound within a 100% range for the Ueno Park site, the Hibiya Park site and the Outer Gardens of the Imperial Palace were 58.3, 61.6 and 60.4 dB (A) respectively, while the standard deviation of sound level was 4.04, 4.06 and 5.01 dB. (A).. Reference (1) S. Morita : J. Acoust, Soc. JPn. 9 (1953) 4. (2) T. Mochizuki and N. Imaizumi: J. Acoust. Soc. Jpn. 23 (1967) 3-4. (3) Adrianus J. M. Houtsma : J. Acoust. Soc. Am. 70 (1981) 6. (4) S. Takeuchi:J. Hokkaido Univ. educ. 33 (1982) 1. (5) S. Takeuchi: J. Hokkaido Univ. educ. 33(1983) 2. (6) S. Takeuchi:J. Hokkaido Univ. educ. 35 (1984) 1. (7) S. Takeuchi: J. Hokkaido Univ. educ. 35 (1985) 2. (8) S. Takeuchi: J. Hokkaido Univ. educ. 36 (1985) 1. (9) S. Takeuchi:J. Hokkaido Univ. educ. 36 (1986) 2. (10) S. Takeuchi: J. Hokkaido Univ. educ. 37 (1986) 1. (11) S. Takeuchi: J. Hokkaido Univ. educ. 37 (1987) 2.. (25).
(11)
図


関連したドキュメント
「1.地域の音楽家・音楽団体ネットワークの運用」については、公式 LINE 等 SNS
ここでは 2016 年(平成 28 年)3
Kita City, Tokyo Vision of Culture and the Arts 2020.. 第
Kita City, Tokyo Vision of Culture and the Arts 2020... 第
した。 6 月23 日に岡崎公園 Loops Park Stage,9 月8 日にロームシアター京都で Music Salon Concert, 2 月
また、手話では正確に表現できない「波の音」、 「船の音」、 「市電の音」、 「朝市で騒ぐ 音」、 「ハリストス正教会」、
After graduating from the Medical Department of Tokyo Imperial University, he was engaged as one of the specialists in a full-fledged survey of living conditions of workers
№3 の 3 か所において、№3 において現況において環境基準を上回っている場所でございま した。ですので、№3 においては騒音レベルの増加が、昼間で
