外有毛細胞のmotilityに果たすモーター蛋白質の機
能解明
著者
和田 仁
(1 1307033) 平成11年度∼平成12年度科学研究費補助金(基盤研究(A) (2))研究成果報告書 平成13年3月 研究代表者 和田 仁 (東北大学大学院工学研究科教授) 00021003590
「 二二二二二
外有毛細胞のmotilityに果たす
モーター蛋白質の機能解明
(1 1307033) 平成11年度∼平成12年度科学研究費補助金(基盤研究(A) (2))研究成果報告書 平成13年3月 研究代表者 和田 仁 (東北大学大学院工学研究科教授)研究組織
研究代表者:和田 仁(東北大学大学院工学研究科教授)
研究分担者:高坂知節(東北大学大学院医学系研究科教授)
研究分担者:池田勝久(東北大学大学院医学系研究科助教授)
研究分担者:菅原路子(東北大学大学院工学研究科助手)
研究経費
平成11年度 35, 300千円 平成12年度 3, 500千円 計 38, 800千円研究発表
・ 口頭発表菅原路子,和田仁,白倉寛人,局部的な外有毛細胞側壁の弾性特性解明,第
10回バイオエンジニアリング講演会・秋季セミナー, 1999年10月2日
菅原路子,和田仁,外有毛細胞に存在すると推察されるタンパク質モータの
分布,第10回日本耳科学会学術講演会, 2000年10月19日
Contents
Abstract
1. Background and introduction 1.1. Background
l.1.1. Cochlearfunction
l.1.2. Outer hair cell (OHC)
1. I.3. Cochlearamplification l.2. Introduction
2. Materials and methods
2.1. Local defbmation of the OHC
2.1.1. Cell preparation 2. 1.2. Hypotonic stimulation 2. 1.3. ElectriCalstimulation 2.1.4. Data analysis
2.2. Ultrastructure of the OHC lateralWal1
2.2. 1. Cell preparation
2.2.2. Atomic fわrce microscopy
3. Results
3.1. Local defbmation of the OHC
3. 1. 1. Cell shape changes evoked by eleectdcal stimulation 3. 1・2・ Cell shape changes evoked by hypotonic stimulation 3.2. Ultrastmcture of the OHC lateral wall
3.2. I. Tip-sample interaction
3.2.2. Circumferentialfilaments
4. Discussion
4.I. Local stiffness of the OHC
4.2. Distribution of protein motors
4.2. Ultrastmcture of the OHC lateral wall
4.3. Relationship between the localstiffness and the ultrastructure
5. Conclusions 6. References l つ 一 2 つ i 2 3 4 5 5 5 5 ′ 0 / h U 7 7 7 1 1 1 1 1 1 1 1 1 1 l 1 2 4 4 5 2 2 2 2 2 2 2 9 9 3 3 1 3 4 4 ′ 0 7 5 5
contract in response to an electdcal stimulation. This electromotility lS Suggested to
producethe force and affect the basilar membrane motion. As a result, the force
production of the OHC presumably leads to the fine tuning of the mammalian
co-chlea.Asthe electromotility would arise from a confomational change of
mol-ecules "protein motors" and they might distdbute along the OHC lateral wall, the
force generated bythe OHC electromotility would be related to the mechanicalprop-erties of the lateral wall. Therefore,to evaluate the OHC's ability to innuence the
basilar membrane motion and tuning, it is important to understand the mechanical
property of the OHC lateral wall and the distribution of protein motors. However,
they are not clear.
In this study, firstly, ln Order to understand the difference in the stiffness
along the cell axis, the local defbmation of the OHC in response to the hypotonic
stimulation is analyzed by measunng the displacement of the microspheres attached
randomly to the cell lateral wall. Then, in order to understand the distribution of the
protein motor along the cell axis, the local elongation and contraction of the OHC in
response to sinusoidal voltage stimulation are analyzed by measunng the displace一
ment of血e microspheres in the same way as the case of the hypotonic stimulation.
Finally, the ultrastructure of the OHC lateral wall is investlgated under near
physi-ological conditions by an atomic fわrce microscopy, and the relationship between血e
difference inthe stiffnessalong the cell axis and the ultrastructure which is observed
2
1. Background and introduction 1.1. Background
I.I.1. Cochlearfunction
The schema of human auditory system is shown in Fig. 1.1. The auditory
system is divided into extemal ear,middle ear and inner ear. The sound entenngthe
extemal auditory canal vibrates the tympa山c membrane. This vibration is mechanト
cally transmitted by the ossicles (malleus, incus and stapes) to the cochlea (Fig. 1 ・2).
Vibrations of the stapes generate movement of the cochlearfluids, which interact
withthe stiffness of the basilar membrane (BM), and produce progressive traveling wave on the BM. Figure 1.3 displays that the traveling waves onthe BM have a peak
near the base when high frequency sounds enter the cochlear, while low frequency
sounds develop the traveling waves on the BM which has a peak near the apex.
There is the organof Corti on the BM, and it contains an array of supportlng Cells,
Outer hair cells and inner hair cells (Fig. 1.4). When the sound enters the ear, the
organ of Corti has a bending motion. This bending motion generates the movement
ofthefluids in the space between the undersurface of the tectorial membrane and the reticular lamina, which leads to the deflection of the stereocilia of the IHCs (Fig.
I.5). By this deflection, the potential in the IHCs is changed and the transmitter is
released.Asa result, action potential is produced in the auditory nerve fiber. Owing
to this mechanism, we can丘nally hear the sounds.
1.1.2. Outer hair ceu (OHC)
The outer hair cell (OHC) is cylindrical shaped with a radius of 4-5 LLmand
a length of 30 - 90トLm (Fig. 1.6). It is capped by the cuticular plate with stereocilia
at the apical end and by血e synaptic membrane at the basal end・ As the cuticular
membrane, corticallatticeand subsurface cistemae (Fig. 1.7). The corticallattice is
located between the subsurface cistemae and it consists of two types of filaments: actin and spectrin (Holley and Ashmore, 1990)・ Actins, which are arranged circumferentially, are 5-8 nm in diameter and are crossllinked at regular intervals by thinner spectrins, 2-4 nm in diameter (Holley and Ashmore, 1988a; 1990a; 1990b;
Arima et a1., 1 991). The outemost plasma membrane is linked to the corticallattice
by the pillarsand contains a high density of membrane particles (Arima etal., 1991; Forge, 1991). The innemost subsurface cistemaeare known to be much more fluid
than the plasma membrane.
As the stereocilia has the ion channel, the intracellular potential is
depolar-ized and hyperpolardepolar-ized while the stereocilia is bending ln Vivo. Whenthe intracell
lular potential is depoladzed, the OHC contracts. On the other hand, the OHC elon一
gates when the intracellular potential is hyperpoladzed (Fig. 1.8). This OHC motiト
lty is thought to be associated with the conformational changes of the membrane
particles, which are called …motor protein." Recently, Zheng et al. indicated the
gene that codes for a specialized motor protein which produces the motility, and
designated it "Prestin."
1.1.3. Cochlear amplirICation
When the organ of Corti undergoes a bending motion, the stereocilia of the
OHCs bends due to the shear motion between血e tectodal membrane and the
reticu-lar lamina (Fig. 1.9)・ This bending of the stereocilia induces the OHCs motility.As
the force produced by the OHCs motility magnifies the deflection of the organ of Corti, the movement of the fluids in the space near the stereocilia of the IHCs and the deflection of the IHC stereocilia increases. Owing to the mechanism mentioned
4
above, our auditory system is characterized by high sensitivityand sharp tuning.
1.2. Introduction
It is well esta'blished that the isolated outer hair cell (OHC) can elongate and contract in response to an electdcal stimulation (Brownell et a1., 1985; Kachar et a1., 1986; Zenner, 1986; Ashmore, 1987; SantosISacchi and Dilger, 1988). In vivo, the
OHC is located between the reticular lamina and Deiters'cell on血e basilar me血brane,
and it is considered that the force produced by the OHC, which accompanies its motility, affects the basilar membrane motion・ As a result, the force production of the OHC presumably leads to the fine tunlng Of the mammalian cochlea.
It has been reported thatthe OHC length changes were still evoked by changlng
membrane potential via a patch electrode in the whole cell when血e cell was digested
by intemally perfusing the cytoplasm with trypsin (Kalinec et a1., 1992). The same experiment was also done by Huang and Santos-Sacchi (1994) and the destmction of the cortiCallattice andthe subsurface cistemae by trypsin was confirmed by electron
microscopy・ Based on these experimental findings and microscopic Study of
membrane particles which were clearly visualized in the lateral plasma membrane
(Forge, 1991; Kalinec et a1., 1992), the OHC motility is thought to be associated
with the conformational changes of membrane particles, called motor proteins. This
is evidenced by the whole-cell patch-pipette recording, which confirms the existence
of a nonlinear gating charge movement or a nonlinear capacitance (Santos-Sacchi,
1991). Recently, Zheng et al. (2000) identi丘ed the gene that codes fわr a specialized
motor protein which produced the motilityand designated it "Prestin." When prestin
was expressed in the cultured human kidney cells, the cell showed motile response and nonlinearcapacitance (Zheng etal. , 2000). Therefore, prestin is the motor protein
To evaluate the OHC's ability to influence the basilar membrane motion and tunlng, lt is important to understand the mechanical property of the OHC lateralWall
and the distribution of protein motors・ It has been reported that the longitudinal
whole cell stiffness was measured from the length change of the OHC in response to
the extemalstimulus is inthe range ofO.8 - 25 mN/m (Zenner et a1., 1992; Hallworth,
1995)・ However, as the structural difference exists between the apical part which has the cuticular plate and the basal part which has a half spheriCalshape (Fig. 1.6), there is a possibility that the local stiffness in the specific reg10n Ofthe OHC would
be different from that in the other reg10nS・ Besides, although it has been reported
that protein motors distdbute in the restricted area of the cell (Holley, et a1., 1988b;
EvanS, 1990; Hallworth, etal., 1993), the detail of the restrictedareaand distribution
of the protein motors are not clear.
In this study,firstly, in order to understand the difference in the stiffness along the cell axis,the localdeformation of the OHCinresponse to the hypotomic stimulation
is analyzed by measunng the displacement of the microspheres attached randomly
to the cell lateral wall. Then, in order to understand the distdbution of the protein
motor along血e cell axis,血e local elongation and contraction of也e OHC in response
to sinusoidal voltage stimulation are analyzed by measunng the displacement of the
microspheres in the same way・ as the case of the hypotonic stimulation. Finally, the
ultrastructure of the OHC lateral wall is investigated under near physiological
conditions by an atomic forcemicroscopy,andthe relationship betweenthe difference
in the stiffness alongthe cell axis and the ultrastructure which is observed from the
AFM imaglng is discussed.
6
E xtemal
ear
Malleus
Incus Stape s VestibuleCochlea
Extemal canal Tympanic membrane
Figure 1. 1. Schema of human auditory system・ The auditory system is divided into external ear, middle ear and inner ear. The sound entering the external auditory
canal vibrates the tympanic membrane. This vibration is mechanically transmitted
by the ossicles (malleus, incus and stapes) to the cochlea・
r e r
a
e
e 1 i d d 甜 MOrgan of Corti Basilar membrane
Figure l・2・ Outline of the cochlea ofhuman・ The cochlea has spiral shape which is
filled withfluid・ When the stapes delivers vibrations from the middle ear to the
fluid-filled cochlea, due to the change in the fluid pressure, the travelling wave oc-cur to the basilar membrane・ The basilar membrane supports the sensory organ of
8
(a) VVVVVb
Stapes B asilar membrane
・b) 帆
Figure 1.3. Traveling waves on the basilar membrane・ Vibrations of the stapes
generate movement of the cochlearfluids, which interact with the stiffness of the basilarmembrane (BM), and produce progressive traveling wave on the BM. (a) The traveling waves on the BM have a peak near the base when high frequency sounds
enterthe cochlear. (b) The lowfrequency sounds develop the traveling waves on the
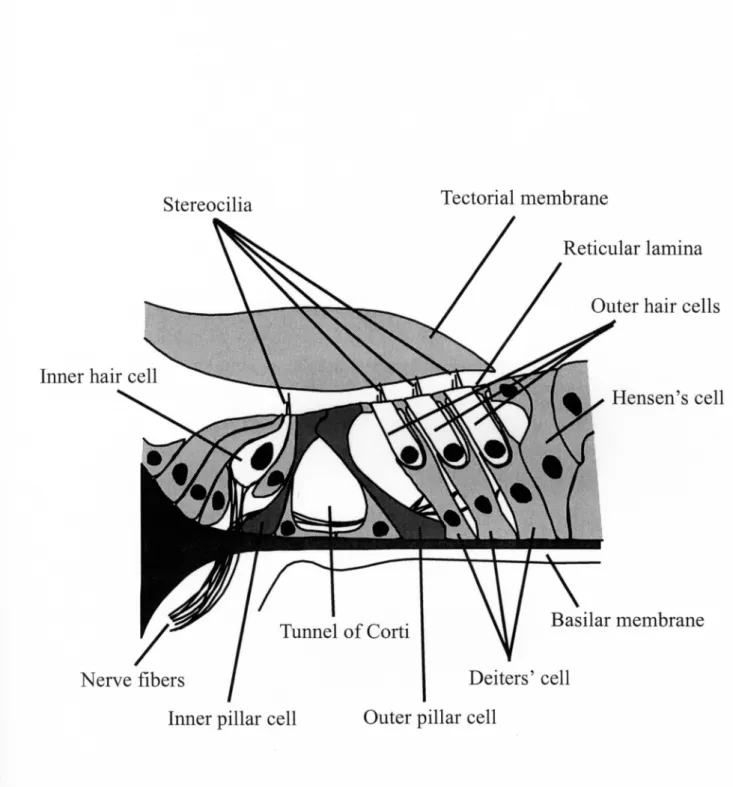
Stereocilia Tectorial membrane
Inner pillar cell Outer pillar cell
Figure 1.4. Structure of the organ of Corti. The organ of Corti sits on the basilar
membrane,and it contains an array of supportlng Cells, outer hair cells and inner hair cells. Tectorial membrane is above the organ of Corti.
10
(b)
Figure 1.5. Mechanism of the transduction in the organ of Corti. (a) Resting state of
the organ of Corti. (b) Bending motion of the organ of Corti. When the sound enter
the ear, the organ of Corti has a bending motion. This bending motion generates the movement of the fluids in the space between the undersurface of the tectorial
mem-brane and the reticular lamina, which leads to the deflection of the stereocilia of the
IHCs. By this deflection, the potentialinthe IHCs is changedandthe transmitter is
5LLm
Figure 1.6. Longitudinalsection of the outer hair cell which is observed using trans-mission electron microscope (Saito, 1983). Outer hair cell is charactedstically
cy-lindriCalin shape with a hair bundle, stereocilia, at its apical endand a nucleus near its base. It varies in length from 30 pm to 90 pm,and it has a regular diameter of 10 Pm・
12
OHC
Fig・ 1・7・ Lateral wall of the OHC・ The OHC lateral wall consists of three layers: plasma membrane, Cortical lattice and subsurface cistemae. The cortical lattice is
located between the subsurface cistemaeand the plasma membrane,and it consists
of two types of filaments: actin and spectrin・ Actins, which are arranged circumferentially, are 5-8 nm in diameterand are cross-linked at regularintervals by thinner spectrins, 2-4 nm in diameter・ The outermost plasma membrane is linked to
the cortical lattice by the pillarsand contains a high densityof membrane particles.
The innermost subsurface cistemae areknownto be much more nuidthan the plasma
membrane.Depolarization
Motor Protein
Figure 1.8. 0HC electromotility. As the stereocilia has the ion channel, the
intrac-ellular potential is depoladzed and hyperpolarized while the stereocilia is bending
in vivo. When the intracellular potentialis depolarized, the OHC contracts. On the
other hand, the OHC elongates when the intracellular potential is hyperpolarized・
This OHC motility is thought to be associated with the confomational changes of
the membrane particles, which are called "motor protein・"
t t Z ! t u a ) O d J t ! t n l t O C , t ! J t u l
14
(b)
Fig・ 1・9・ Cochlearamplification. (a) Resting state of the organ of Corti. (b) Bendl
lng motion of the organ of Corti・ When the organ of Corti undergoes a bending
motion, the stereocilia of the OHCs bend due to血e shear motion between the tecto-dal membrane and the reticular lamina. This bending of血e stereocilia induces the
OHCs motility・Asthe force produced by the OHCs motility magnifies the
deflec-tion of the organ of Corti, the movement of the fluids in the space near the
2.1. Local deformation of the OHC
2.1.1. Cell preparation
Guinea pigs (200-300g) were decapitated and也e temporal bones were removed.
After openlngthe bulla, the cochlea was detached and transferred to the experimental
bath (the m亘ior ions in the medium are: NaCl, 140mM; KCl, 5mM; CaC12, 1・5mM;
MgC12. 6H20, 1・5mM; HEPES, 5mM; Glucose, 5mM; pH 7.2; 300mOsm). The
bony shell covenng血e cochlea was removed and the middle two tums of the organ
of Corti were gently scraped off from the basilar membrane・ After enzymatic incubation with dispase (500PU/ml), the OHCs were isolated by pipetting gently the organof Corti in the experimental bath. The isolated OHCs were transferred to
a chamber, and the medium, which containedmicrospheres O・75トIm in diameter,
was perfused from the pIPette・ Under these procedures, the microspheres were randomly attached to each cell・ All experiments were performed at a room
temp erature ・
2.1.2. Hypotonic stimulation
The OHCs were pe血sed with血e hypotonic solution (H20; OmOsm) through
the pipette having tlp SIZeS Of 10-2叫m・ As the osmotic pressure of血e hypotonic
solution was lower than the intracellular osmotic pressure of the OHC, the osmotic water was transported across the cells membrane・ As a result,the intracellularpressure
was increased, and the cell shape change was evoked・ The images of the cell were
stored with a CCD camera system (C2400, HAMAMATSU).
16
The OHCs were whole-cell voltage clamped, uslng an Axon 200B amplifier
with patch pipettes having initial resistances of 315 Mf2, corresponding to tip sizes
of 1-2pm (Hamill etal・, 1981)・ The patch pipette solution was composed of 150mM
KCl, 2mM MgC12・ 6H20, 10mM EGTA and lOniM HEPES buffered to pH7・2・ A
sinusoidal command voltage of 120mV in amplitude and 5Hz in丘・equency, was
applied to the cell・ The images of the cell were stored with a high speed video
system (HSV1500DM, mac)・ The record rate of this system was 250 frames per
second which was about eight times faster thanthat of the conventionalvideo systemwith 30 frames per second.
2.1.4. Data analysis
In this study, every Images Were analyzed off-line uslng a Personal computer・ One pixel in the recorded digital picture from the CCD camera system corresponded to 210nm, and that from the high speed video system was equal to 150mm・ Each
pixel was quanti丘ed to 256 grayscales・ For the purpose of analyzlng a microsphere displacement smaller than 1 pixel, a high十reSOlution motion detection method was
applied (Fig・ 2・ 1)・ quanti丘cation of血e movement was done on血e digitized images
by placing a measunng rectangle arbitrary aligned across the microsphere on the
cell lateral wall (Fig・ 2・1(a))・ At an arbitrary time slice, changes in the brightness
alined along the measunng rectangle were丘tted by a cubic regression line, and the
peak of the fitted line was detemined to be the position of the microsphere (Fig.
2・1(b))・ At another time slice, a cubic regression line was also obtained, and the
displacement of the microsphere was calculated from the shift in the peak of the ntted lines (Fig. 2. I(b)).
In this analysis, the noise in the recorded digital picture and Brownian motion
without the perfusion nor the electrical stimulation・ The time histories of the position
of thefixedmicrosphere inthe recorded digitalpicture from the CCD camera system
are depicted in Fig・ 2・2,andthe figure showsthat the position ofthefixedmicrosphere
at every tlme Slices varies・ Therefore, the maximum difference of the position in
Fig・ 2・2 was decided to be the value of the analytical error in the recorded digital
picture from the CCD camera system and it corresponded to 170nm. In the same
way, the value of the analytical error in the recorded digital picture from the high
speed video system was evaluated and corresponded to 120nm.
2.2. Ultrastrueture of the OHC 2.2.1. Cell preparation
The OHCs were isolated血・om apical and middle two tums of the organ of Cor【i
in the same way as shown in section 2.1.I. The isolated OHCs were transferred to a chamber and fixed in thre 2・5% glutaraldehyde in phosphate buffer for 30 min at
room temperature・ After fixation, the OHCs were washed with an experimental
bath.
2.2.2. Atomic force microscopy
lmages of the OHC lateral wall were recorded in the expedmental bath with an
AFM (NVBIOO, OLYMPUS)・ The AFM was mounted onaninvertedmicroscope.
Vshaped silicon nitride cantilevers and pyramidal tips (OMCL-TR400PSA-2,
OLYMPUS) were used. The spring constant of the cantilever was 0.08 N/m and
tip's typical radius of curvature was less than 20 mm・ In this experiment, tapping
18
frequency inthe vertiCaldirection and was only intemittently in contact withSample・
The images obtained bythe measurement from the AFM were analyzed by the
software provided by Digital Instruments. In order to reduce the noise and correct for tilt,the images were flatten and planefit・ The features of the images were evaluatedby the section analysis. In this analysis, the images were sectioned to lean about
Microsphere
/ 僮
[柑宅鞘儲部将軸靭帯鮮≠認 剏ホ相野的洩Tl d町儲出城劫帯鞍梯接触技荘讃野 Displa I 0 l 白 ツ l I cement 5 10 15 20 Distance (pixel)Fig・ 2・ 1・ Quanti丘cation of血crosphere displacement. (a) Basal part of an OHC at
an arbitrary time slice・ A measurlng rectangle arbitrarily aligned across the
microsphere is shown,and it composes of 4 rows of pixels. (b) Changes in brightness
along the measunng rectangle. The mean brightness is calculated for each vertical column of the pixels inside the measunng rectangle, and plotted by a solid circle. The solid circles obtained by a repetition of this procedure are fitted by a cubic
regression line and its peak is deter血ned to be a position of the血crosphere at an
arbitrary time slice・ Next, at another time slice, the mean brightness is calculated in
the same way and shown bythe open circles・ Theyare also fitted by a cubic regression line and its peak is determined to be a position of the microshere at another time
slice・ Finally, the distance betweenthe two peaks is quantified to bethemicrosphere
displacement. ( s l ! u n h e J l ! q J t 2 ) a 一 e 3 S ^ e J 9 0 0 6 4 1 1 0 0 0 2 0 8 1 1
20
0 1 0 20 30 40 50 60
Time (msec)
Fig・ 2・2・ Time histories of the position of the fixed microsphere in the recorded
digital picture from a CCD camera system without the perfusion nor the electrical
stimulation・ The position of thefixedmicrosphere at sometime slices varies because
of the analytical e汀Or Which is caused by the noise in the recorded digital picture
and Brownian motion of the microsphere. The value of the analytical error is
calculated from the maximum difference of the positionand corresponds to 170nm・
( ∈ u ) l u a ∈ 9 3 e 一 d s ! Q 00 50 1 1
3.1. Localdeformation of the OHC
3・1・1・ Cell shape changes evoked by the hypotonic stimulation
When the OHCs were pe血sed with the hypotonic solution, the cell shape
changes were evoked and也e cylindrically shaped OHCs showed large longitudinal
shortening and small circumferential extension・ As the longitudinal stiffness was concemed with the electromotility,the longitudinaldisplacement values of the several
polntS On the cell were measured・ The measurement polntS On One Of the cells are shown in Fig・ 3・ 1 (a), and the longitudinal displacement values of the measurement
points at 5% shortening of the cell length are depicted in Fig. 3. 1(b). The abscissa represents the distance of each measurement point from the basalend of the cell, and
the positions of the basal and apical ends along血e cell axis are converted to 0.0 and
1 ・0, respectively・ The ordinate represents the displacement values of the measurement
points・ As the direction of the a汀OW in Fig. 3.1(a) represents the positive of the
displacement, it is clear that the displacement value at the center part of the cell is zero and the basal and apical parts move toward the center of the cell. Besides, it is
obvious that the displacement valuesare almost constant to be - 1.36pm (displacement
at the apicalend) in the region nearthe apical end, and they vary linearly in the other
reglOn・ In order to co汀elate the displacement values with血e distance along血e cell
axis in detail, an attempt lS made to obtain a regression line・ First, the measurement
pouts of血e apical end and the血crosphere 2 which has neady血e same displacement
value asthat of the apical end withinthe analyticalerror (170nm)are deleted. Then, the displacement values of the remained measurement polntSare fitted by a linear regression line (Fig. 3.2(a)). It has a slope of l5.36 andthe correlation coefBcient r of O・992, and the displacement value obtained from the regression line is equal to that of the apical end (-1・36pm) at the point O・851 fromthe basalend. Figure 3.2(a)
22
shows that the displacement values are proportional to the distance along the cell
axis in the reglOn between O・O and O・85 1 from the basalendandthat the displacement valuesare constant to be -I.36pm in the reglOn between 0.851 and 1.0 fromthe basal end・ This result indicatesthat the local deformation is constant in the reg10n between O・0and O・851from the basalendand does not occur inthe reg10n between 0.851and
ILO fromthe basal end (Fig. 3.2(b)).
In the same way as shown in Fig. 3.1, the data from the 10 different cellsare analyzed・ Fig・ 3・3(a) shows the 10 regression lines obtained from the cells. Each
correlation coefBcient r is between O・982 and O・997・ The OHC lengths used in this
analysis ranged from 53・92トLm tO 80.67LLm. In order to show the data obtained from
the different cells, the displacement values of the ordinate are normalized by converting those of the basal end t0 1.0 and those of the apical end to 0.0. The
regression lines cross the displacement 0 line (dotted line in Fig. 3.3(a)) at the point
0.881士0.0447 (meanj:standard deviations) from the basal end. This result shows
that the displacement values are proportional to the distancealOng the cell axis in the reglOn between O・O and O・88 1j=0・0447 fromthe basal endand that the displacement
values are constant to be 0.0 in the reglOn between 0.881士0.0447 and 1.0 from the
basal end. The outcome indicatesthat the localdeformation isalmost constant inthe
reg10n between 0.0and 0.881士0.0447 fromthe basal end and it does not occur in the
region between O・881±0.0447 and 1.0 from the basal end (Fig. 3.3(b)).
3.1.2. Cell shape changes evoked by the electrical stimulation
A 5.0Hz sinusoidalcorrmand voltage was applied to the OHC. The measurement
points on one of the cells are shown in Fig. 3.4(a), and the time histories of the
measurement pointsare depicted in Fig. 3.4(b). As the direction of the arrow in Fig.
displacements of the measurement polntS at the maximum contraction are shown in
Fig・ 3・5(b)・ The abscissa represents the distance of each measurement point from
the basal end of血e cell, and the positions of the basal and apical ends along the cell
axis are converted to O・O and 1 ・0, respectively・ The results showthat the displacement values arealmost constant to be 3・53pm (displacement at the basal end) and -4. 1 8pm
(displacement at the apical end) in the regions near the basal and apical ends, respectively・ By contrast, in the middle reglOn Of the cell, the displacement values
vary almost linearly・ In order to correlate the displacement values with the distance
along the cell axis in detail,anattempt lS made to obtain a regression line in the same way as shown in section 3・1・1・ First, the measurement polntS Of the apical end and
the basal end and themicrospheres 2and 9 which have nearlythe same displacement
value as that of the basal or apical end within theanalyticalerror (120nm)are deleted.
Then, the displacement values of the remained measurement polntS, Which are in the
middle region of the cell, are fitted by a linearregression line (Fig. 3.6(a)). It has a
slope of -1 1 ・1and the correlation coefBcient r of O・995 and the displacement values obtained from the regression line are equal to that of the basalend (3.53LLm) at the
point O・160 and that of the apical end (-4.18LLm) at the point 0.855 from the basal
end・ Fig・ 3・6(a) shows that血e displacement values are proportional to the distance
alongthe cell axis inthe reg10n between 0.160 and 0.855 from the basal endand that the displacement values are constant to be 3・53pmand -4・ 18pm inthe reg10nS between O・O and O・160 and between O・855 and l・O from the basal end, respectively・ This
result indicates that the localdeformation in themiddle reglOn Ofthe cell is constant
and the local defbmation does not occur in the reglOnS between 0.0 and 0.160 and
between O・855 and l・O from the basalend (Fig. 3.6(b)).
24 analyzed・ Fig・ 3・7(a) shows the 10 regression lines obtained血・om the cells. Each
correlation coefficient r is between O・936 and O・995・ The OHC lengths used in this
figure ranged from 47・ 10LLm tO 59・ 10LLm・ In order to show the data obtained from the different cells, the displacement values of the ordinate are normalized by convertlng those of the basal end to l・O and those of the apical end to 0.0. The
regression lines cross the displacement l・0 line at the polnt O・142±0.0705
(mea止standard deviations) and the displacement 1.0 line at the point 0.893±0.049 1
from the basal end・ This result shows that the displacement values are proportional
to the distance along the cell axis in the reglOn between 0.142±0.0705 and
O・893±0・0491血・om the basal end, and that the displacement values are constant to
be l・O in the reglOn between O・O and O・142±0・0705 and O・O in the reglOn between
O・893j=0・049l and l・O from the basal end. The outcome indicates that the local deformation in the middle reglOn Of the cell is constant and the local deformation
does not occur in the reglOnS between 0.0 and 0.142±0.0705 and between
O・893j=0・0491 and l・O fromthe basal end (Fig. 3.7(b)).
3.2. Ultrastructure of the OHC lateral wall
3・2・1. Tip・Sample interaction
The oscillating tlP Was approached to the OHC surface which was丘xed in the
2・5% glutaraldehyde in phosphate buffer for 30min・ The tip-Sample approach curve
is shown in Fig・ 3・8・ The center of the tip oscillation and the amplitude of the
oscillating tlP Were Plotted agalnSt the cantilever position. The red line indicates the
curve when the cantilever approached to the OHC su血ce and the blue line indicates
the curve whenthe cantilever withdrew from the OHC surface・ When the oscillating
is caused from the viscous resistance of the liquid between the tip and the OHC
surface・ In the reg10n between Band C, theamplitude of the oscillating tip decreased and the center of the oscillation shifted upward・ This indicates that the tip IS contact
wi也the OHC su血ce and也e tip-sample interaction in血s reglOn is suited to scanmng・
Therefore, the set point amplitude (the set point voltage) was set in this region.
3.2.2. Circumferentialfilaments
The lateral surface of the fixed OHC was scanned usingthe AFM tapping model
Figure 3・9 shows the image which was obtained in the apical reglOn Of the OHC・ The position of the scanning area is shown in Fig. 3.9(a),and the image is shown in
Fig・ 3・9(b)・ The scanning area was 1 pm X 2 LLm. From this image, the filaments
which are arranged circumferentially were discemed・ Figure 3・ 10 showsthe image
which was obtained in themiddle reglOn Of the OHC・ The scannlng area Was 1 H′m
X 2 pm and this image was obtained with a scan angle which was different from
Fig・ 3・9・ From this image, the filaments whichare arranged circumferentially were also discemed・ These filaments could be seen in the images which were obtained in
every reg10n Of the OHC and all of them were arranged circumferentially・ In order to evaluatethe circumferentialfilaments, the intervals of the circumferentialfilaments
were measured by the section analysis. In this analysis, the 0.5 LLm X 1 pm scan
area image was sectioned along the line which is orthogonalto the direction of the
filaments andthe surface profile of the section was plotted (Fig.3. 1 1(b)). From this
surface profile, the intervals of the circumferentialfilaments were measured・ Using
thisanalysis, the intervals of the circumferentialfilaments were measured from the 38 images which were scanned in the region between 0.1 and 0.98 from the basal end・ Figure 3・12 shows the number of measurements which is plotted agalnSt the
26
interval in 10 nm classes. The intervals are ranged from 15 nm to 103 nm and the mean and the standard deviation of them were 49 mm and 1 8 mm, respectively.
9 (Basal end) (a) (b) 4.0 3.0 2.0 1.0 0.0 -1.0 -2.0 0.0 0.2 0.4 0.6 0.8 1.0
Basal end Apical end
Distance from the basal end
Fig. 3.1. The axial displacement values of the microspheres attached to the lateral
wall of the cell with hypotonic solution perfusion. (a) Measurement points on the
cell. Black polntS marked by the open circles are the measurement points. The
measurement points of microspheres 1 and 9 correspond to those of the apical and
basal ends. (b) The axial displacement values of the measurement points shown in
(a). ( u T t ) t u 9 u a U t ! l d s ! Q
28 4.0 3.0 2.0 1.0 0.0 -1.0 -2.0 Displacement
at the apical end
0.0 0.2 0.4 0.6 0.8 1.0
Basal end Apical end
Distance from the basal end
(b)
Local defbmation
際 .崇誉褒章..蔓深溝 ツメ闔「 俎ルFXル 9%4テ」vネヒ褫
0.0 0.851 1.0
Basal end Apical end Distance from the basal end
Fig. 3.2. Evaluation of the correlation between the displacement values and the
distance along the cell axis. (a) The axial displacement values of the measurement
points exceptthose of the apical reglOn Ofthe cell. The solid line is a linearregression line glVen by y = 3.20-5.35X; r = 0.992. The displacement value obtained from the
regression line is equalto that of the apical end (-1.36 pm) at a point 0.851 from the basal end. This figure shows that the displacement values are proportional to the distance alongthe cell axis in the reg10n between 0.0 and 0.85 1 from the basal end
and that the displacement values are constant in也e reglOn between 0.851 and 1.0 from the basal end.仲) The local deformation of the cell. This figure showsthat the
local defomation isalmost constant in the reglOn between 0.0 and 0.851 from the
ゎasal end and that it does not occur in the reglOn between 0.851 and 1.0血・om the ゎasal end. ( u T i ) J u 9 u a D t ! l d s ! Q
(b)
0.0 0.2 0.4 0.6
Basal end
Distance from the basal end
Local defbmation
0.8 1.0
Apical end
0.881 1.0
Apical end Distance from the basalend
Fig. 3.3. TYle localdeformatiOn evoked bythe hypotonic stimulation・ (a) Nomalized axialdisplacements of the measurement polntS except inthe apical reg10n Ofthe cell. The solid line shows the 10 linear regression lines obtained from the 10 different
cells.仲) The localdeformation of the cell. Figure. 4.3(a) showsthatthe displacement
values are proportional to the distance along血e cell axis in the reglOn between 0.0
and 0.881 ± 0.0447 (mean ± standard deviations) from the basal end and that the displacement valuesare constant inthe reg10n between O・881 ± 0・0447and l・O from
the basal end. Figure. 4.3(b) shows that the local deformation is almost constant in
the reglOn between 0.0 and 0.881 ± 0.0447 from the basal end and it does not occur in
the reglOn between 0.881 ± 0.0447 and 1.0 from the basalend・
0 0 0 ∠ U 4 2 1 0 0 0 0 J u 9 t m 3 d t d s ! G
30
50 100 150 200
Time (msec)
Fig・ 3・4・ Axial displacements of the microsphere attached to the cell lateral wall
when a 5・OHz sinusoidal co-and voltage was applied. (a) Measurement points on
the cell・ Black points marked by the open circles are measurement points. (b) Time histories of the axial displacement of the measurement points shown in (a). The top
trace shows the 5・OHz sinusoidal co-and vわltage which was applied to the OHC・
8 6 4 2 0 . 0 . 0 . 0 . P u a f e S e q a u ) ∈ 0 ] -a 3 u e l S ! Q
三≡主=l+ラ
藍(Apical end)
0.0 0.2 0.4 0.6 0.8 1.0
Basal end Apical end Distance from the basal end
Fig・ 3・5・ Axial displacements of the microsphere attached to the cell lateral wall at the maximum contraction when a 5・OHz sinusoidal command voltage was applied・
(a) Measurement points on the cell・ Black points marked by the open circles are
measurement polntS・ The measurement polntS Of the microspheres 1 and 10 correspond to those of the apical and basal ends. (b) The axial displacement of the
measurement points shown in (a) at the maximum contraction.
( u ユ ) J u a t t F 9 3 t ! T d s ! Q o ・ o 加
32
0.0 Basal end
Displacement
at the ゎasal end
Displacement
at the apical end
0.2 0.4 0.6 0.8 1.0
Distance血・om the basal end Apical end
Fig・ 3・6・ Evaluation of the comlation between the displacement values and the
distance along the cell axis・ (a) Axial displacements of the measurement points
exceptthe apicaland basalreglOnS Ofthe ceu・ The solid line shows a linearregression line glVen by y=5・30-1 1・lx; r=0・995・ The displacement values obtained from the
regression line are equal to that of ゎasal end (3.53トLm) at the point 0.160 and that of apical end (-4・ 18トLm) at the point O・855 from the basalend. This figure shows that
the displacement values are proportional to the distance along the cell axis in the
reg10n between O・ 160 and O・855 from the basalend and that the displacement values
are constant inthe region between 0.0and 0.160and between 0.855and 1.0 fromthe basal end, respectively・ (b) The local defomation of the cell. This figure shows that the local deformation isalmost constant in the reglOn between O・ 160and 0.855 from
the basal end and it does not occur in the reglOn 0 and O・160 and between 0.855 and
1.0 fromthe basalend.
( t
d )
J u
9 u
a D
t !
l d
s !
Q
0 0 0 2 0 2(a)
(b)
0.0 0.2 0.4 0.6 0.8 1.0
Basal end Distance fromthebasal end Apical end
± 0.0705 ± 0.0491 Local defomation
「「「「
描蓑濡法談輩栄幣..き、÷.搭乗ミ…=法.近く.恩.'.隙罰‡.、毒罵 - 甁 や 2 ll 0.0 0.881 1.0Basal end Apical end Distance from the basal end
Fig・ 3・7・ The local deformation evoked by the electric stimulation. (a) Normalized axial displacements of the measurement polntS except the apical and basal reglOnS of the cell・ The solid line shows 10 linear regression lines obtained from the 10 different cells・ (b) The local deformation of the cell. Fig. 7(a) shows that the
displacement valuesare proportional to the distancealong the cell axis in the reg10n between 0. 142±0.0705 (mean±standard deviations)and 0.893±0.049 1 fromthe basal endand that the displacement values are constant to be 1 ・O inthe reg10n between 0.0
and O・142±0.0705 and 0.0 in the reglOn between 0.893±0.0491 and 1.0 from the
basalend・ Fig・ 7(b) shows thatthe local deformation inthemiddle region of the cell
is constantand the local defomation does not occur inthe reglOnS between O・O and
0.142±0.0705 and between 0.893±0.0491 and 1.0 from the basal end
0 0 / L U 4 0 0 0 J u 9 u 3 3 。 l d s ! G
34 Center of the oscillation 5 nm/div Tip amplitude 0.5 mm/diy
lll C A
B l l > Zposition lOOnm/divll 白
B C uVL'YvJuJLL lt 鳴二云A空†
Fig. 3.8. Tip-sample approach curve obtained from OHC. The center of the oscillation and theamplitude of the oscillating tip was plotted against the cantilever position・ The red line indicates the curve when the cantilever approached to the
OHC surface and the blue line indicates the curve when the cantilever withdrew
from the OHC surface.Whenthe oscillating tip was approached to the OHC surface,
theamplitude of the oscillating tip decreased by slow degrees in the region between
Aand B. It is considered that this phenomenon is caused Rom the viscous resistance
of the liquid between the tip and the OHC. In the reglOn between B and C, the amplitude of the oscillating tip decreased and the center of the oscillation shifted
upward. This indicates that the tip is contact with the OHC surface and the
(a)
Fig・ 3・9・ AFM images of the lateral surface in the apical region of the OHC. (a)
The position of the scanningarea. (b) The AFM image which is scanned at the red
area in (a)・ The scanningarea is 1 pm X 2トLm. The fllaments which are arranged
36
(a)
Fig・ 3・10・ AFM images of the lateral suぬce in the middle region of the OHC. (a)
The position of the scanning area. (b) The AFM image which is scanned at the red
area in (a)・ The scanning area is lトLm X 2 pm. The filaments which are arranged
0.1 0.2 0.3 0.4 0.5 0.6 0.7 0.8
Horizontal distance (pm)
Fig・ 3・1 1・ Section analysis. (a) The AFM image of the circumferential filaments.
The scanning area is O・5 pm X 1 pm. (b) The surface profile along the blue line
which is shown in (a)・ In this measurement, the image was sectioned along the blue
line which is orthogonal to the direction of the fllaments and the surface profile was plotted. From this surface profile, the interval of the circumferential filaments was measured. 0 5 0 5 0 5 1 0 0 0 1 1 l l l ( t m ) a D u t 2 1 S ! P l e ! P a A E i J b i Z q
10 20 30 40 50 60 70 80 90 100
Interval of the circumferential filaments (nm)
Fig. 3. 12. Intervals of the circumferential filaments. The number of measurements is plotted against the intervalin 10 nm classes・ The interval is ranged from 15 nm to 103 nm and the mean and the standard deviation of them were 49 nm and 18 mm,
re spec tively.
4.1 The local stiffness of the OHC
When the cell shows the 5% contraction due to the hypotonic stimulation, the
local defbmation was almost constant in the reglOn between 0.0 and 0.88 1±0.0447
from the basal end and did not occur in the reglOn between 0.881±0.0447 and 1.0
from the basal end (Fig・ 3.3). If the force induced by the increase in the intracellular
pressure acts equally on every part of the cell, the difference in the deformation
would depend on the sti仇IeSS Of the cell・ Therefore, it is said that the long血dinal
stiffness is constant in the reg10n between 0.0 and 0.881士0.0447 fromthe basal end
and the longitudinalstiffness in the region between 0.881士0.0447 and 1.0 from the
basal end is higher than other reglOnS・ As the microscoplC Studies reported the
existence of the actin surrounding the cuticular plate in the apical part (Slepcky, et
al・, 1986; Zenner, 1986), it is speculated that the actin will cause high stiffness in the
apical part.
4.2 Distribution or the protein motors
When a 5Hz sinusoidal command voltage was applied to the OHC, there is no
local deformation in the reglOnS between 0.0 and 0.142±0.0705 and between
O・893j=0・0491 and l・O from the basal end (Fig. 3.7). Assuming that the local
deformation evoked bythe electriCalStimulation arises from a conformationalchange
of protein motorand thatthe conformationalchange of each protein motor is constant,
the localdeformation evoked by the electriCalstimulation would depend onthe density
of protein motors and也e local stifhess of the cell・ As it is discussed previously that
the longitudinal stiffness is constant in the reg10n between 0.0 and 0.881士0.0447
40 0. 142士0.0705 fromthe basal end. As the localdefomation evoked bythe electrical
stimulation does not occur in the apical reglOn, it is also expected that there are no
motors in the reglOn between 0.893±0.0491 and 1.0from the basal end. However, as
the longitudinal stiffness is high in this reg10n, there is another possibility that the
apICal reg10n has motors but the high stiffness inhibits the apical reg10n from
deformlng. A further study is necessary to understand the distribution of the protein
motors in this reglOn.
On the other hand, the local deformation was almost constant in the reglOn
between 0.142±0.0705 and 0.893±0.0491. As the longitudinal stifhess is constant
in this reglOn, the local defbmation evoked by血e electrical stimulation depends on
only the densityof the protein motors. Therefore, the protein motors would distribute
equally along the cell lateral wall in the reglOn between 0.142±0.0705 and
0.893士0.0491 from the basal end (Fig. 4. 1).
The microchamber analysis of the OHC motility demonstrated that the local
defomation was absent in the reglOnS between 0.0 and 0.2 and between 0.9 and 1.0 from the basal end (Hallworth, et a1., 1993). Comparing their data with ours, their
no motor reglOn in the basal part is larger than ours. However, both data reveal that the no motor region in the basal part is larger than that in the apicalone. As the
non-linear capacitance is considered to be accompanied by the confbmational change of
血e protein motor, the measurement of the non-linear capacitance is the other way to
know the distribution of the protein motor. Huang, et al. (1993) reported that the
basal and apical parts of the OHC were devoid of the non-linear capacitance and the
axial length of the no motor reg10nS in the basalandthe apicalpartsare corresponded
to about 7LLmand 5pm, respectively.Asthe mean OHC length shown in Figs・ 6 and
7 was 52.9叫m, the axial length of the no motor reglOnS in the basal and the apical
Huang, et al. In the microscopic studies of血e cell lateral wall,血e molecules which
are distributed along the plasma membraneare candidates of the protein motor. From
the freeze fracture images of the plasma membrane, it was reported that the molecules
are distributed along the plasma membrane except the synaptic reglOn and tight
junction area (Fわrge, 1991)・ This indicates that血ere are no motors in the apical and
basal reglOnS, and our result are consistent with the morphological research.
In this study, the standard deviation values of the no motor or high sti軌IeSS
regions obtained from the 10 different cells are relatively large (Fig. 4. 1). Therefore,
there is a question whether these reglOnS COrrelate with the cell length. Fig. 4.2
shows the relationship between the cell length and the high stiffness or no motor
reglOn. The open circles show the points where the displacement value obtained from the each regression lines is equal to 0.0 in Fig. 3.3(a) and the dotted lines indicate the high stiffness regions. The filled circles show the polntS Where the displacement value obtained from the each regression lines is equal to 0.0 or 1.0 in Fig. 3.7(a)and the solid lines indicate the no motor regions. The correlation coefficient
r of the linear regression lines, which丘t to the open and丘lled circles were less than
0.40. Therefore, it seems to be no relationship between the cell lengthand the reg10n
where the stifhess is high or the motors are not existed. However, as the cell length
shown in Fig. 3.7 is restricted from 47.10pm to 59.10叶m, the further data collection
from the shorter and longer cells is necessary, ln Order to clarify the relationship
between the cell leng血and the no motor reglOn.
4.3. tJltrastructure of the OHC lateral wall
Whenthe lateral surface ofthefixed OHC was scammed uslngthe AFM tapplng
42 intervals of them were 49 ± 18 nm with血e range of 15 - 102 nm. There have been
some reports in which the cytoskeleton network was observed in other cells by the
AFM imaging of cell's periphery (Henderson et a1., 1992; Chang et a1., 1993; You et
a1., 2000). From electron microscopic studies on the OHC lateral wall, it has been demonstratedthat the cortiCallattice lies beneaththe lateral plasma membrane along
the full length of the cell and has actins whicharearranged circumferentially (Holley and Ashmore, 1988, 1990a, 1990b; Arima et a1., 1991)・ Holley etal. (1992) reported
that the mean inteⅣal ofactins was 61.6 ± 8.0 mm, with a range of42 - 82 nm in血e
sectioned cells fixed without extraction. Besides, in the negative stained cells, the
actin丘1aments was observedandthe meanintervalof them was 56.2 ± 7.3 nm (Holley
et a1., 1992). As the direction, the distribution and the interval of these filaments are
similar to our results, the丘laments which were observed in the AFM tapplng mode
would be actins which are part of the cortical lattice.
It has been reported that the filaments in the cortical lattice formed discrete domains that oriented at variousangles to each other (Holley et a1., 1992). Filaments ran parallel to each other within a slngle domain, while individual domains were arranged at different angles to the transverse axis of the cell. Although some
circumferential filaments which were observed in the AFM tapplng mode were
branched off,the domains were not clear in this study. Also the spectrins which cross-link the actin filaments were not observed in this study. One of the reasons why they were not observed is that scannlng them is difficult as the spectrins are
thinner than the actins・ Another reason is as fわllows: Leonova and Raphael (1999)
reported that the spectrins were thin flexible meshwork underlying the actins. If
their model of the cortical lattice is correct, there is possibility that only actins are
scanned, because the actins and spectrinsare different layers. However, in order to discuss it in detail, further study is necessary.
4.4. Relationship between the local stiffness and the ultrastructure
In section 4. 1 , it was concluded thatthe longitudinalstiffness of the OHC inthe
reglOn between O・881 ± 0・0447 and l・0血・om the basal end is higher than血at in the
other reg10nS・ To discuss the relationship between the local stiffness and the
ultrastructure which was observed from the AFM imaglng, the intervals of the
circulnferentialfilaments were evaluated locally・ The intervals of the circumferentialfilaments in the reg10n between O・O and O・85 and between O・85 and l・O from the basal end are shown in Fig・ 4・3・ In this figure, to allow a direct comparison, the frequency of measurements in each class is plotted as the percentage of the total
number of measurements against the interval in 10 nm classes・ The mean intervals
of the circumferential filaments in the reglOn between 0.0 and O・85 and between
o.85 and 1.0 from the basal end were 54 nmand 44 nm, respectively (Table 4・1)・ The
difference in these means was statistically slgnificant for P<0・05 uslng Student's
t-test. onthe other hand, As shown in Fig・ 4・4 and Table 4・2,the mean intervals of the
circumferential filaments in the reg10n between O・O and O・4 and between O・4 and 0.85 from the basal end were 54 nm and 54 nm, respectively and they were not
different. These results show that the intervals of the circumferentialfilaments in
the reglOn between O・85 and Ilo from the basal end are narrower than that in the reg10n between O・O and O・85 from the basal end・
whenthe OHC was perfused with the hypotomic solutionand the circumferential
and longitudinal stress induced by the increase in the intracellular pressure acted on
the cell lateral wall, the cell lateral wall showed longitudinal shortenlng and
circumferential extension (Fig. 4.5). As the density of the circumferentialfi1aments
is high inthe reglOn Withthe narrow intervals of the circumferentialfilaments, the
44
of the cell. Therefore, it is expected that the circumferential strain which is evoked
by the circumferential stress in the apical reg10n Of the cell is smaller thanthat in the
other reglOn. If Poisson's ratio of the cell lateral wall is constant in every reglOn Of
the cell, the longitudinal strain depends on the circumferentialstrain. This indicates
that the longitudinalstrain which is evoked by the circumferentialstress inthe apical
reglOn Of the cell is smaller than that in the other reglOn・ In this case, as the mean
intervals of the circumferential丘Iaments in the reglOnS between 0.0 and 0.85 and
between 0.85 and 1.0 from the basal end were 54 nm and 44 nm in our result, the
ratio of the longitudinal strain in the apical reglOn Of the cell and that in the other
reglOn corresponded to 44/54. Therefわre, it is expected血at the longitudinal strain
in the apical region of the cell is 81 % of that in the other region (Fig・ 4・6)・ These
results indicate that the high density circumferential丘laments in the apical region of
the cell is one factor that causes the high sti仇IeSS in the apical reglOn Of the cell.
However, as the local defomation in the apical reglOn Of the cell was less than the analytical error when the OHCs showed 5 % shortenlng Of the cell length due to the hypotonic stimulation, it is expected that the difference between the stiffness in the
apical reglOn and that in the other reglOnS are large・ Therefわre it is considered that
thereare the other factorsthat cause the high stiffness in the apicalreglOn Of the cell・ One of these factors would bethe cuticularplate. The cuticular plate exists in the apical end and it is composed of a dense network of actin filaments・ Therefore, it would have a large influence on the circumferential Young's modulus inthe apical
reglOn Of the cell.
In Fig・ 4・7,the intervals of the circumferential丘Iaments in the apicalreglOn is
evaluated in detail. The gray, black, blue and red bars indicate the interval of the
circumferentialfilaments in the reglOn between 0.0 and O・80, between O・80 and O・85,
measurements in each class is plotted as the percentage of the total number of measurements agalnSt the interval in 10 nm classes. The mean intervals of the
circumferentialfilaments in the reg10n between 0.0 and 0.80, between 0.80 and 0.85,
between 0.85 and 0.90, between 0.90 and 0.95 and between 0.95 and 1.0 from the
basal end are 54 nm, 54 nm, 40 nm, 45 nm and 48 nm, respectively (Table. 4.3).
From this result,there is a possibilitythatthe intervals of the circumferential丘1aments
in the reg10n between 0.85 and 0.90 is narrowest. This indicates that the stiffness of
46
Local defomation
from the mechanical
s timul ati on
Longitudinalstiffness
constant ;国
0.0 Basal end
Distance from the basal end
± 0.0705 Local defbmation
from the electrical stimulation Protein motor 0.881 1.0 Apical end ± 0.0491
「.「「「
一一一一p..≡ .-X杖 :文一.◆f 粨 B 凵 音程空相 イ簫 靜或X 8菇}ケe 陞「 葦萱済甑.義Distance from the basal end
0.881 1.0
Apical end
Fig・ 4・1・ Local stiffness and distribution of protein motor・ Assumlng that the force
induced by the hypotonic stimulation acts equally on every part of the cell, the
difference in the deformation depends on the stiffness of the cell. Therefore, it seems that the stiffness is constant in the reglOn between 0.0 and 0.881±0.0447 (mean±standard deviations) from the basalendand the stiffness in the region between O・881±0・0447血・om the basal end is higher than other reglOnS・ Moreover, under the
assumptlOn that the confomational change of each protein motor is constant, the
local defわrmation which is evoked by electrical stimulation would depend on the
densityof protein motors and the localStiffness・ Therefore, it is said that the protein
motors distribute equally along the cell lateral wall in the reglOn between
0.142±0.0705 and 0.893±0.0491 from the basal end and there are no motors in the reglOnS between 0.0 and 0.142±0.0705 and between 0.893±0.0491 and 1.0 from the
45 50 55 60 65 70 75 80 85
Cell length (LLm)
Fig・ 4・2・ Relationship between the cell length and the high stiffness or no motor
reglOn・ The open circles show the polntS Where the displacement value obtained from the each regression lines is equal to O・O in Fig・ 3・3(a) and the dotted lines
indicate the high sti触ess reglOnS・ The丘lled circles show the points where the displacement value obtained血・om血e each regression lines is equal to O・O or l・O in Fig. 3.7(a) and the solid lines indicate血e no motor regions・
q a q ) u O J J a U u t ぶ S ! G ′ L U 4 0 0 2 0 0 0
48
10 20 30 40 50 60 70 80 90 100
Interval of the circumferential fllaments (nm)
Fig・ 4・3・ Intervals of the circumferential filaments in the apical reg10nand that in
the other reg10n. The blueand red bars indicate the interval of the circumferential
filaments in the region between 0.0 and 0.85 and between 0.85 and 1.0 from the basal end, respectively・ In order to allow direct comparison, the frequency of measurements in each class is plotted as the percentage of the total number of
measurements against the i山eⅣal in 10 nm classes.
0 5 0 2 1 1 0 0 0 ( ㌔ ) i ( D u a n b a J d : ・ I
Table. 4. 1. Interval of the circumferential filaments.
Standard
Region Mean deviation Minimum Maximum Numbers of
(from the basal end) (nm) (nm) (nm) (nm) measurements
Between 0.0 and 0.85 54 18 18 103 282
Between 0.85 and 1.0 44 17 15 97 204
Mean intervals of the circumferential filaments. The difference in these means was
50
10 20 30 40 50 60 70 80 90 100
Interval of the circumferential filaments (nm)
Fig. 4.4. Intervals of the circumferential filaments in the middleand basal reg10nS・ The blue and red bars indicate the interval of the circumferential filaments in the reg10n between 0.0 and 0.40 and between 0.40 and 0.85 from the basal end,
respectively. In order to allow direct comparison,也e丘equency of measurements in
each class IS Plotted as the percentage of the total number of measurements against
the interval in 10 nm classes.
0 5 0 2 1 1 0 0 0 ( ㌔ ) b u a n b a J d
■
■
Table・ 4・2・ Interval of the circumferential filaments in themiddle and basalreg10nS・
Standard
Region Mean deviation Minimum Maximum Numbers of
(from the basal end) (nm) (nm) (nm) (nm) measurements
Between 0.0 and 0.4 54 18 18 103 126
Between 0.4 and 0.85 54 17 21 101 156
The mean intervals of the circumferentialfilaments in the reglOn between 0.0 and 0.4 and between 0.4 and 0.85 fromthe basal end were not different.
52
:;..B 蔓壷 剔リ
辞≡ ぎL 塞 +++ 責 鼓
描
塗 从2
Fig. 4.5. Strain of the cell lateral wall in response to the hypotonic stimulation.
When the OHC perfused with the hypotonic solution and the circumferential and
longitudinal stresses induced by the increase in the intracellular pressure acted on
the cell lateral wall, the cell lateral wall showed longitudinal shortening and circumferential extension.
讃 メ 千 漢 諜張 :;B 末n1: tt完 丘laments is na汀OW direction
LEdi:
遜過 剪 ・式 Before defbmation上
一′ I 一′ ヽ一 , ヽL ー 調 ノ■ …≡≡左≡琵≡丁=J.:≧≡:≡÷と淋一挺熊芯..指芯手沢ミ, Circumferentialdirection gal:ea2=44:54=0・81 : 1Fig・ 4・6・ Relationship between the circumferentialfilaments and the longitudinal strain. As the denslty Of the circumferentialfilaments is high in the reg10n Withthe
narrow intervals of the circumferentialfi1aments, the circumferential Young's modulus
of the cell lateralWall is high in this apical reg10n Ofthe cell・ Therefore, it is expected that the circumferential strain which is evoked by the circumferentialstress in the
apical reglOn Of the cell is smaller than that in the other reglOn・ If Poisson's ratio of
the cell lateral wall is constant inthe every region Ofthe cell, the longitudinal strain depends on the circumferential strain・ This indicates that the longitudinal strain
which is evoked by the circumferential stress inthe apicalreg10n Ofthe cell is smaller thanthat in the other reg10n・ In this case, asthe meanintervals of the circumferential
filaments in the reg10nS between O・O and Ol85 and between O・85 and l・O from the
ゎasal end were 54 nm and 44 nm in our result, the ratio of the longitudinal strain in
the apical reglOn Of the cell and that in the other reglOn CO汀eSpOnded to 44/54・
Therefore, it is expected thatthe longitudinal strain in the apical reg10n Of the cell is
54
10 20 30 40 50 60 70 80 90 100
Interval of the circumferential filaments (nm)
Fig. 4.7. Intervals of the circumferential filaments in the apical reg10n. The gray, black, blueand red bars indicate the interval of the circumferentialfilaments in the
region between 0.0and 0.80, between 0.80and 0.85, between 0.85and 0.90, between 0.90and 0.95and between 0.95and 1.0from the basal end, respectively. In order to
allow direct comparison, the frequency of measurements in each class IS Plotted as
the percentage of the total number of measurements against the i山eⅣal in 10 nm classes. 3 2 0 0 (㌔)buanbaJh 0 9 5 9 0 8 5 8 0 ● ● ● 1 0 0 0 0 「」.」トー
Table. 4.3. Intervalof the circumferential丘laments in the apical reg10n.
Standard
Region Mean deviation Minimum Maximum Numbers of
(from the basal end) (nm) (nm) (nm) (nm) measurements
Between 0.0 and 0.80 54 18 18 BetweenO.80andO.85 54 13 35 BetweenO.85 andO.90 40 16 15 BetweenO.90andO.95 45 19 18 Between 0.95 and 1.0 48 16 20 103 252 83 30 97 81 94 78 80 45
There is a possibility that the intervals of the circumferentialfilaments in the reglOn
56
4. Conclusions
The local deformation of the OHC in response tothe hypotonic and electrical stimulations was analyzed by measurlng the displacement of the microspheres
attached randomly to血e cell lateral wall・ men,血e ultrastmcture of血e OHC lateral
wall was investigated by an ato血c fbrce血croscopy・ When the position along the
cell axis is represented bythe normalized distance from the basalend and the positions
of the basal and apical endsare expressed by O・O and l・0, the followlng conclusions
can be drawn.
1. The long血dinal sti軌ess of the cell is constant in the reglOn between O・O and
o.881±0.0447 (mean±standard deviations) from the basal end, and the
longitudinal stiffness of the cell in the reglOn between O・881±0・0447 and l・O
from the basal end is higher thanthat in other reglOnS・
2. Thereare no motors in the reglOnS between O・O and O・142±0・0705and between
o.893±0.0491 and 1.0fromthe basalend,and the motors are distributed equally
along the cell lateral wall in the reglOn between O・ 142±0・0705 and O・893±0・0491
from the basal end.
3. The circumferentialfilaments were observed inthe AFM tapplng mode, and it
would be actins which are part of the cortical lattice・
4. The mean intervals of the circumferential filaments in the reg10n between O・O and 0.85 and between 0.85 and 1.0 from the basal endare 54 nm and 44 nm,
re sp ectively・
5. The difference between the intervals of the circumferentialfi1aments in the reg10n
between 0.0 and 0.85 and between 0.85 and 1.0血・om血e basal end is one of the
Arima, T., Kuraoka, A., Toriya, R., Shibata, Y., Uemura, T., 1991. Quick-freeze,
deep-etch visualization of血e `cytoskeletal spnng'of cochlear outer hair cells・ Cell
¶ssue Res. 263, 91-97.
Ashmore, J. F., 1987. A fast motile response in gulnea-Plg Outer hair cells: the
cellular basis of the cochlear ampli丘er. ∫. Physiol. 388, 323-347.
Brownell, W. E., Bader, D., Ribauplerre, Y., 1985. Evoked mechanical responses of
isolated cochlear outer hair cells. Science 227, 194-196.Chang, L.,Kious, T., Yorgancioglu, M., Keller, D・, Pfeiffer, J・, 1993・ Cytoskeleton
of living, unstained cells imaged by scannlng force microscopy. Biophys. ∫. 64,
1282-1286.
Dallos, P., Evans, B. N., 1995. High-frequency motility of outer hair cells and the cochlear ampli丘er. Science 267, 2006-2009
EvanS, B.N., 1 990. Fatalcontractions: ultrastructuraland electromechamiCalchanges
in outer hair cells fbllowlng tranSmembraneous electrical stimulation・ Hear・ Res・
45, 265-282.
Forge, A., 199 1. Structural features of the lateralwalls in mammalian cochlear outer hair cells. Cell 'nssue Res. 265, 473-483.
58
Gale, J.E., 1997. An intrinsic frequency limit to the cochlearamplifier. Nature 389,
63-66.
Hallworth, R., Evans, B. N., Dallos, P., 1993. The location and mechanism of
electromotility ln gulnea plg Outer hair cell. ∫. Neurophysiol. 70, 549-558.
Hallworth, 氏., 1995. Passive compliance and active fわrce generation in the gulnea
plg Outer hair cell・ J・ Neurophysiol・ 74, 2319-2329・
Henderson, E., Haydon, P. G., Sakaguchi, D. S., 1992. Actin filament dynamics in
living gliai cells imaged by atomic fわrce microscopy・ Science 257, 1944-1946・
Holley, M・ C・, Ashmore, J・ 冗, 1988a・ A cytoskeletal spnng ln COChlear outer hair
cells. Nature 335, 635-637.
Holley, M. C., Ashmore, J. F., 1988b. On the mechanism of a high-frequency force
generator in outer hair cells isolated from the gulnea Pig COChlea・ Proc・ R・ Soc・ Lond. B 232, 413-429.
Holley, M・ C・, Ashmore, J・ F・, 1990a・ Spectrin, actin and the structure of the cortical
lattice in mamalian cochlear outer hair cells. ∫. Cell. Science 96, 283-291.
Holley, M. C.,Ashmore, J. F., 1990b. A cytoskeletal spnng for the control of cell
shape in outer hair cells isolated from the gulnea plg COChlea・ 巴ur Arch