A deuterium/hydrogen Lyman alpha absorption
cell photometer developed for the Nozomi
spacecraft
著者
Ito Yuichi, Fukunishi Hiroshi
雑誌名
The science reports of the Tohoku University.
Fifth series, Tohoku geophysical journal
巻
37
号
2
ページ
109-124
発行年
2006-09
TOhoku Geophys. Journ. (Sci. Rep. TO'hoku Univ., Ser. 5), Vol. 37, No. 2, pp. 109-123, 2006
A Deuterium/ Hydrogen Lyman Alpha Absorption Cell
Photometer Developed for the Nozomi Spacecraft
YUICHI ITO' and HIROSHI FUKUNISHI2
(Received August 24, 2006 ; Accepted August 29, 2006)
Abstract : A deuterium/hydrogen Lyman a absorption cell photometer has been oped for the Nozomi spacecraft which is the Japanese first planetary spacecraft to Mars.
This photometer aims to observe the Martian hydrogen and deuterium corona and their D/
H ratio. Unfortunately, the Nozomi spacecraft project ended in failure by engine and telemeter trouble during the insertion phase to Mars in December 2003. In this paper, we
summarize the performance of the developed D/H absorption cell photometer and the results of simulation studies on D/H ratio retrieval from Martian corona measurement.
1 Introduction
There is no evidence on the existence of massive liquid water in the present climate
system of Mars. However, from the geological features of massive water flows on the
Martian surface, it is suggested that Mars had enough water to form a global layer 500
m thick or greater in the past (Carr, 1979, 1986, 1987, 1990). One of the water loss
mechanism is generally thought to be atmospheric escape to space via the Martian
exosphere (Chamberlain, 1969 ; Fox, 1993 ; Hunten, 1982, 1990 ; Liu et al., 1976 ;
Vis-conti, 1977 ; Zahnle, 1986). Deuterium atoms which have chemically the same
character-istics as hydrogen atoms but twice mass condensate through these processes.
There-fore, the atmospheric D/H ratio increases in the evolutionary history of the Martian
atmosphere. The detection of the D/H ratio has been challenged despite of its difficulty.
The first attempt of D/H ratio measurement was performed by Owen et al. (1988).
They had measured the emission ratio of the water molecular band in the Martian lower
atmosphere using the 3.6-m infrared telescope with a Fourier transform spectrometer at
Mauna Kea, Hawaii. They reported a D/H ratio of 9+4 x 10' from the emission
intensities of HDO and H2O. Bjoraker (1989) also performed similar spectroscopic
observations at Kuiper Airborne observatory and obtained a D/H ratio of 7.8+0.3 x
Later, the Phobos spacecraft performed a solar occultation observation of HDO and H2O
absorption using the Augustine infrared spectrometer (Korablev et al., 1993). However,
only the upper limit of the D/H ratio was obtained as 5.0 x 10⁻⁴ within a statistical
uncertainty of the detection. Analysis of the SNC (Shergottites, Nakhlites and Chassin-
' Max-Planck-Institut ftir Sonnensystemforschung, Max-Planck-Stral3e 2, 37191,
Lindau, Germany.
2 Department of Geophysics, Graduate School of Science, Tohoku University, Aramaki-Aoba,
110 YUICHI ITO and HIROSHI FUKUNISHI
gnites) meteorites which are thought to have come from the surface of Mars also
provided information of the Martian D/H ratio as 8.1+0.3 x 10' on the Martian surface
(Watson, 1993). Krasnopolsky et al. (1998) detected deuterium Lyman a line using the
Hubble space telescope. They reported that the deuterium Lyman LY intensity is a 23+
6 Rayleighs at the limb of Mars. Corresponding HD/H2 ratio of the upper atmosphere
is a factor of 11 times smaller than that of the ratio of HDO and H2O of the lower atmosphere.
The discrepancy in the vertical direction urged the construction of photochemical
models, thereby enhanced the knowledge of the hydrated and deuterized compounds.
Yung et al. (1988) first constructed a photochemical model including deuterized
com-pounds which had become a standard model later. They defined the partitioning index
(R =(HD/H2)/(HDO/H20)) to generalize the formation rate of the deuterized compounds
in the air. They estimated a value of R =1.6 under an assumption that H2 and HD can
not be controlled only by the isotopic exchange HD+ H20 .(=> HDO+H, on the thermal
equilibrium condition. However, Krasnopolsky's observations (Krasnopolsky, 1998)
denied the model result (R = 0 .09) . Extensive efforts were paid to the depletion
mecha-nism of the deuterium in the vertical direction because such investigations give the upper
limit of escape. It was pointed out that there is either an unknown loss mechanism to
reduce the partitioning index or a catalyst to increase the efficiency of the isotopic
reaction (Yung et al., 1998). Several plausible mechanisms have been proposed so far.
Fouchet et al. (2000) applied the isotopic condensation effect at the hygropause.
Cheng et al. (1999) constructed a photo-induced fractionation effect (PHIFE) theory.
They applied to the vertical depletion of the deuterium on the Martian corona and
explained a factor of 2.5. Bertaux et al. (2001) discussed a combination of the
photo-induced fractional effect (PHEFE) and the condensation/evaporation fractional effect
(CEFE) which can produce a cold trap for deuterium in the atmosphere of Mars. The
recent model (Bertaux et al., 2001) gives a reasonable explanation by a factor of 9.5
difference of the D/H ratio with an estimation of smaller quantity of the water.
Novel findings and scientific achievements on the D/H ratio in the past two decades
are summarized as follows. (1) Low D/H ratio in the upper atmosphere (Krasnopolsky
et al., 1998) ; comparatively high condensation of HDO/H20 ratio in the lower
atmo-sphere (Owen et al., 1998 ; Bjoraker., 1989) ; high D/H ratio in the SNC meteorite
(Watson et al., 1993) on the Martian surface. (2) Successful development of a
photo-chemical model to explain the discrepancy of the discrete D/H ratio value at altitudes
of 3-levels (Bertaux et al., 2001) with an affirmative implication of under ground water
(Krasnopolsky et al., 1998 ; Krasnopolsky, 2000).
The Nozomi spacecraft is the Japanese first planetary mission to Mars. The main
target of Nozomi is to investigate the interaction processes between the Martian upper
atmosphere and the solar wind with 14 scientific instruments (Tsuruda et al., 1996). One
of these instruments is an ultraviolet imaging spectrometer which consists of a D/H
absorption cell photometer (UVS-P) as shown in Fig. 1 and a grating spectrometer
A D/H LYMAN ALPHA PHOTOMETER FOR THE NOZOMI SPACECRAFT 111 4 t, . 4 i • - . '
(.44400,
., 4 , A. A i i s# I II'ih
A i ,,lar,- ,--ti ....
Fig. 1. View of the hydrogen and deuterium absorption cell photometer (UVS-P).
The UVS-P consists of a solar blind type photomultiplier and hydrogen and
deuterium absorption cells. The weight of UVS-P is 0.6 kg.
magnetic field, it is generally believed that the solar wind interacts directly with the
Martian upper atmosphere so that the upper atmosphere environment is strongly
controlled by solar activity. The UVS-P is applied to imaging observations of the
Martian deuterium corona as well as the hydrogen corona. Collaborated observations
have been proposed among Nozomi and several missions of NASA and ESA. However,
the Nozomi spacecraft was abandoned by engine and telemeter trouble during the
insertion phase to Mars in December 2003, and this project ended in failure. However,
similar projects of D/H ratio measurement using the absorption cells (Esposito et al.,
1998) at the Cassini mission as well as the PFS (Planetary Fourier transform
Spectrometer) of the Mars Express mission (Formisano et al., 2002) encourage us to
report our work. In this paper, we summarize the performance of the developed D/H
absorption cell photometer and the results of simulation studies on D/H ratio retrieval
from Martian corona measurement.
2 Development of the D/H absorption cell photometer
The UVS-P is a solar blind type Lyman a photometer with deuterium and
hydro-gen absorption cells, which enables us to obtain information on (1) the kinetic
tempera-ture of hydrogen Lyman a emission and (2) the D/H ratio of Lyman a emissions.
2.1 Principle of the absorption cell photometer
The principle of detecting the kinetic temperature of hydrogen is to utilize the
transmission property of the absorption cell, which can be mathematically expressed as
the convolution of the incident emission and the absorption cell profile. Hydrogen
molecules never absorb the Lyman a emission at static condition. However, by
activat-ing the filaments inside the cells, thermally dissociated hydrogen (or deuterium) atoms
112
YUICHI ITO and HIROSHI
FUKUNISHI
incident Lyman a emission. Since resonantly scattered photons are re-directed
omni-directionally, the photons except for those in the direction of the optical axis cannot
reach the detector. Consequently, the absorption cell works as a narrow-width negative
optical filter which exclusively absorbs the Lyman a emission. By controlling the
electric current of the filaments inside the cell, the absorption cell profiles is controlled.
The transmittance of the cell, T(A), is given as a function of wavelength A as
T(A)=exp(— r(i))
(1)
where r is the optical thickness of hydrogen atoms given by
z-- nr
/- a(A)-
L
(2)
and nH is the hydrogen atom density produced by dissociation of hydrogen molecules
inside the cell, L is the optical path along the cell, and 6(2) is the absorption cross section
of the hydrogen Lyman a line. The absorption cross section c(A) is expressed as a
Gaussian function as
c(A)=
au-
exp[(
ZIA.1
)21
(3)where JA— A— Ao is the difference of wave length from the line center, and
Ac_ A
.( 2kTatom)(4)
C\ mHi
Furthermore, ao (cm2) is the absorption cross section at the line center, expressed as
1
4/Tre2
(1°=
• MI/ 2mg:2°•(
2kTato.
)•ii(5)
In equation (5), index f is the oscillator strength, which represents the degree of
scatter-ing, 0.4164 for hydrogen and 0.4165 for deuterium. Furthermore, me (g) is the mass of
electron, e (C) is the charge of electron, c is the light velocity, k is the Boltzman constant, mH (g) is the mass of hydrogen atom, and Tatom (K) is the atomic hydrogen gas
tempera-ture. The source line spectrum of hydrogen Lyman a emission is expressed as a
Gaussian form, which is given by
S(A)=
So•
exp[ ( 2Al:
)]
(6)
where
As_
A
.( 2kT,V
(7)
C1MxI
In equation (7), T, is the kinetic temperature of an incident Lyman a emission source.
The incident Lyman a emission transmitted through the absorption cell changes its
spectrum form, and has a normalized profile as
A D/H LYMAN ALPHA PHOTOMETER
FOR THE NOZOMI
SPACECRAFT
113
where .5
n(A) is the normalized spectrum of the incident light. The wavelength
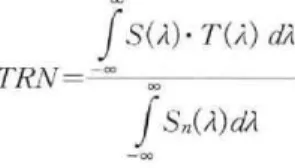
integrat-ed transmission ratio, TRN, is given as
0.
fS(A)
•
T
(A)
dA
TRN =— (9)
f Sn(A)clA
From (9), the transmission ratio can be determined by 4 parameters : (1) temperature of
the incident Lyman a emission source, (2) Doppler shift of the incident Lyman a line
center from the line center of the cell absorption profile due to the relative motion of
spacecraft, (3) optical depth of the absorption cell, and (4) temperature of hydrogen
atoms inside the cell. In case that the absorption cell is accurately calibrated, it is
possible to estimate the kinetic temperature of the incident Lyman a emission.
2.2 Principle of the D/H ratio measurement using the absorption cell photometer
By combining the hydrogen and deuterium absorption cells, the emission rate of
deuterium to hydrogen Lyman a can be also detected, where these utilize the
absolute-ness of the Lyman a emission lines and the transmittance of the absorption cells. The
absorption cell photometer is modeled as shown in Fig. 2. Then the model can be
formulated as follows.
TH1' CH+ TD1' CD+BG=S1 (10)
TH2 • CH--l--TD2' CD+ BG- S2(11)
where TH1, TH2 (TD1, TD2) denote the transmission of the hydrogen (deuterium) at each
operation mode : 1 and 2. CH and CD denote the hydrogen and deuterium Lyman a
intensities, respectively. B, denotes background light including dark noise. Here, Bc
term is omitted under an assumption of no background light, thereby the equations can
H cell ON D cell OFF Photomultiplier
111 I WEN tube
D Ly a
H
Ly
a ^11.11
H cell OFF D cell ON Photomultiplier
tube
D Lya H Lya
Fig. 2. Schematic diagram of the D/H absorption cell photometer. The hydrogen
and deuterium Lyman a emissions are separately detected by changing the
transmission of the deuterium or hydrogen absorption cell.
114 YUICHI ITO and HIROSHI FUKUNISHI
be solved by matrix inversion as
.
1
TD2.
SI TD1•
S2'
(12)
,CD,(TH1 • TD2—
TD1•TH2)TH2 • S1 + TH1
• S2,
1
TD2
•
e •
Ul•
tl TD1
•
e •
7/2
•
t2)
± TD2•($
•
Ul
• tl) + TD1•(e
•
U2•
t2)
(13)
detTH2•$•
Ul• tl-h TH1•
$ • U2• t2)± T112•($
• Ul• t1) + T111•($
• U2• t2)
where the signal SI (S2)= E • ui(u2)• tt)u
1s2,,1— TH
I
• ItH TD1'
UD and u2= TH2•
U11
TD2•
UD, det —
TH1'
TD2—
Tpl• TH2, uH is the intensity of hydrogen, 14D
is the intensity of
deuterium, e is the photometrical sensitivity, and tt (t2) is the measurement time of mode
1(2). The signal-to-noise ratio (hereafter it is referred as SNR) can be given from the
ratio of the expected signal and signal fluctuations as
TH2. e • Ul•1-1+
TH1
• e •112
• 12 SNR(D)
=
(14)
TH2• $ • Ul• tl + TH1
•
e •
Zi2
• t2
S/r--•
( TH1
• TD2 TH2.
TD1)•
UD1
(15)
v/
TH2
• TH1
•
UH TH2•
TM' UD+ TH1
• TH2•
UH+ TH
I •
TD2'
UD
Under an ideal condition that TH1=1.0, TD1=1.0 in equation (15) and assuming that t1=
t2= t, the SNR of the deuterium signal can be reduced as
A/T-1(
TD— TO.l'ID1
SNR(D) =
(16)
2 T112.
UH+ TH2•
TD1•
Up+ TD2•
1(TD—
TN). UD1
Ale
•
t
(17)
i/2 TH
•
UH
(... the intensity of hydrogen uH> the intensity of deuterium up)
From equation (17), it is found that the SNR of deuterium measurement is proportional
to the square root of the measurement time, and the ratio is related to the transmission
of the hydrogen absorption cell.
3 Application to imaging observations of the Martian hydrogen and deuterium
corona
As an initial step to retrieve the Martian D/H ratio, images of the Martian corona
are simulated. The Lyman a intensity of the Martian hydrogen and deuterium corona
is calculated. The model considers a resonance scattering process in the Martian
coronas by Monte Carlo simulation. Note that this model was originally developed for
an analysis of geocorona (Ito, 2001). In the model, the atomic hydrogen density distribu-tion is assumed as the same profile obtained by the Mariner Series (Anderson et al., 1971, 1974). The atomic deuterium density is assumed by multiplying a factor 9 x 10' to the
hydrogen model, which gives a good approximation to the nadir or bright limb. The
temperature of the corona is assumed to be 350 K for both hydrogen and deuterium
A D/H LYMAN
ALPHA
PHOTOMETER
FOR TIIE NOZOMI
SPACECRAFT 115
assumed to be located at (0, -2Rm, 0) in Mars Sun-equatorial coordinates.
False-color
maps of Lyman a emissions of hydrogen and deuterium are shown in Figs. 3(a) and (b).
The maximum intensities of the hydrogen and deuterium corona are simulated as
—5,000 [IZ] and —25 [RI, respectively.
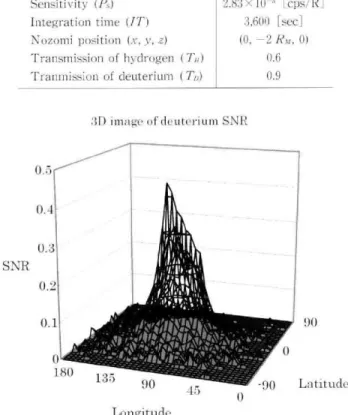
By substituting all parameters listed in Table 1 into equation (17), 31) distribution of
the SAW of the deuterium corona can be obtained as shown in Fig. 4. It is found that
the SAW_
of deuterium corona observation for one hour is —0.4 at maximum. We have
also calculated the averaged intensity of the hydrogen and deuterium Lyman a emissions
Raleigh
01111E1A1
(a)
2500 5000
Simulated Martian Lyman ^lnkr, prnia.lein
, - O
300 200 100
Local longitude [ded
Rail gh
NM:
(b)
0
20
4D
RimuirthAd ,frrinrt alpha effassian
zr . . • +-^ • -51 JUU 200 1C0 0
Local longitude [clad
Fig. 3. False-color plots of the Martian hydrogen and deuterium corona. The
hydrogen corona with a brightest limb intensity of —5,000 and (b) the
116 YUICHI ITO and HIROSHI FUKUNISHI Table 1. List of parameters used for this simulation.
Items Values
Sensitivity (17) 2.83 x [cps; R]
Integration time (IT) 3.600 [sec1
Nozomi position (.1-, e. z) (0. —2 Hu. 0)
Transmission of hydrogen ( 0.6 Tranmissiun of deuterium (TD) 31) image of deuterium SNP. 0.4 0.3 I11) ‘ SNR 1,b1+ 0.1 UNA, 90 fi* • 0 0- 180 13') . -• )0 o-90 0 Latitude Longitude
Fig. 4. Three-dimensional display of the SNR per 1 hour in the case of deuterium
corona measurement with Tx — 0.6 and Tn —0.9.
Sun di LT 120 LT 0:00 \ MOP L LT 9:00LT 3:00 LT 6:00
A D/H LYMAN ALPHA
PHOTOMETER
FOR THE NOZOMI
SPACECRAFT
117
at 25 positions around Mars as shown in Fig. 5. The distance of the Nozomi spacecraft
from the center of the Mars is given as 1.044
R.1 (150 km altitude), 2 RM, 5 RM, 10 R, and
15 RN,, while the local time of the spacecraft is given as 0, 3, 6, 9 and 12 hours,
respective-ly. The averaged scattering intensities of the H and D Lyman a emissions are obtained
by averaging the whole Lyman a emissions inside the disk direction.
The result is
summarized in Table 2. The averaged hydrogen and deuterium Lyman a emissions
obtained from our Monte Carlo simulations are ---5,600 [R] and -28 [R] at the
dayside periapsis (1.044
RM), respectively, while they are -205 [R] and -1 [R] at the
nightside apoapsis (15 Rm).
4 Application to the remote sensing of the D/H ratio in the Martian Corona
In order to accurately estimate the SNR of the D/H ratio from the actual
observa-tion of the Martian corona, we must consider actual background intensity and dark
noise. However, under the present simple condition that the corona is pure hydrogen
and deuterium gases, the SNR of D/H ratio can be expressed as
SNR(DIH)-SNR(D)
(19)
Consequently, the SNR of the D/H ratio can be estimated by the SNR of the deuterium
signal.
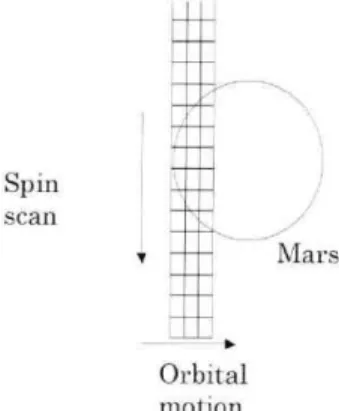
Imaging observations of the Martian hydrogen and deuterium corona are performed
by the spin scan and orbital motion of the Nozomi spacecraft as shown in Fig. 6. The
SNR of the D/H ratio can be estimated from equation (17) using the averaged intensity
of hydrogen and deuterium corona listed in Table 2 as well as the orbital information of
the spacecraft.
The result is summarized in Table 3. Note that the periapsis is 1.044
Table 2. Averaged intensities (Rayleigh)
of hydrogen and
deuterium Lyman a scattering emissions viewed from
25 positions around Mars.
Distance 1.044
R,I1
, 2 R11
5
RM
10
Rm
15
RAI
AD'
146.5'
60.0'
19.2'
10.4'
7.2'
12
: 00
5,810
2,856
1,405
1,188
1,114
9
: 00
4,830
2,522
1,282
1,080
1,011
H
6:00
3,469
1,744
847
697
660
3 : 00
2,142
970
398
329
307
0 : 00
1,110
582
263
218
205
12
: 00
28.0
13.8
6.8
5.7
5.4
9 : 00
23.3
12.2
6.2
4.9
4.9
D
6 : 00
16.7
8.4
4.1
3.4
3.2
3:00
10.3
4.7
1.9
1.6
1.5
0 : 00
5.4
2.8
1.3
1.1
LO
' AD denotes Angle Diameter of the Martian disk from an
assumed altitude of the Nozomi spacecraft.
118
YUICHI ITO and HIROSHI EUKUNISHI
^
I I
Spin
scan
Mars
I I
II
Orbital
motion
Fig. 6. Schematic diagram of the spin scan orbital motion method.
Table 3. Estimated
SATR
of the deuterium
Lyman a
surement at different locations of the Nozomi
craft.
Altitude ().044
(150
km)
Rif
1 R
A,
2 RA,5R,15
R,
LT
12
: 00
L969
3.115
2.806
2.215
1.621
9 :00
1.384
2.257
1.991
1.502
1.161
6 : 00
0.972
1.609
1.394
0.948
0.802
3:0{)
0.886
1.385
1.274
0.878
0.745
0 :
00
0.867
1.432
1.233
0.852
0.698
Re distance (150 km altitude), and the apoapsis is 15 R, distance, while the orbital period
is 38 hours. The observation time f„,, is estimated by the time for scanning the Martian
disk as
Tob,=
3397/velocity (Tr/4
sin(S2/2))
(20)
For example, in case that the Nozomi spacecraft is located at an altitude of 1
the
SATR of the D/H ratio can be estimated as —3.1. From this estimation, it is concluded
that the D/H absorption cell photometer has sufficient instrumental performance .
5 Summary
In this paper, we summarize the performance of the developed D/H absorption cell
photometer on board the Nozomi spacecraft and the results of simulation studies on D/
H ratio retrieval from Martian corona measurement.
The developed cell has sufficient
instrumental performance and thereby contributes to the measurement of the D/H ratio
in the Martian corona. The major results obtained in this study are summarized as
follows.
A D/H LYMAN ALPHA PHOTOMETER FOR THE NOZOMI SPACECRAFT 119
measuring the absorption cell profiles, we have obtained quantitative parameters
such as optical depth and kinetic temperature to characterize the absorption cell
profile.
2. A hydrogen/deuterium Lyman a scattering property has been calculated using
Monte Carlo simulation and a radiative transfer equation. The maximum
sities of the hydrogen and deuterium Lyman a emissions have been estimated as
—5,000 [R] and —25 [R], respectively.
3. Imaging observations of hydrogen/deuterium corona and the retrieval of the
Martian D/H ratio from the observation data have been investigated. In case that
the transmission ratios of the hydrogen and deuterium Lyman a emissions are 0.5
and 0.9, respectively, the SNR of globally averaged D/H ratio is estimated to be
—2.0 at 150 km altitude. The estimated SNR demonstrates that the D/H
tion cell photometer has good enough performance to retrieve the Martian D/H
ratio.
Acknowledgments
The authors thank to the NOZOMI/UVS team members for providing us various
testing data.
References
Anderson D.E. Jr., 1974 : Mariner 6, 7, and 9 ultraviolet spectrometer experiment : Analysis of
hydrogen Lyman a data, J. Geophys. Res., 79, 1513-1518.
Anderson D.E. Jr. and C.W. Hord., 1972 : Correction to "Mariner 6 and 7 ultraviolet spectrometer
experiment : analysis of hydrogen Lyman a data, J. Geophys. Res., 76, 6666, 1971",
Geophys. Res., 77, 5638.
Bertaux, J.L. and F. Montmessin, 2001 : Isotopic fractionation through water vapor condensation :
The deuteropause, a cold trap for deuterium in the atmosphere of Mars, J. Geophys. Res.,
106, 32879-32884.
Bjoraker, G.L., M.J. Mumma, and H.P. Larson, 1989 : Isotopic abundance ratios for hydrogen and oxygen in the Martian atmosphere. Bull. Am. Astron. Soc. 21. 99L
Carr, M.11., 1979 : Formation of Martian flood features by release of water from confined aquifers,
Geophys. Res, 84, 2995 3007.
Carr, M.1I., 1986 : Mars : A water-rich planet?. Icarus, 68, 187-216.
Carr, M.H., 1987 : Water on Mars, Nature, 326, 30-35.
Carr, 1990 : D/H on Mars : Effects of floods, volcanism, impacts, and polar processes, Icarus,
87, 210-227.
Chamberlain, J.W., 1069 : Escape rate of hydrogen from a carbon dioxiode atmosphere, Asrtrophys. J, 155, 711-714.
Cheng, B., E.P. Chew, C. Liu, M. Bahou, Y. Lee, Y.L. Yung, and M.F. Gerstell, 1999 : Photo-induced
fractionation of water isotopomers in the Martian atmosphere, Geophys. Res. Lett, 26, 3637 3660.
Esposito, LW., J.E. Colwell, and WE. McClintock, 1998 : Cassini UVIS observations of Saturn's rings, Planet. Space Sci., 46, 1221-1235.
Formisano, V., D. Grassi, N. Ignatiev, L. Zasova, and A. Maturilli. 2002 : ITS for Mars Express : A
new approach to study Martian atmosphere, Adz. Space Res., 29, 131-142.
atmo-120 YUICHI ITO and HIROSIII FUKUNISHI
spheres : Application to deuterium, Icarus, 144, 114-123.
Fox, J.L., 1993 : On the escape of oxygen and hydrogen from Mars, J. GeoPhys. Res., 20, 1747-1750.
Fukunishi, H., S. Watanabe, M. Taguchi, S. Okano, and Y. Takahashi, 1999 : Mars ultraviolet
imaging spectrometer experiment on the Planet-B mission, Adv. Space Res., 23, 1903-1906.
Hunten, D.M., 1982: Thermal and nonthermal escape mechanisms for terrestrial bodies, Planet .
Space Sci. , 30, 773-783.
Hunten, D.M., 1990 : Kuiper prize lecture : escape of atmosphere, ancient and modern, Icarus, 85, 20.
Ito, K., T. Namioka, Y. Morioka, T. Sasaki, H . Noda, K. Goto, T. Katayama, and M. Koike, 1986 : High resolution VUV spectroscopic facility at the photon factory , Appl. Opt., 25, 837-847. Ito, Y., 2001 : Remote sensing of the geocorona on board the NOZOMI spacecraft . Doctoral thesis,
Tohoku University.
Korablev, 0.1, M. Ackerman, V.A. Krasnopolsky, V.I. Moroz , C. Muller, A.V. Rodin, and S.K.
Atreya, 1993 : Tentative identification of formaldehyde in the Martian atmosphere , Planet.
Space Sci., 41, 441-451.
Krasnopolsky, V.A., M.J. Mumma, and G. Randall, 1998 : Detection of atomic deuterium in the
upper atmosphere of Mars, Science, 280, 1576-1580.
Krasnopolsky, V.A., 2000 : On the deuterium abundance on Mars and some related problems , Icarus, 148, 597-602.
Liu, S.C. and T.M. Donahue, 1976 : The regulation of hydrogen and oxygen escape from Mars ,
Icarus, 28, 231-246.
Owen, T., J.P. Maillard, C.L. de Bergh, and L. Barry, 1988 : Deuterium on Mars : the abundance of DO and the value of D/H, Science, 240, 1767-1770.
Taguchi, M., H. Fukunishi, S. Watanabe , S. Okano, Y. Takahashi, and T.D. Kawahara, 2000a :
Ultraviolet imaging spectrometer (UVS) experiment on board the NOZOMI spacecraft :
Instrumentation and initial results, Earth Planets Space. 52, 49-60.
Taguchi, M., G. Funabashi, S. Watanabe. Y. Takahashi, and H. Fukunishi, 2000b : Lunar albedo at hydrogen Lyman a by the NOZOMI/UVS, Earth Planets Space., 52, 645-647.
Tsuruda, K., I. Nakatani, and T. Yamamoto , 1996 : PLANET -B mission to Mars-1998, Adv. Space Res., 17, 21-29.
Visconti, G., 1977 : Hydrogen escape in the terrestrial atmosphere at low oxygen levels : A
chemical model, j. Atmos. Sci.. 34, 193-204.
Watson, L.L., I.D. Hutcheon, S. Epstein, and E.M. Stolper , 1993 : D/H ratios and water contents of Amphiboles in magmatic inclusions in Chassigny and Shergotty , Meteoritics, 28, 456. Yung, Y.L., J. Wen, J.P. Pinto, K.K. Pierce, and M . Allen, 1988 : HDO in the Martian
Implications for the abundance of crustal water , Icarus, 76, 146-159.
Yung, Y.L. and D.M. Kass, 1998 : Deuteronomy ? : A puzzle of deuterium and oxygen on Mars , Science, 280, 1545-1946.
Zahnle, K. J. and J.F. Kasting, 1986 : Mass fractionation during transonic escape and implications for
loss of water from Mars and Venus, Icarus, 68, 462-480.
A D/H LYMAN ALPHA PHOTOMETER FOR THE NOZOMI SPACECRAFT 121
Appendix
Calibration of the absorption cells using the 6VOPE spectrometer
As pointed out in Section 2, it is essential to understand the absorption cell property
in order to correctly retrieve the kinetic temperature of incident Lyman a emission. in
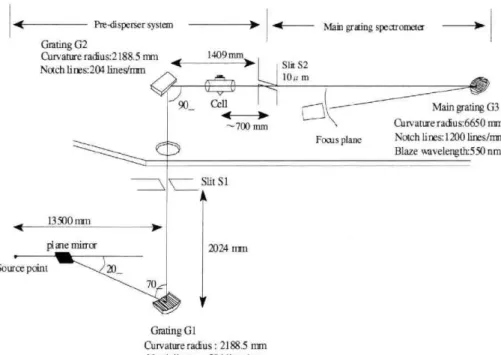
order to quantitatively measure the absorption cell property, we have used a VUV
spectrometer facilitated at Tukuba High Energy Particle Laboratory. This
spectrometer is called 6VOPE (6.65-m vertical dispersion off-plane eagle spectrometer)
(Ito et al., 1986). Optical setup for calibration of the absorption cell at 6VOPE is shown
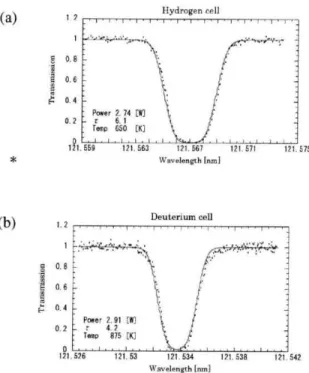
in Fig. Al. We have measured the absorption cell profiles. Examples of measured
absorption profiles and fitted profiles are shown in Figs. A2(a) and (b) for the hydrogen
and deuterium cells. By performing least square fitting of a Gaussian function to the
measured profile, we have successfully obtained unique parameters : kinetic temperature
(Tatom) of hydrogen (deuterium) atoms and the optical depth (To) which identify the
absorption cell profiles.
The relationship between the atomic temperature and the filament power
consump-tion of the hydrogen and deuterium cells are summarized in Figs. A3(a) and (b). Also,
the relationship between the optical depth and the filament power consumption of the
hydrogen and deuterium cells are summarized in Figs. A4(a) and (b). The atomic
hydrogen gas temperature TH and the optical depth rtf of the hydrogen absorption cell
are given as
Pre-disperser system >0 -4— Main grating spectrometer
Grating G2
Curvature radius:2188.5 mm E 1409 mm )11, Slit S2
Notch lines:204 lines/mm 10
ki m
90_ Cell Main grating G3
—700 mm Curvature radius:6650 mm
Focus plane Notch lines:1200 lines/mm
Blaze wavelength:550 nm \ Slit S1 A 13500 mm
plane min-or 2024 inn
Source point 20_ 70A y Grating G1 Curvature radius : 2188.5 film
Notch lines :204 lines/mm
Fig. Al. Layout of the absorption profile measurement of the cell using the 6\TOPE spectrometer.
P.)
YUICHI ITO and HIROSHI FUKUNISIII
(a)
1.
2 -
Hydrogen
cell
. • 2 00 •8-• -
1
0.6 -- . .. -.
. i
_ 2 4 0.4--• • Power 2. 74.[W]0.
2
- r 6.
1=,
Temp 650 [6) 0 . , , , ,•,1_,..J,L_, -I.1,i,I,I.i.1 121.656 121.563 121.567 121.571 121. 575 * Wavelength InmI(b)
1.
2
Deuterium
cell
. . 2 O. 8'2'.
1 0.6
1
.
E; 0.4 . Power 2.91 Dr 0.2 r 4. 2 • Taw 875 [K] 0 . ._. 121 , 526 121. 53 121. 534 121. 532 121. 542 Wavelength [em)Fig. A2. Examples of absorption profile measurements and fitted Gaussian curves for the hydrogen cell (a) and the deuterium Lyman cell (b).
Hydrogen absorption cell
1000 ,
(a)
900 1 : op 800 Lik 700
--,
• 2 • •• ..?, 600..- = • . • .••I 500
:
. . ..
• n 0.5 1 1.5 2 2.3 3 & 5 Power [WI Deuterium absorption cell1000 , , , , , , , , ,
(b)
900 :- . -: .. p2 800 7 • • ta •••• E 700 - - 2 . •2' 600 : •W 500
1•{
0 0.5 1 1.5 2 2.5 3 16 Power NAFig. A3. Variations in the kinetic temperature of atomic gas in the cell as a function of filament power consumption and a least square fitting to them , for the hydrogen
cell (a) and the deuterium cell (b).
A D/H LYMAN ALPHA PHOTOMETER FOR THE NOZOMI SPACECRAFT 123
(a) 7 Hydrogen absorption cell
6 • • 5 •• 4 • - :. • • e 2 • 1 L • • •• 0 0.5 1 1.5 2 2.5 3 3.5 Power 1W1
(b) 7 Deuterium absorption cell
6 5 s4 ,- • • •