Employing Many-Facet Rasch Analysis to Measure Progress
in L2 Speaking Proficiency
James Sick
Abstract
Assessing foreign language speaking ability requires that raters make subjective judgments of observed speaking performances. Consequently, factors other than the learner’ s ability, such as rater severity and topic difficulty, can also influence speaking test scores. The situation is further exacerbated when gains are measured because the error component of both assessments cumulates in the gain score. This paper provides a review of some difficulties inherent in measuring progress in speaking proficiency and an assessment of solutions provided by a statistical technique known as many-facet Rasch analysis. Two data sets composed of pre and post speaking assessments are analyzed. It is concluded that utilizing Rasch analysis can provide a more accurate picture of gains achieved in speaking proficiency.
【Keywords】 speaking, proficiency, testing, Rasch, Facets
要 旨 外国語スピーキング能力評価は最終的には評価者の主観に委ねられる。従って、評価者 の厳しさやテーマの難易度など学習者の能力以外の要因が評価に影響を及ぼすと考えられ る。伸度を測定する場合には pre と post 測定値それぞれにエラーが含まれるため、この問 題はさらに増長される。本論文はスピーキング能力の伸度測定に内在する問題を概観し、 対応策としてのラッシュ測定法の利用を考察した。二回のスピーキングテスト結果を分析 した結果、ラッシュ測定法を用いることで、より精度の高い伸度測定が可能であると結論 づけられた。 【キーワード】 スピーキング能力、言語テスト、スピーキングテスト
Introduction
Communicatively oriented EFL programs often stress the development of speaking proficiency as a major curricular goal. Assessing the degree to which this goal has been achieved, however, presents challenging technical and practical problems (Douglas, 1994; McNamara, 1995). Assessing speaking proficiency usually involves having trained raters make subjective judgments about a spoken performance. If the goal is to measure progress in speaking proficiency, performances must be judged on two or more occasions and compared. Judged performances are time and labor intensive, however, and thus costly. In addition to
the cost involved, numerous technical difficulties arise due to statistical confounds. Scores on speaking tests are usually influenced by factors other than the students’ actual speaking ability, such as rater severity, topic difficulty, and the social relationships of the participants. Moreover, progress in foreign language attainment can be painstakingly slow. In many instances, gains in speaking proficiency made during a short period of moderate-intensity instruction are small, and it is difficult to measure them reliably (Freed, 1990; Milleret, 1991).
The aim of the present research is to investigate an approach to measuring progress in speaking proficiency with a view toward overcoming, or at least mitigating, some of these obstacles. There will first be a detailed review of three obstacles to measuring speaking progress that typically arise in an EFL program such as J. F. Oberlin’s English Language Program (ELP). Following that, there will be a brief introduction to many-facet Rasch measurement theory, an approach to measurement that informs much of the methodology used in this research. Finally, data drawn from two instances of measuring speaking progress with ELP students will be analyzed and discussed.
Three Factors influencing the scoring of speaking performances
1) Rater severity.
Speaking assessments generally involve subjective judgments made by raters observing student performances and, as every student knows, raters differ in how severely or leniently they award scores. Often, a speaking assessment has as much to do with the rater as with the student’s demonstrated speaking ability. It is important to note, however, that this variation can be both systematic and unsystematic. A rater might award a score that is higher or lower than expected due to non-reproducible factors, such as fatigue, momentary inattention, or an emotional reaction to an opinion expressed. On the other hand, raters also vary due to consistent personality factors that influence all the scores that they award. Rater severity might be thought of as a personality trait similar to pessimism and optimism. Some raters by nature focus on the weak points in a performance and tend to award lower scores. Other raters focus on strong points and are more inclined to give higher scores. Both of these perspectives are valuable for constructing an informative assessment of a speaking performance. Nevertheless, if rater severity is not recognized and controlled for in some way, it can distort the assessment of the student’s true speaking ability.
To some extent, effects due to differences in rater severity can be mitigated by having two or more raters observe each performance and averaging their scores. Averaging does not completely overcome the problem, however, as two lenient or two severe raters could by chance be assigned to observe performances together. Another approach, which will be discussed in more detail below, is to estimate where each rater lies along a measure of severity and leniency and adjust the scores each awards accordingly.
2) Speaking Test Format.
Another aspect that might impact a speaking performance is the test format. Possible formats include speeches, oral proficiency interviews, or group discussions. Due to individual differences in temperament, some students might favor one format over another. In addition, a speaking test always entails a social context of some sort, and all of the complexities of social interaction may influence performance. To illustrate, in oral proficiency interviews the rater is an active participant or facilitator of the discussion, but is rarely equal in social status or power to the interviewee. The interviewer’s skill in facilitating, accommodating, and putting the student at ease can exert a powerful influence on the speech that is produced (McNamara, 1995; Ross, 1992). In group discussions, where several participants engage in discussion as they are assessed by one or more raters, such things as age, gender, or familiarity of the participants might affect whether they are able to produce a performance that is truly representative of their speaking proficiency (Bonk & Ockey, 2003).
3) Topic difficulty.
Another factor that can influence the score attained on a speaking performance is the topic of the speech or discussion. A speaking performance requires a topic, and some topics might be more difficult to speak about than others. In some formats, such as speeches or guided interviews, participants are given leeway in nominating and pursuing their own topics. If the goal is to assess a student’s ability to speak impromptu, however, a topic prompt may be assigned just before, or even during the performance. If students are assigned different topics, the content or difficulty of the topic might affect their ability to demonstrate fluency, vocabulary, and grammatical control, and thus impact the score they receive.
Problems inherent in measuring gains
Progress implies a positive change in measures taken on two or more occasions. A measure of progress is usually reported as a gain score, which is derived by subtracting the score awarded at Time 1 from the score awarded at Time 2. Gain scores, however, are known to have poor statistical reliability. This arises from the fact that the various confounds discussed above, together with the unique, non-reproducible aspects of each performance, add an element of error to subjective speaking scores. When reported rigorously, performance scores include an estimated margin of error. Whenever two scores are used to calculate a gain score, this error is compounded (Francis, Fletcher, Stuebing, Davidson, & Thompson, 1991; Mellenbergh, 1999).
To illustrate, if two oral proficiency interviews are rated on a nine-point scale, each score might have a margin of error of plus or minus 1 point. The gain scores, however, would have a margin of error of plus or minus 2 points. In addition, the gain scores must have a narrower range than the nine-point scale from which they were derived, since the largest possible gain
equals 9 minus 1. Typically, gain scores from two nine-point scales range from about -2 to 4, with a margin of error of plus or minus 2. Note that gain score analysis often produces a substantial number of negative scores. This is usually not due to actual attrition in performance, however. It is an unfortunate but unavoidable statistical artifact of the narrow range and large margin of error of gain scores.
If the primary purpose of measuring progress is to report the average gain score of a large group, negative scores do not pose much of a problem because gains with positively biased error will cancel out those with negatively biased error (Zimmermann & Williams, 1982). Gain scores are more problematic, however, if there is a desire to report gains directly to students. Students often wish to gauge their progress, and learning that their scores have decreased can be quite demotivating. Investigating ways to construct reliable gain scores, without a substantial portion of negative scores, is a primary goal of this research.
Many-facet Rasch analysis
Many-facet Rasch analysis refers to a family of statistical techniques for analyzing the quality of judged performances such as speaking tests, and for improving the accuracy of measurement by controlling for confounds such as rater severity and topic difficulty. These techniques are derived from the work of Georg Rasch, a Danish mathematician, who originally developed measurement models for dichotomously scored tests (1960). Rasch’s work was later extended to rating scale analysis by Andrich (1978), and partial-credit scoring by Masters (1982). The many-facet Rasch Model was developed by Linacre (1992), specifically to deal with measurement situations involving multiple confounds such as those discussed previously. It is usually performed using specialized software called FACETS (Linacre, 2006b).
In many-facet Rasch analysis, elements that systematically influence test scores are referred to as measurement facets. Measurement facets include such things as rater severity, topic difficulty, and test format, as well as the participants’ speaking ability as manifested in an observed performance. Many other things, such as speaking order, time of day, whether participants are strangers or acquaintances, etc., can be treated as measurement facets if the analyst believes they are significantly influencing the performances and there is systematic variation amongst the participants. In the many-facet Rasch approach, the analyst first attempts to estimate the variation of all the measurement facets. Adjustments can then be made to the facet of interest, usually the participant’s ability, to mitigate the undesirable effect of the other facets (Bond & Fox, 2007; Linacre, 1992; McNamara, 1996; Wright & Stone, 1979).
To estimate the degree of variation in measurement facets, there must be overlaps in the observations. For example, to estimate differences in rater severity, it is necessary that two raters observe a number of speaking performances together and that they award their scores without consulting each other. By analyzing the differences in their common ratings, it can be
determined whether raters differ systematically in how severely they judge performances and estimate the magnitude of the effect on their ratings. When there are a large number of raters involved, as is typical of a large-scale speaking assessment, it is not necessary that all raters observe a sample of students together. It is possible to get accurate estimates by pairing raters and having them rotate periodically. For example, if it is determined that Rater 1 is more severe than Rater 2, and Rater 2 is more severe than Rater 3, it can be inferred that Rater 1 is also more severe than Rater 3, even if Rater 1 and Rater 3 do not jointly observe any performance. What is referred to as a judging plan in Rasch terminology, is a plan to rotate raters in such a way that all are linked through a chain of overlapping observations (Linacre, 2006a).
If students in a large scale speaking assessment are assigned more than one speaking prompt, it might also be desirable to treat topic as a measurement facet. Ideally, we would ask a subset of students to be judged twice, speaking on different topics, so that it could be determined whether the topics have any systematic effect on student performances. In practice, this is usually impractical. If, however, there is a large sample of students, and topics are assigned randomly, we can also estimate the topic effect by assuming that the students assigned to each topic have an equivalent mean ability. Any differences in group mean scores are then attributed to the fact that one group had an easier or more difficult topic than the other group. This is not an ideal approach, but in practice it produces a usable estimate while minimizing inconvenience to students and staff.
Research questions
The goal of the current project was to investigate systematic differences in rater severity and topic difficulty in two J. F. Oberlin English Language Program (ELP) speaking assessments, and to assess the usefulness of employing many-facet Rasch analysis to compensate for systematic variance in these two measurement facets. Two data sets were utilized: a pre-departure and post-departure speaking assessment of a cohort of study abroad students, and a spring-semester autumn-semester comparison of a group discussion test used to assess advanced level ELP core students. Formally, the research questions can be stated as follows:
1. To what degree do ELP teachers vary in rater severity when assigning ratings to jointly observed speaking performances?
2. To what degree does the discussion topic influence student performance?
3. Are objective measurements of speaking ability derived from many-facet Rasch analysis accurate and reliable enough to measure the rather fine degrees of progress that are usually attained in an EFL program?
4. If the answer to research Question 3 is affirmative, are improvements in accuracy obtained by employing many-facet Rasch analysis sufficient to justify the extra time and
effort it requires?
The first two questions comprise a descriptive investigation of the effects of raters and topics on speaking tests conducted in the ELP. In small-scale speaking assessments, these factors are frequently ignored, and it is of interest here to determine the extent to which they impact students’ scores and grades. In regard to Research Questions 3 and 4, comparisons will be made between raw scores and Rasch measures in order to aid informed decisions about the usefulness of incorporating these techniques into standard practice.
Analysis 1: The GO Program
In 2007, J. F. Oberlin University launched the GO (Global Outreach) study abroad program, which assigned participants to foreign institutions for one semester of foreign language study. 101 students of varying degrees of English proficiency participated in the 1st GO Cohort,
attending ESL programs at 18 institutions in 6 countries. Extensive pre and post departure English proficiency batteries were conducted by the ELP in order to gauge the effectiveness of the GO program, and to provide detailed reports of progress to the GO participants. All four skills were tested in this initial investigation, but the present study will consider only speaking. Six students were not present for one of the two speaking tests, bringing the total number of participants to 95. The following two assessments of speaking ability were conducted both pre and post departure:
Oral Proficiency Interview (OPI). Each student was given a five-minute oral proficiency interview conducted and rated by one ELP teacher. Teachers were provided with a detailed rating rubric and a general outline detailing how to conduct the interview, including suggested topics and questions. They were instructed to take a facilitative stance, conducting the interview entirely in English, but providing vocabulary and recasts when needed. Although teachers were encouraged to pose challenging questions in order to provide students with opportunities to demonstrate their skill, students were generally given wide leeway in nominating topics and controlling the flow of conversation. Student performances were rated on a single, 9-point, holistic scale.
Group Discussion Test (GDT). Each student participated in a four-member, ten-minute group discussion on a set topic. Discussions were observed and rated by two ELP teachers who did not participate or intervene, enabling them to give full attention to rating the performances. Each participant was rated on three aspects of their performance: language accuracy, fluency, and communication strategies. Each of these aspects was rated on a 9-point scale. Raw scores on the GDT could range from 6 (one point from each rater on each aspect) to 54 (nine points from each rater for each of the three aspects).
Gains in the Oral Proficiency Interview
Because each OPI was conducted by a single teacher, with no overlapping ratings to compare, it was not possible to conduct a Rasch analysis with this data, nor to estimate the reliability of the teachers’ rating using classical techniques. Nevertheless, the OPI data is of interest in this study because the one-on-one interview is highly valued by stakeholders in the GO program. It offers an opportunity for both students to seek information about their destination country from an ELP teacher, and for ELP teachers to gather first-hand information from students about their impressions of and experiences in the GO program. It is also relatively easy to organize and administer in terms of staffing demands. Table 1 summarizes the gain scores, or progress, that individual GO participants achieved during their study abroad, as measured by the pre and post departure OPIs. From the table we can see that 2 participants had a gain of 4 points on the 9-point OPI scale that was employed. Likewise, 12 participants achieved a gain of 3 points during their participation in the GO program. In all, 62 percent of the participants showed a positive gain. Rather disconcertingly, 38 percent showed no gain or even a negative gain between pre and post departure speaking performances.
Table 1. Gain Scores for Oral Proficiency Interview
Raw score gains Number of students Percent of students Positive gains versus no gains
4 2 2% 62% 3 12 13% 2 21 22% 1 24 25% 0 22 23% 38% -1 11 12% -2 2 2% -3 1 1%
Note. N = 95. Raw scores range from 1 to 9. Gain scores were derived by subtracting the pre-score from
the post-score.
In interpreting the OPI gain scores, it is essential to recognize that anecdotal impressions gathered from GO participants, performance on other tests such as listening and reading, and
common sense all indicate that most, if not all GO participants would have made some progress in speaking proficiency during their study abroad. It seems rather implausible that 38 percent did not make any improvement at speaking English during their three-month study abroad and that 15 percent actually got worse. In fact, what we see in Table 1 is a classic example of the pitfalls of employing simple gain scores to measure progress. Although it is not possible to estimate the reliability of the OPI scores in this case because there was only one rater per interview, previous studies indicate that OPI ratings generally have a margin of error of plus or minus 1 to 1.5 points (Thomson, 1995, March 25-28). When this error is compounded in pre- and post-test gain scores, the margin of error is doubled. It is consequently more accurate in this case to make statements such as “11 GO participants had a pre-post gain score of minus 1, plus or minus two.” The 38 percent of GO participants who did not show a positive gain are more likely to be victims of the limitations of measurement than genuine low achievers.
The average gain score of all participants on the 9-point OPI scale was in fact 1.1, a figure that is probably accurate because positive and negative error biases cancel each other out when a group mean is calculated. But because a major aim of the GO testing battery was to provide individual students with a gauge of their progress, reporting to 38 percent of the students that they did not improve at speaking or actually got worse, would clearly be demotivating and unacceptable. The number of zero or negative gains found in the OPI will thus be used as a benchmark when judging improvements in accuracy achieved by employing more sophisticated analyses, such as many-facet Rasch analysis.
Gains in the GO Group Discussion Test
Because the GDT format allowed teachers to give their full attention to rating the performances, they were able to rate each participant on separate 9-point scales for Language Accuracy, Fluency, and Communication Strategies. When scores from both raters for the three scales were summed, raw scores could potentially range from 6 to 54. Table 2 provides a summary of the pre and post departure gains in raw scores for the GDT. The additional information afforded by using two raters and three scales appears to have provided a more precise assessment of speaking performances, as we see a substantial decrease in the number of participants who did not show a positive gain. Using the more refined scoring scales from the GDT, only 14 percent of the participants failed to show a positive gain between pre and post departure GDTs, as compared to 38 percent on the OPI. Clearly, adding a second rater adds to the overall accuracy of the speaking assessment. There has not, however, been any attempt at this point to estimate or adjust for differences in rater severity in this analysis. We now turn our attention to a many-facet Rasch analysis of the GDT data and Research Question 1; to what degree do ELP teachers vary in the severity in which they rate performances?
Table 2. Raw Score Gains in Pre and Post GO Group Discussion Test Raw score gains Number of students Percent of students versus no gainsPositive gains
30 plus 2 2% 86% 21 to 30 23 24% 11 to 20 31 33% 1 to 10 26 27% zero or less 13 14% 14%
Note. N = 95. Raw scores range from 6 to 54. Gain scores were derived by subtracting the Pre-score from
the Post-score.
Many-facet Rasch Analysis of the GO Group Discussion Test
A Rasch analysis was conducted for both the pre and post departure Group Discussion Tests (GDT) using the FACETS computer program (Linacre, 2006b). The prompts for the two discussion tests were “Discuss life in your hometown” (pre) and “Discuss life in your host city” (post). Because these two topics are quite similar, they were treated as a single topic. In this analysis, there were thus only two measurement facets: student ability and rater severity.
Figure 1 is a variable map output by FACETS that plots the distributions of the two measurement facets. The variable map is a principal tool of many-facet Rasch analysis, used to show the relationship of the observed raw scores to an adjusted measurement scale and to reveal the relative impact of each facet on the measurement system (Bond & Fox, 2007; Wright & Stone, 1979). A many-facet Rasch analysis uses the observed raw scores to simultaneously estimate all measurement facets and report them in a common metric called a logit. Logit scales are centered at zero, and in theory can range from plus to minus infinity. In practice, they typically span a range from minus 10 to plus 10 logits. The logit scale is displayed along the left side of the Figure 1. The average equivalent in raw score terms, that is, the original rating scale, is displayed along the right. The facets have been positively oriented, meaning that the more able (high scoring) students and the more lenient raters appear toward the top of the map.
Figure 1. Variable Map of the GO Group Discussion Test
Note. Raters’ names are pyseudonyms.
From Figure 1 we can discern that there is indeed measurable variance in the severity with which the raters judged performances. The most lenient raters, Lillian and Ronald are a little more than 2.5 logits more lenient than Dudley and Tom, the most severe. Noting that the examinees span a range of about 15 logits, we can say that the characteristics of the
raters account for about 16% (2.5 divided by 15) of the variance in the speaking scores of the examinees. Or looking at the raw score scale on the right side of the figure, we can say that Lillian and Ronald, the most lenient raters, on average tend to award scores from 1 to 1.5 points higher on the original 9-point rating scale than Dudley and Tom, the raters who are the most difficult to please.
The logit scale, because it uses negative values for below average scores, can be confusing for students. Logit scales can be made more user friendly by multiplying the logit value by a constant and adding a constant to the score. To report the FACETS derived speaking test scores to students in a more easy to understand format, logit scores were multiplied by 15 and a constant of 150 added, creating a scale with a mean of 150 and a range of approximately 60 to 300. This Rasch scale was then used to report pre and post speaking test measure gains to students.
Table 3 summarizes the gains in Rasch measures achieved by GO participants on the GDT. As mentioned previously, FACETS simultaneously estimates measures of examinee performance and rater severity, and adds an adjustment to examinee measures to compensate for rater effects. Following this adjustment, which presumably corrects for measurement error introduced by the rater severity, there is a decrease of 5 percent in the number of students receiving negative gain scores. Compared to the 24 percent decrease in negative gain scores between the OPI and the unadjusted GDT, this 5 percent change is rather modest. Nevertheless, because a primary goal of these analyses was to construct measures of progress that could be reported to individual students, even a small improvement can be meaningful. In the final analysis, which was reported to the GO participants, only 9 participants did not achieve a positive measure of speaking progress during the course of their study abroad, compared to 13 when no adjustment for rater severity was made.
Table 3. Rasch Measure Gains on the GO Group Discussion Test
Raw score gains Number of students Percent of students versus no gainsPositive gains
90 or more 10 11% 91% 60 to 89 24 25% 30 to 59 31 33% 1 to 29 21 22% zero or less 9 9% 9%
Note. N = 95. Raw scores range from 6 to 54. Gain scores were derived by subtracting the Pre-score from
Analysis 2: The ELP Core Level 3 GDT
In 2006, the ELP introduced a Group Discussion Test (GDT) as part of the Level 3 (advanced) 1st year core program. Approximately 200 Level 3 students sit two GDTs, one near the end of the spring semester and another near the end of the autumn semester. Students are randomly mixed with students from another class and speak for ten minutes on a set topic. As with the GO GDT, groups are comprised of four students, and each discussion is observed and rated by two teachers who rate the performances on three aspects, using a standard letter grade scale. Although the letter grade scale used for the Level 3 GDT has 13 steps, the descriptors are nearly identical to those used for the GO GDT. The main difference is that the letter grade scale, with plusses and minuses, allows for two intermediate steps between each descriptor. Apart from that, the format, procedures, and scoring for the Level 3 GDT are comparable to the GDT used for the GO testing. The results of the Level 3 GDT have been analyzed using FACETS each year ,and since 2007, FACETS has been used to adjust final letter grades for differences due to rater severity and topic difficulty.
The GDT used for the core program differs from the one used for the GO program in one important way. In the Level 3 GDT, students are randomly assigned one of two or three set topics, each related to a unit of the textbook. Students are told the topics in advance and have ample time to practice discussing them with their classmates before the test. For the actual GDT, however, they are mixed with students from other classes and must blindly draw their speech prompt just before they begin the discussion. Even though the possible topics are known in advance, there is a common perception among students that some topics are more difficult than others, and that those who draw a tough topic are disadvantaged. A primary goal of the following analysis is to address Research Question 2, the degree to which topic choice impacts speaking performance.
The Spring 2007 version of the GDT used three topics: 1) Cities - Discuss cities you have visited or hope to visit as a tourist, 2) Education A - Discuss ways to improve education at Obirin University or in Japan, and 3) Education B - Discuss some important things you have learned and strategies you used to learn them. Topic difficulty was of interest to the Level 3 curriculum team because of the perception among some students that Topic 1, Cities, was easier than the other topics. Because it was impractical to have students speak on more than one topic, estimates of topic difficulty were derived using the group anchoring method (Linacre, 2006a, p. 85). Students were randomly assigned to topics by drawing a prompt from a cup until all the prompts were used. Because they were randomly assigned, it could be assumed for convenience that the mean ability of each group was equivalent and differences in observed group performances could be attributed to the topic.
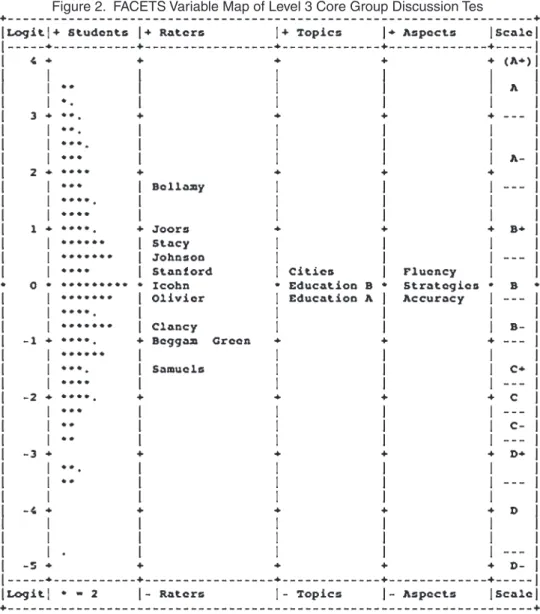
Figure 2 is a FACETS variable map of the GDT. In this analysis, Raters, Topics, and Aspects are treated as measurement facets in order to estimate the effect that rater severity and
topic difficulty have on the scores awarded, as well as to investigate whether it is more difficult to get a high score on some aspects of the performance than others. First, note that there are small but measurable differences in difficulty among the three speech topics. Statistical tests performed with FACETS confirmed that these differences were significant at the p < .01 level.
Figure 2. FACETS Variable Map of Level 3 Core Group Discussion Tes
Note. Raters’ names are pyseudonyms
As students had claimed, Topic 1 tended to elicit higher rated performances than the other topics. The differences are small, however. On average, students who discussed Cities were awarded speaking scores about 0.7 logits higher than students who were assigned Education A, the most difficult topic. Looking on the right side of Figure 2, we can see that this would correspond to about one half of a letter grade or less, were the scores not adjusted by FACETS.
Also note that it is slightly easier to elicit a high rating on the Fluency scale than on the Strategies or Accuracy scales. This matches the perceptions of teachers, who have reported that many Level 3 students can chat rather fluently, but often rely on simple vocabulary or produce inaccurate language. Because all students are rated on all aspects of their performance, however, these differences would not affect their Rasch measures or the adjusted letter grade.
More than the topic effect, what stands out about this analysis is the wide range of variance in rater severity. The most lenient and most severe raters varied by almost 3.5 logits, compared to 2.5 logits in the GO speaking test. However, the Level 3 speaking performances spanned a range of only 7 logits, compared to a range of almost 15 logits for the GO students. As a proportion of the variance in speaking performance measures, the rater variance for the Level 3 GDT was much greater. Comparing the positions of the most lenient and most severe raters to the letter grade scale on the right side of the figure, we can infer that Samuels and Bellamy, the most severe and the most lenient raters, might likely award a C+ and an A- when observing a performance rated B by the most typical ELP raters. In Autumn 2007, when letter grade scores reported back to students were first adjusted using FACETS to reflect a “fair average”, 24 percent of the students received a different letter grade than they would have received had no adjustments for rater severity and topic difficulty been made.
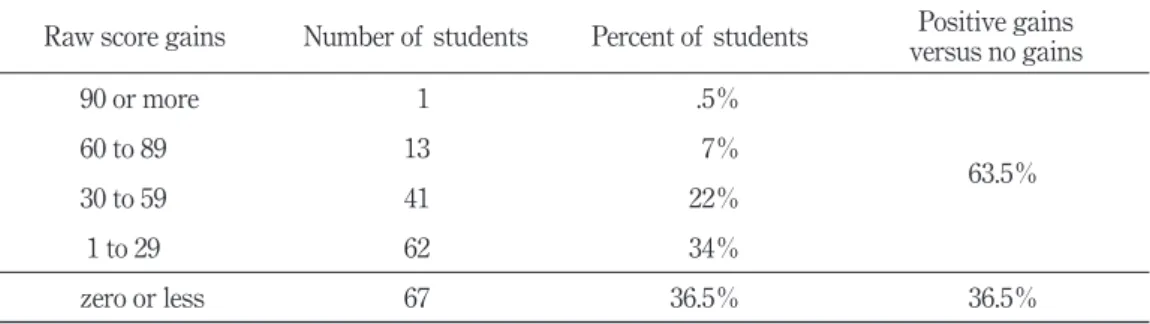
Table 4 reports the gains achieved between the 2007 spring and autumn administrations of the Level 3 GDT for 184 students who were present for both tests. Raw scores have been adjusted for differences in rater severity and topic difficulty using FACETS, and then converted to a user-friendly Rasch Scale. Although 63.5 percent of these students showed a positive gain in their speaking skill, compared to the GO students the percentage of students with positive gains is much smaller.
Table 4. Rasch Measure Gains on the Level 3 Group Discussion Test Raw score gains Number of students Percent of students versus no gainsPositive gains
90 or more 1 .5% 63.5% 60 to 89 13 7% 30 to 59 41 22% 1 to 29 62 34% zero or less 67 36.5% 36.5%
Note. N = 184. Rasch scores range from 60 to 300
Discussion
To review the research questions in light of the results, first note that the analyses indicate that ELP teachers do vary in severity when assigning ratings to observed speaking
performances, and in the case of the Level 3 GDT, differences in rater severity were substantial enough to affect student grades. Variation in rater severity appeared to be greater in the Level 3 GDT, however, than in the GDT used to assess the GO students. Note, however, that the range in student performance measures was much greater for the GO students (15 logits) than for the Level 3 students (7 logits). The Level 3 students were streamed prior to entry based on their ELP Placement Test scores (Sick, 2008), while the GO Program included participants from all three ELP proficiency levels. This tended to make the Level 3 students more difficult to rate, as performances were often very similar and teachers sometimes relied on small differences to distinguish them. The situation may have been further exacerbated by the 13-point letter grade scale used for the Level 3 GDT. An advantage of the letter grade scale is that it is familiar to both students and teachers. But by offering more choices to raters, the letter grade scale could produce more noise in the ratings, as teachers waver between narrow categories such as B plus or A minus. In fact, following the analysis of the GO data and an emerging acceptance of FACETS-derived grade adjustments, the letter grade scale was replaced with the 9-point numerical in 2008. Whatever the reasons for the rater differences, results from Analysis 2 indicate that these differences can have consequences, potentially affecting a student’s course grade and consequently a Grade Point Average.
Regarding Research Question 2, we observed that the assigned topic did appear to make a small but statistically significant difference to the ratings the performances elicited. It should be noted, however, that because there was no overlap between students and topics, estimates of topic difficulty rest on the assumption that the students assigned to each topic were of equivalent mean ability. As the topic groups were each comprised of approximately 61 homogeneous students, this assumption is probably justified, and analyses conducted in 2008 have tended to confirm it. Also, the fact that the finding was confirmatory, students’ belief that “Cities is easier” was stated prior to the analysis, lends additional credence. Although grade adjustments due to topic difficulty are relatively small, it is useful to be able to assure students that the FACETS scoring adjustment will compensate for any disadvantage due to the topic assignment.
Research Questions 3 and 4 address issues inherent in reporting gain scores to students and the degree to which many-facet Rasch analysis might mitigate these problems. We first observed in Table 1 that gain scores derived from oral proficiency interviews administered to GO students produced a substantial number of negative results that were not suitable for reporting back to students. In contrast, Rasch measures constructed from the GO Group Discussion Test produced positive gain scores for 91 percent of the participants. Most of the improvement, however, appears to have been due to the greater information obtained when employing two raters and a more detailed rating scale. As was shown in Tables 2 and 3, raw scores from the GO GDT produced positive gain scores for 86 percent of the participants.
Applying a many-facet Rasch analysis to adjust for rater severity resulted in positive gains for an additional 5 percent only. Although this improvement is modest, it could nevertheless be important to those 5 percent who would otherwise receive demotivating negative feedback. As for the question of whether Rasch analysis is cost effective, the primary cost of the GDT format is the necessity of employing two raters to observe performances. Once an initial FACETS analysis has been set up, it requires little effort to apply it to a new data set. The question of cost really revolves around whether staff and funding are available to permit joint observations of performances.
In Table 4, it can be seen that gain scores constructed from two end-of-term speaking tests administered to Level 3 core students produced positive gain scores for only 63.5 percent of the students, a somewhat disappointing result when compared to the GO speaking assessments. There are several factors to keep in mind when interpreting this result, however. First, the Level 3 GDT is first administered around week ten of the spring semester. Consequently, it is not, strictly speaking, a program pre-test. The Level 3 core curriculum places a strong emphasis on developing discussion skills, including strategies for managing interaction and the flow of discussion. It is feasible that a substantial part of the gain that the core program produces in group discussion skills is realized before the first GDT takes place. Second, even though teachers are instructed to rate performances according to the rating scale descriptors, this competes with a tendency to rate according to what teachers expect for students at that stage. In other words, teachers, who in this case are actively instructing these students, may be unconsciously raising the goalposts during the autumn semester. This would tend to normalize the scores and to suppress the measurement of gains. Finally, we must keep in mind that the ELP core is a required course and not all students are highly motivated to learn English. In contrast, the 1st GO Cohort were a self-selected, highly motivated group that anecdotal evidence suggests made substantial efforts to engage in communication while studying abroad. Certainly, some portion of the discrepancy between Level 3 and GO students is simply that not all of the Level 3 core students achieve gains large enough to measure reliably, particularly during this short period of moderate-intensity instruction.
Conclusion
This study has demonstrated that simple measurement models, such as single-rater, pre and post oral proficiency interviews, are inadequate for measuring progress with reliability suitable for providing feedback to learners. More complex models that incorporate multiple raters and compensate for the effects of extraneous factors such as rater severity and topic difficulty can improve the accuracy of speaking assessments and measurements of progress derived from them. Furthermore, analysis of the sources and magnitude of these effects can inform and promote incremental improvement in curriculum, assessment, and practice.
One might argue that the modest decrease in negative gain scores that resulted from the application of many-facet Rasch analysis to the GDT is rather trivial in comparison to the improvement obtained by simply adding a second rater and a more detailed, analytic rating scale. Although it is true that the larger part of the improved functioning of gain scores in the Group Discussion Test seems to have come from the addition of a second rater and a more comprehensive rating scale, the insights gained from the Rasch analysis were also quite valuable in gaining an understanding of the overall measurement system and the magnitude with which the various facets impact the scores. Whether regular implementation of these additional analyses are “worth the effort,” is, of course, a qualitative decision that can only be reached through a consensus of the stakeholders, taking into consideration the availability of human resources, and the use to which the results can be fruitfully employed.
付記 本研究は、桜美林大学言語教育研究所より研究運営助成を受けたものである。
References
Andrich, D. (1978). A rating formulation for ordered response categories. Psychometrica, 43(561-573).
Bond, T. G., & Fox, C. M. (2007). Applying the Rasch model: Fundamental measurement in the human sciences (2nd ed.). Mahwah, NJ: Lawrence Erlbaum.
Bonk, W. J., & Ockey, G. (2003). A many-facet Rasch analysis of the second language group oral discussion task Language Testing, 20(1), 89-110.
Douglas, D. (1994). Quantity and quality in speaking test performance. Langauge Testing, 11(2), 125-144.
Francis, D., Fletcher, J., Stuebing, K., Davidson, K., & Thompson, N. (1991). Analysis of change: Modeling individual growth. Journal of Consulting and clinical Psychology, 59(1), 27-37. Freed, B. (1990). Language learning in a study abroad context: The effects of interactive and
non-interactive out-of-class contact on grammatical achievement and oral proficiency. In J. Atlatis (Ed.), Linguistics, Language Teaching and Language Acquisition: The Interdependence of Theory, Practice and Research (pp. 459-477). Washington D. C.: Georgetown University Press.
Linacre, J. M. (1992). Many-facet Rasch measurement.
Linacre, J. M. (2006a). A users guide to FACETS and MINIFAC, version 3.6. Chicago: Winsteps. Linacre, J. M. (2006b). FACETS Rasch measurement computer program (Version 3.6). Chicago:
Winsteps.com.
Masters, G. N. (1982). A Rasch model for partial credit scoring. Psychometrica, 47, 149-174. McNamara, T. F. (1995). Modelling performance: opening Pandora’s Box. Applied Linguistics,
McNamara, T. F. (1996). Measuring second language performance. New York: Longman.
Mellenbergh, G. (1999). A Note on Simple Gain Score Precision. Applied Psychological Measurement, 23(1), 87-89.
Milleret, M. (1991). Assessing the Gain in Oral Proficiency from Summer Foreign Study [Electronic Version]. ADFL Bulletin, 22, 39-43. Retrieved March 8, 2009 from http://web2.adf l.org/adfl/bulletin/V22N3/223039.htm.
Rasch, G. (1960). Probabilistic models for some intelligence and attainment tests. Copenhagen: Denmarks Paedagogiske Institut.
Ross, S. (1992). Accommodative questions in oral proficiency interviews. Language Testing, 9(2), 173-187.
Sick, J. R. (2008). Employing Rasch analysis to Develop and Improve the ELP Placement Test. Obirin Studies in English Language and Literature, 48.
Thomson, I. (1995, March 25-28). A Study of Inter-rater Reliability of the ACTFL Oral Proficiency Interview in Five European Languages: Data from ESL, French, German, Russian, and Spanish. Paper presented at the Annual Meeting of the American Association of Applied Linguistics.
Wright, B. D., & Stone, M. H. (1979). Best test design. Chicago: MESA Press.
Zimmermann, D. W., & Williams, R. H. (1982). Gain scores in research can be highly reliable. Journal of Educational Measurement, 19, 149-154.