JAIST Repository
https://dspace.jaist.ac.jp/
Title
Hearing ‒ From Sensory Processing to Perception: Estimates of tuning of auditory filter using simultaneous and forward notched-noise masking Author(s) Unoki, Masashi; Miyauchi, Ryota; Tan, Chin-Tuan Citation
Issue Date 2007
Type Book
Text version author
URL http://hdl.handle.net/10119/7757
Rights
This is the author-created version of Springer, Masashi Unoki, Ryota Miyauchi and Chin-Tuan Tan, Hearing ‒ From Sensory Processing to Perception: Estimates of tuning of auditory filter using simultaneous and forward notched-noise masking, 2007, 19-26. The original publication is
available at www.springerlink.com,
http://dx.doi.org/10.1007/978-3-540-73009-5_3 Description
Estimates of tuning of auditory filter using
simultaneous and forward notched-noise masking
Masashi Unoki, Ryota Miyauchi, and Chin-Tuan Tan
School of Information Sience, Japan Advanced Institute of Science and Technology, {unoki, r-miyau,chintuan}@jaist.ac.jp
1 Introduction
The frequency selectivity of an auditory filter system is often conceptualized as a bank of bandpass auditory filters. Over the past 30 years, many simultaneous masking experiments using notched-noise maskers have been done to define the shape of the auditory filters (e.g., Glasberg and Moore 1990; Patterson and Nimmo-Smith 1980; Rosen and Baker, 1994). The studies of Glasberg and Moore (2000) and Baker and Rosen (2006) are notable inasmuch as they measured the human auditory filter shape over most of the range of frequencies and levels encountered in everyday hearing. The advantage of using notched-noise masking is that one can avoid off-frequency listening and investigate filter asymmetry. However, the derived filter shapes are also affected by the effects of suppression.
The tunings of auditory filters derived from data collected in forward masking experiments were apparently sharper than those derived from simultaneous masking experiments, especially when the signal levels are low. The tuning of a filter is commonly believed to be affected by cochlear nonlinearity such as the effect of suppression. In past studies, the tunings of auditory filters derived from simultaneous masking data were wider than those of filters derived from non-simultaneous (forward) masking data (Moore and Glasberg 1978; Glasberg and Moore 1982; Oxenham and Shera 2003). Heinz et al. (2002) showed that a tuning is generally sharpest when stimuli are at low levels and that suppression may affect tuning estimates more at high characteristic frequencies (CFs) than at low CFs. If the suggestion of Heinz et al. (2002) holds, i.e., if suppression affects frequency changes, comparing the filter bandwidths derived from simultaneous and forward masking experiments would indicate this.
In this study, we attempt to estimate filter tunings using both simultaneous and forward masking experiments with a notched-noise masker to investigate how the effects of suppression affect estimates of frequency selectivity across signal frequencies, signal levels, notch conditions (symmetric and asymmetric), and signal delays. This study extends the study of Unoki and Tan (2005).
2 Simultaneous and forward masking with notched-noise masker
2.1 Methods
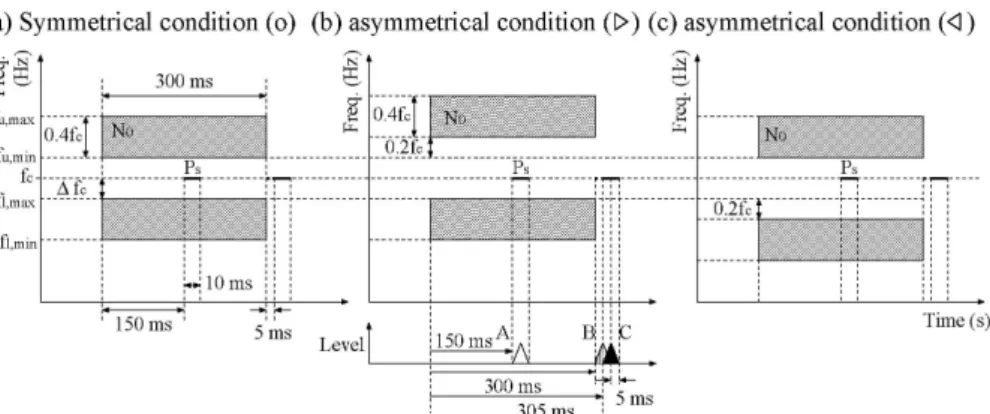
A diagram of the stimulus used in our masking experiments is shown in Fig. 1. The signal frequencies ( fc) were 0.5, 1.0, 2.0, and 4.0 kHz. The notched-noise masker consisted of two bands of white noise where each bandwidth was fixed as 0.4×fc. Under five conditions, the notch was symmetrically placed about fc. The values of
c c f f /
Δ under these conditions were 0.0, 0.1, 0.2, 0.3, and 0.4 (Fig. 1(a)). Under four asymmetric conditions, the combinations of the lower and upper Δf /c fcs were (0.3, 0.1), (0.4, 0.2), (0.1, 0.3), and (0.2, 0.4), as shown in Figs. 1(b) and (c).
In the masking experiments, we used three time conditions: the onset-interval between the notched-noise masker and probe was 150, 300, and 305 ms, labeled A, B, and C in Fig. 1. Time condition A corresponded to the simultaneous masking, while B and C corresponded to the forward masking. At a fixed probe level,Ps (10, 20, and 30 dB SL), the masker levels, N0, at the masked thresholds were measured
for a brief 10-ms signal (5-ms raised-cosine ramps, no steady state) in the presence of a 300-ms masker gated with 15-ms raised-cosine ramps.
Fifteen normal-hearing listeners, aged 21 to 33, participated in the experiments. Six, seven, and six of them participated in the experiments with time conditions A, B, and C. Four participated under two conditions. The absolute thresholds of all subjects, measured through a standard audiometric tone test using a RION AA-72B audiometer, were 15 dB HL or less for both ears at octave frequencies between 0.125 and 8.0 kHz. All subjects were given at least two hours of practice.
All stimuli were re-generated digitally at a sampling frequency of 48 kHz and presented via a Tucker-Davis Technologies (TDT) system III real-time processor (TDT RP2). The masker and signal were separately attenuated by two programmable attenuators (TDT PA5) before they were mixed (using TDT SM5)
and passed through a headphone buffer (TDT HB7) for presentation. The stimuli were presented monaurally to the subjects in a double-walled sound-attenuating booth via Etymotic Research ER2 insert earphone. The level of the stimuli were verified using a B&K 4152 Artificial Ear Simulator with a 2-cm3 coupler (B&K DB 0138) and a B&K 2231 Modular Precision Sound Level Meter.
Masked thresholds were measured using a three-alternative forced-choice (3AFC) three-down one-up procedure that tracks the 79.4% point on the psychometric function (Levitt 1970). Three intervals of stimuli were presented sequentially using a 500-ms inter-stimulus interval in each trial. Subjects were required to identify the intervals that carried the probe signals using numbered push-buttons on a response box. Feedback was provided by lighting up the LEDs corresponding to the correct interval on the response box after each trial. A run was terminated after twelve reversals. The step size was 5 dB for the first four reversals and 2 dB thereafter. The threshold was defined as the mean signal level at the last eight reversals. All data in which the masker level at the threshold was over 90 dB SPL were eliminated because they were affected by the compression effect. 2.2 Results and discussion
The mean masked thresholds for signal frequencies of 1.0 and 2.0 kHz in the three time conditions are plotted in Fig. 2 as functions of the signal levels. Those for 0.5 and 4.0 kHz are omitted here, but the trends of all data were similar. The abscissas of the plots in this figure show the smaller of the two values of Δf /c fc. The circles denote the mean masked thresholds under the symmetric notched-noise conditions (Fig. 1 (a)). The triangles pointing to the right (►) denote the mean masked
Fig. 2. Mean masked thresholds in masking experiments with three time conditions. A, B,
thresholds in the asymmetric notched-noise conditions where Δf /c fc for the upper noise band was 0.2 greater than that for the lower noise band (Fig. 1(b)). The triangles pointing the left (◄) denote the mean masked thresholds under the asymmetric notched-noise conditions where Δf /c fc for the lower noise band was 0.2 greater than that for the upper noise band (Fig. 1(c)). We found that the masked threshold increased as the notch width was increased. We also found that the ◄s were consistently higher than the ►s. This suggests that the auditory filter shapes were asymmetric, with a steeper high frequency slope.
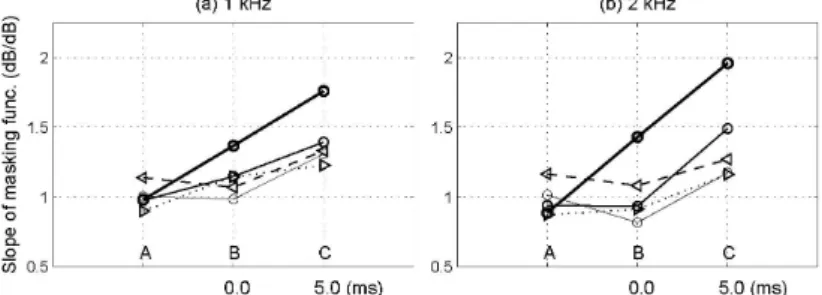
The slopes of the growth of the masking functions (the variability of the masker level at the threshold in terms of signal levels from 10 to 30 dB SL) for 1.0 and 2.0 kHz under the three time conditions (A, B, and C) are shown in Fig. 3. The thick, medium, and thin solid lines show the slopes under the symmetric notch conditions (
o
) of 0.0, 0.1, and 0.2. The dotted and dashed lines show the slope under the asymmetric conditions (► and ◄) of 0.1. The slope under the ◄-notch condition is greater than that under the ►-notch condition. In addition, the slope in C is greater than those in A and B. These results suggest that filter non-linearity such as compression tended to occur as the signal was delayed under the three time conditions (A, B, and C) and that the decayed lower notched-noise components still might affect the masking as suppressive masking in the condition C.3 Estimation of the filter tuning
The most common method for estimating auditory filter shape is the roex filter model based on the power spectrum model of masking. The current form was proposed by Glasberg and Moore (2000). This model can be used to precisely account for simultaneous masking. It may be used to estimate the filter shape from forward masking as a pilot test. However, it does not suitably account for forward masking with a complex or noise masker because it cannot separately deal with excitatory and suppressive masking (Wojtczak and Viemeister 2004).
We used the parallel roex filter (Unoki et al. 2006) to estimate the filter shape and tuning under the three time conditions as an alternative method. Because this
Fig. 3. Mean slope of growth of masking function under three conditions: simultaneous
model consists of a passive tail roex and an active tip roex with the schematic I/O function used by Glasberg and Moore (2000) so that this can deal with the above problem. The internal level, P , is determined as the output of the passive tail rxp filter (t), and then the active tip filter (p) varies with this level. The parallel roex filter is characterized by five parameters (tl, tu, pl, pu, and Gmax). Another two
non-filter parameters (efficiency, K, and absolute threshold, P0) are used in the
power spectrum model. These parameters are represented as a function of the normalized ERBN-rate, Ef =ERBN-rate(f)/ERBN-rate(1kHz)−1 , and were
determined by using the refined fitting procedure used by Unoki et al. (2006) on
masking data with the three time conditions. This fitting procedure also included the outer and the effect of transmission in precochlear processing, MidEar correction (Glasberg and Moore 2000) and the effect of off-frequency listening (Patterson and Nimmo-Smith 1980). In this fitting procedure, as the revised point, we incorporated a decay function (a leaky integrator) into the level estimator. Because the masker level (N0) that approached to the signal position should be
decayed drastically in the forward masking (B and C in Fig. 1), whereas the masker level was constant at the signal position in the simultaneous masking (A in Fig. 1). Thus, the reduction of the masker levels under time conditions B and C were 16.3 dB and 42.0 dB by the decay function. These values were, then, used in the power spectrum model. The parameters were optimized by minimizing the root mean square (rms) error between the masked thresholds and the predicted thresholds.
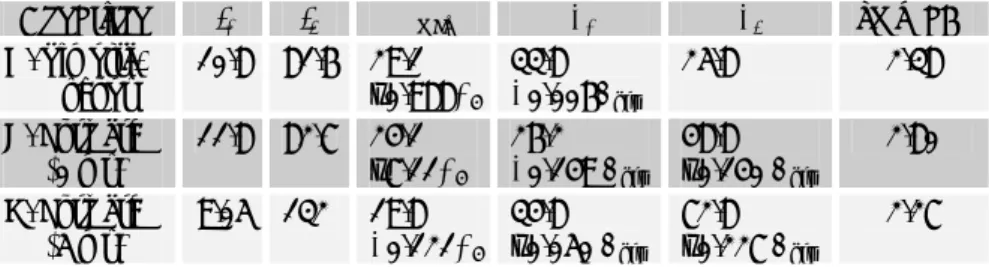
The optimized values for the five parameters of the parallel roex auditory filters and the rms errors, fitted to masking data corrected under the three time conditions, are shown in Table 1. The thresholds predicted using the parallel roex filter are plotted in Fig. 2 (solid lines for circles, dashed lines for ◄s, and dotted lines for ►s). The shapes of the derived filters centered at the signal frequencies of 0.5, 1.0, 2.0, and 4.0 kHz are plotted in Fig. 4 as a function of the signal level (10 and 30 dB SL). All the parallel roex filters can be excellently fitted to the simultaneous and forward masking data. Under the three time conditions, we found that the skirts of filters on the higher side for B and C are somewhat steeper than those of A. However, the tail slopes on the lower side of B and C are somewhat shallower than those of A. Remaining lower notched-noise components may affect this.
Condition tl tu Gmax pl pu rms (dB) A. Simulta- neous 10.8 81.6 29.1 –0.988Ef 33.8 +0.006Pprx 25.8 2.38 B. Forward (0 ms) 11.8 82.7 24.1 –7.11Ef 26.2 +0.149 Pprx 48.8 –0.140 Pprx 2.80 C. Forward (5 ms) 9.05 132 19.8 +0.121Ef 34.8 –0.050 Pprx 72.8 –0.227 Pprx 2.27
The mean equivalent rectangular bandwidth (ERB)s of the derived auditory filter shape as shown in Fig. 4 under the three conditions are shown in Table 2. The results show that the tuning of the derived filter using forward masking (B and C) is somewhat sharper than that using simultaneous masking (A). The ratios of ERBN (Glasberg and Moore 1990) to the ERBs in C for 0.5–4.0 kHz are 1.30, 1.37, 138, and 1.38. The tuning of the derived filter from forward masking have became sharper as the signal frequency was increased and/or the signal was delayed (A, B, and C). In addition, when the signal level was increased in dB SL, the ERBs estimated from the forward masking data are still sharper.
5 Conclusions
We estimated filter tuning using both simultaneous and forward masking with a notched-noise masker as functions of signal frequencies (0.5, 1.0, 2.0, and 4.0 kHz), signal levels (10, 20, and 30 dB SL), notched-noise conditions (five symmetric and
Fig. 4. Auditory filter shapes with center frequencies between 0.5 and 4.0 kHz,
derived from mean threshold data in three masking experiments (A, B, and C).
Condition \ fc (Hz) 500 1000 2000 4000
ERBN (Glasberg and Moore 1990) 79 133 241 456
A. Simultaneous masking 81 136 248 471
B. Forward masking (no silence) 66 112 204 392
C. Forward masking (5 ms delay) 61 97 175 330
four asymmetric), and the time conditions (A, B, and C in Fig. 1). Auditory filter shapes were derived under these conditions using the parallel roex filter.
The results suggest that the tunings of the auditory filters derived from the forward masking data were considerably sharper than those derived from the simultaneous masking data. The tunings of the auditory filters became much sharper as the center frequency was increased (ratios of 1.30 to 1.38). However, the difference between the tunings of the auditory filters at lower center frequencies in using both maskings tended to be smaller than that at higher center frequencies. It may be affected by remaining effects of suppression due to the decayed lower notched-noise components below the signal frequency.
Acknowledgments
This work was supported by special coordination funds for promoting science and technology (supporting young researchers with fixed-term appointments).
References
Baker, R. J. and Rosen, S. (2006) Auditory filter nonlinearity across frequency using simultaneous notched-noise masking. J. Acoust. Soc. Am. 119, 454-462.
Glasberg, B. R. and Moore, B. C. J. (1982) Auditory filter shapes in forward masking as a function of level. J. Acoust. Soc. Am., 71, 946-949.
Glasberg, B. R. and Moore, B. C. J. (1990) Derivation of auditory filter shapes from notched-noise data. Hear. Res., 47, 103-138.
Glasberg, B. R. and Moore, B. C. J. (2000) Frequency selectivity as a function of level and frequency measured with uniformly exciting noise. J. Acoust. Soc. Aml, 108, 2318-2328. Heinz, M. G., Colburn, H. S., and Carney, L. H. (2002) Quantifying the implications of nonlinear cochlear tuning for auditory filter estimates. J. Acoust. Soc. Am., 111, 996-1101.
Levitt, H. (1970) Transformed up-down methods in psychoacoustics. J. Acoust. Soc. Am.,
49, 467-477.
Moore, B. C. J. and Glasberg, B. R. (1978) Psychophysical tuning curves measured in simultaneous and forward masking. J. Acoust. Soc. Am., 63, 524-532.
Oxenham, A. J. and Shera, C. A. (2003) Estimates of human cochlear tuning at low levels using forward and simultaneous masking. J. Assoc. Res. Otolaryngol., 4, 541-554. Patterson, R. D. and Nimmo-Smith, I. (1980) Off-frequency listening and auditory filter
asymmetry. J. Acoust. Soc. Am. 67, 229-245.
Rosen S. and Baker, R. J. (1994) Characterising auditory filter nonlinearity. Hear. Res. 73, 231-243.
Unoki, M. and Tan, C.-T. (2005) Estimates of auditory filter shape using simultaneous and forward notched-noise masking. Forum Acusticum Budapest, 1497-1502.
Unoki, M., Irino, T., Glasberg, B. R., Moore, B. J. C., and Patterson, R. D. (2006) Comparison of the roex and gammachirp filters as representations of the auditory filter. J. Acoust. Soc. Am. (accepted).
Wojtczak, M. and Viemeister, N. F. (2004) Psychophysical response growth under suppression, Auditory signal processing: Physiology, Psychoacoustics, and Models. Springer-Verlag, 67-74.