大洋州地域廃棄物管理改善支援プロジェクト(廃棄物管理B、F)(その2) 独立行政法人国際協力機構
プロジェクト完了報告書 添付資料7.2.1 キリバス クリーンスクールプログラムレポート 国際航業株式会社
261 7.2 キリバス国
7.2.1 キリバス クリーンスクールプログラムレポート
a. Clean School Program report 2014
大洋州地域廃棄物管理改善支援プロジェクト(廃棄物管理B、F)(その2) 独立行政法人国際協力機構
プロジェクト完了報告書 添付資料7.2.1 キリバス クリーンスクールプログラムレポート 国際航業株式会社
263
大洋州地域廃棄物管理改善支援プロジェクト(廃棄物管理B、F)(その2) 独立行政法人国際協力機構
プロジェクト完了報告書 添付資料7.2.1 キリバス クリーンスクールプログラムレポート 国際航業株式会社
265
大洋州地域廃棄物管理改善支援プロジェクト(廃棄物管理B、F)(その2) 独立行政法人国際協力機構
プロジェクト完了報告書 添付資料7.2.1 キリバス クリーンスクールプログラムレポート 国際航業株式会社
267
プロジェクト完了報告書 添付資料7.2.1 キリバス クリーンスクールプログラムレポート b. Clean School Program report 2015
大洋州地域廃棄物管理改善支援プロジェクト(廃棄物管理B、F)(その2) 独立行政法人国際協力機構
プロジェクト完了報告書 添付資料7.2.1 キリバス クリーンスクールプログラムレポート 国際航業株式会社
269
大洋州地域廃棄物管理改善支援プロジェクト(廃棄物管理B、F)(その2) 独立行政法人国際協力機構
プロジェクト完了報告書 添付資料7.2.1 キリバス クリーンスクールプログラムレポート 国際航業株式会社
271
大洋州地域廃棄物管理改善支援プロジェクト(廃棄物管理B、F)(その2) 独立行政法人国際協力機構
プロジェクト完了報告書 添付資料7.2.1 キリバス クリーンスクールプログラムレポート 国際航業株式会社
273
大洋州地域廃棄物管理改善支援プロジェクト(廃棄物管理B、F)(その2) 独立行政法人国際協力機構
プロジェクト完了報告書 添付資料7.2.1 キリバス クリーンスクールプログラムレポート 国際航業株式会社
275
プロジェクト完了報告書 添付資料7.2.2 ベシオ町での有機ごみリサイクル促進用啓発教材 7.2.2 ベシオ町での有機ごみリサイクル促進用啓発教材 ベシオ町役場玄関に展示 ベシオでの倒木分別収集紹介 ベシオ処分場でのシュレッダー運転と木質チップ 紹介 薪の販売促進用ポスター チェーンソーレンタル宣伝用ポスター
大洋州地域廃棄物管理改善支援プロジェクト(廃棄物管理B、F)(その2) 独立行政法人国際協力機構
プロジェクト完了報告書 添付資料7.2.4 第3回意識調査結果 国際航業株式会社
277 7.2.4 第3回意識調査結果
Result of Opinion Survey in 2015
1. Outline of the Survey 1.1 Purpose
The opinion survey in 2015 is the third survey conducted during the project period. The first and second surveys were conducted in 2011 and 2013 respectively.
The purposes of three surveys are summarized below.
To estimate the change in number of people who understand compost and use it for vegetable growing, in order to evaluate the effect of the project
To know the changes in awareness and understanding of solid waste management in South Tarawa during the project period
To check the changes in people’s behavior in the field of solid waste management including 3Rs
1.2 Survey Method
The opinion survey was conducted based on a set of questionnaire sheets. The sample numbers of the three surveys are shown below.
Betio Town Council (BTC)
Teinainano Urban
Council (TUC) Total
2011 69 135 204
2013 49 111 160
1025 48 102 150
1.3 Items of Questions
The questionnaire contains the following questions. In order to know the actual level of understanding, questions for oral answers were included as many as possible.
Problems caused by improper waste management Waste generation and treatment of waste at home Gardening and compost
Waste collection service and discharge method Recycling activities
2. Preparation Work
The following preparation work was implemented.
2.1 Selection of interviewers
Three interviewers were selected based on the introductions by people who worked for the project before.
2.2 Preparation of sampling
The following documents and materials were collected in order to decide a sampling method.
Report on the Kiribati 2010 Census of Population and Housing, Volume 1: Basic information and tables
Report on the Kiribati 2010 Census of Population and Housing, Volume 2: Analytical report
プロジェクト完了報告書 添付資料7.2.4 第3回意識調査結果
2005 Census of Population, Volume 1: Basic information and tables 2005Census, Volume 2: Analytical report
Analysis of the 2006 Household Income and Expenditure Survey Digital map (South Tarawa)
The digital map was made more than 10 years ago and was modified according to google map and field survey.
The target of the survey was the whole area of South Tarawa, and samples were selected from the following villages, considering the income level.
Sample number TUC Bairiki 9 Bikenibeu 42 Causeway 3 Eita 18 Nawerewere 3 Teaoraereke 18 Temaiku 9 sub total 102 BTC Betio 48 sub total 48 Total 150
The target households were selected randomly by interviewers at the time of interview survey, according to a rule, selecting every 4th house along the designated streets on the map.
The number of samples is limited. In addition, due to the lack of sampling tools such as resident’s ledger and detailed housing maps, it is difficult to properly conduct a random sampling. As a result, there could be a certain level of errors, but it is still possible to see some kinds of trends in the past 5 years.
2.3 Preparation of questionnaire sheet
The draft of questionnaire in English was prepared by J-PRISM expert based on the questionnaire sheet used for the previous survey in 2013, and modified based on the opinions and comments from CPs. It was finalized based on the result of the mock interview during the training.
2.4 Training
Training was arranged for three interviewers on May 20, in order to show them the purpose and methods of the survey.
3. Implementation
3.1 Implementation of the survey
The survey started on May 22 and continued until June 3. The additional survey was conducted on June 4, in order to clarify the answers to some questions at Temaiku and Causeway. Interviewers were requested to randomly select samples according to the area maps.
大洋州地域廃棄物管理改善支援プロジェクト(廃棄物管理B、F)(その2) 独立行政法人国際協力機構
プロジェクト完了報告書 添付資料7.2.4 第3回意識調査結果 国際航業株式会社
279
Sex BTC TUC total
Count % Count % Count %
Female 16 33% 34 33% 50 33%
Male 32 67% 68 67% 100 67%
total 48 100% 102 100% 150 100%
Age BTC TUC total
Count % Count % Count %
18 – 24 years 6 13% 7 7% 13 9% 25 – 29 years 9 19% 23 23% 32 21% 30 – 34 years 8 17% 16 16% 24 16% 35 – 39 years 5 10% 13 13% 18 12% 40 – 44 years 4 8% 17 17% 21 14% 45 – 49 years 6 13% 11 11% 17 11% 50 – 54 years 3 6% 7 7% 10 7% 55 – 59 years 1 2% 4 4% 5 3% 60 – 64 years 4 8% 4 4% 8 5% over 65 years 2 4% 0 0% 2 1% total 48 100% 102 100% 150 100%
the last grade of completed formal education
BTC TUC total Count % Count % Count %
No formal schooling 1 2% 4 4% 5 3%
Some primary 4 8% 3 3% 7 5%
Completed primary school 3 6% 10 10% 13 9%
Some secondary 9 19% 8 8% 17 11%
Completed secondary school 22 46% 58 57% 80 53%
Technical/Vocational 3 6% 6 6% 9 6% University 2 4% 2 2% 4 3% Post Graduate 1 2% 4 4% 5 3% Do not know 1 2% 5 5% 6 4% Refused 2 4% 2 2% 4 3% Total 48 100% 102 100% 150 100%
Frequency of getting news from newspaper, radio and TV
newspaper radio TV Never 8 10 146 rarely 3 9 2 sometimes 115 79 1 every day 24 52 1 total 150 150 150
Did you hear the radio ad, promoting waste separation?
BTC TUC total Count % Count % Count %
Yes 31 65% 78 76% 109 73%
No 17 35% 24 24% 41 27%
total 48 100% 102 100% 150 100%
Average monthly utility cost
Electricity Telephone Cooking gas/kerosene
Number of respondent to answer Average monthly payment Number of respondent to answer Average monthly payment Number of respondent to answer Average monthly payment BTC 22 $52.3 5 $12.0 33 $30.7 TUC 35 $61.5 7 $25.7 41 $28.9 total 57 $57.9 12 $20.0 74 $29.7 (367)
プロジェクト完了報告書 添付資料7.2.4 第3回意識調査結果 4.2 Environmental awareness
In general, it can be estimated that more people recognized problems caused by improper solid waste management in the past 5 years.
Q1a In South Tawara, are there any problems caused by improper waste management?
2011 2013 2015
Count % Count % Count %
Yes 141 69% 127 79% 149 99%
No 6 3% 17 11% 1 1%
I don't know 57 28% 15 9% 0 0%
Total 204 100% 159 100% 150 100%
Q1b In South Tarawa, what kinds of problems are there now? (Check all answers you observe.)
2013 2015
Count % Count %
A lot of wastes are scattered on the street, beaches, and in the living environment. 121 95% 149 100% A lot of wastes are dumped illegally along the beach. 110 87% 148 99% Wastes scattered on the street are scavenged by animals. 56 44% 147 99% Wastes left on the street attract insects and rodents. 53 42% 148 99% Wastes left on the street cause offensive odor. 54 43% 146 98%
Dumped wastes in the beach pollute water 51 40% 147 99%
Wastes are scattered around the garbage container 50 39% 138 93%
Landfill sites are not managed well. 29 23% 144 97%
Others 1 1% 1 1%
Base: 127 (2013), 149 (2015) Q1c What is the most serious problem?
2013 2015 Count Count Count % A lot of wastes are scattered on the street, beaches, and in the living environment. 36 28% 20 13% A lot of waste are dumped illegally along the beach. 50 39% 43 29% Wastes scattered on the street are scavenged by animals. 7 6% 12 8% Wastes left on the street attract insects and rodents. 3 2% 18 12% Wastes left on the street cause offensive odor. 6 5% 32 21%
Dumped wastes in the beach pollute water 13 10% 9 6%
Wastes are scattered around the garbage container 9 7% 5 3%
Landfill sites are not managed well. 1 1% 7 5%
no response 2 2% 3 2%
Base: 127 (2013), 149 (2015)
Q2 Do you know where is your waste brought? If yes, where it is? The percentage of respondents who answered correctly
2013 2015
Count % Count %
BTC 42 86% 36 75%
TUC 58 52% 74 73%
The increase in the percentage of correct answers in TUC shows that more people recognized the newest disposal site in Bikenibeu.
4.3 Solid Waste Management at home
More than 80% of the respondents feed kitchen waste for pig, while around 40% discharge fallen leaves for collection services.
大洋州地域廃棄物管理改善支援プロジェクト(廃棄物管理B、F)(その2) 独立行政法人国際協力機構 プロジェクト完了報告書 添付資料7.2.4 第3回意識調査結果 国際航業株式会社 281 burying 8 17% 6 6% 14 9% burning 1 1% 1 1% Base: 47 (BTC), 101 (TUC)
Q5a Generation Amount of Green Waste per Week (by rice bags)
BTC TUC total
average number of rice bags 4.6 5.1 5.0
Base: 47 (BTC), 101 (TUC)
Q5b Usually how do you treat green waste?
BTC TUC total Count % Count % Count % being collected by a collection vehicle 22 46% 41 40% 63 42%
composting 10 21% 17 17% 26 17%
burying 15 31% 51 50% 66 44%
burning 7 15% 56 55% 63 42%
others 1 2% 3 3% 4 3%
Others: bring by our truck with business waste keep leaves in a drum
throw away on the beach 4.4 Gardening and compost
Between 20% and 30% of the respondents answered that they knew compost at the three surveys, but according to the result of questions for oral answers, many of them actually did not understand compost well. Among those who answered that they use compost, it can be assumed that some of them actually used black soil, which is mixed sand with pig manure, not compost.
Q4b Do you know compost?
2011 2013 2015
Count % Count % Count %
Yes 69 34% 47 30% 31 21%
I head it but I do not know what it is 100 49% 71 45% 81 54%
I never heard it. 35 17% 41 26% 38 25%
total 204 100% 159 100% 150 100%
Q22 Do you grow vegetables and/or flowers at your garden?
2011 2013 2015
Count % Count % Count %
Yes, I do. 71 35% 48 30% 70 47%
No, but I am interested. 4 2% 7 4% 3 2%
No 125 61% 101 63% 76 51%
no response 4 2% 4 3% 1 1%
Total 204 100% 160 100% 150 100%
At the third survey, banana, bread fruit, and coconut cultivation is included in the activities of vegetable growing, and this resulted in the increase in the share of the respondents who answered yes.
Q24 What kinds of vegetables do you grow?
BTC TUC total Count % Count % Count %
chinese cabbage 8 28% 22 54% 30 43% tomato 2 7% 8 20% 10 14% cucumber 1 3% 5 12% 6 9% capsicum 2 7% 3 7% 5 7% eggplant 1 3% 1 2% 2 3% pumpkin 7 24% 8 20% 15 21% powpow 7 24% 10 24% 17 24% banana 8 28% 15 37% 23 33% cassava 13 45% 11 27% 24 34% kumara 2 7% 9 22% 11 16% bean 2 7% 0 0% 2 3% Bread fruit 5 17% 15 37% 20 29% coconut 1 3% 3 7% 4 6% Base: 29 (BTC), 41 (TUC) (369)
プロジェクト完了報告書 添付資料7.2.4 第3回意識調査結果 Q26 Do you use compost?
2013 2015
Count % Count %
Yes, I am now using it 18 38% 25 35%
I used it but now not using 2 4% 2 3%
I never use it 27 56% 44 62%
no response 1 2%
48 100% 71 100%
Base: 48 (2013), 71 (2015)
The proportions of the respondents using composts now to the whole respondents at the survey in 2011 and 2015 are 11% and 17% respectively. Even though there could be a relatively large error, but it can be said that more than 5% of people in South Tarawa use compost for vegetable growing.
How do you get compost
BTC TUC total Count % Count % Count %
make by myself 7 88% 13 68% 20 74%
get from others 1 13% 4 21% 5 19%
Buy 2 11% 2 7%
Total 8 100% 19 100% 27 100%
Base: 8 (BTC), 19 (TUC), 27 (Total)
Even though 20 respondents answered that they made compost by myself, some of them made black soil, based on their answers to question, how to make compost.
4.5 Recycling (Kaoki Mange)
In Betio, the share of the respondents participating in the Kaoki Mange program increased from 30.8% in 2011 to 68.6% in 2015. The Kaoki Mange program is more active in Betio, because it is possible to sell recyclables at any time in Betio, while three places which accept recyclables in TUC are open only once a week.
Q18. Do you separate recyclables from other waste and sell them to recyclers?
BTC TUC total 2011
Count % Count % Count % Count %
Yes 33 69% 43 42% 76 51% 72 35%
No 15 31% 59 58% 74 49% 126 62%
No response 0 0% 0 0% 0 0% 6 3%
total 48 100% 102 100% 150 100% 204 100%
Q19 Why do you separate and sell them?
BTC TUC total
Count % Count % Count %
Recycling would reduce the amount of waste to
landfill 1 3% 1 2% 2 3%
Recycling would help to protect the environment 16 48% 14 33% 30 39% Recycling would earn you some extra money 30 91% 42 98% 72 95% Base: 33 (BTC), 43 (TUC), 76 (Total)
Q20 The number of respondents who separate and sell the following items
BTC TUC Total
大洋州地域廃棄物管理改善支援プロジェクト(廃棄物管理B、F)(その2) 独立行政法人国際協力機構
プロジェクト完了報告書 添付資料7.2.4 第3回意識調査結果 国際航業株式会社
283
Q21 Why don’t you separate recyclable waste such as paper, bottles, and metals from other waste?
BTC TUC total Count % Count % Count %
It is inconvenient or difficult 8 53% 41 69% 49 66%
It would take too much time 4 27% 11 19% 15 20%
The need/benefit of recycling are not clear 2 13% 17 29% 19 26%
There are no recycling systems 0 0% 0 0% 0 0%
Base: 15 (BTC), 59 (TUC), 74 (Total)
4.6 Collection Services in South Tarawa
Since the start of Green Bag Collection Service in 2012, there are two types of collection services, Council Collection Service and Green Bag Collection service, and the frequency of each collection service is once a week.
(1) Recognition of two collection services in South Tarawa
At first, the respondents were asked to mention the name(s) and provider(s) of collection services available in South Tarawa. 82 respondents gave Boboto Kiribati (Council collection service) as an example, while 105 respondents mentioned Green Bag Collection Service.
Regarding the service providers, 90% of respondents who mentioned the council collection service knew that their council, either BTC or TUC, was a service provider, while few respondents knew a responsible organization of Green Bag Collection.
Who provide collection services in South Tarawa? (1) Provider of Boboto Kiribati (Council Collection Service)
BTC TUC total Count % Count % Count %
Council 40 95% 34 85% 74 90%
don't know 2 5% 4 10% 8 10%
No reply 2 5% 2
total 42 100% 40 100% 82 100%
(2) Provider of Green Bag Collection Service
BTC TUC total Count % Count % Count %
Council 0 0% 2 2% 2 2%
FSPK 0 0% 3 3% 3 3%
Kiribati government 0 0% 3 3% 3 3%
Green bag company* 3 25% 30 32% 33 31%
Moel 4 33% 7 8% 11 10%
New Zealand 0 0% 12 13% 12 11%
don't know 5 42% 30 32% 35 33%
no reply 0 0% 6 6% 6 6%
total 12 100% 93 100% 105 100%
* 33 respondents thought that a company, which they did not know well, was a responsible organization.
(2) Council Collection Service
The first question in this section is if there is a regular collection service or not. In TUC two-thirds of the respondents answered that the council did not correct their waste.
Q7a Does the council collection truck collect your waste regularly?
BTC TUC total 2013 Count % Count % Count % Count %
Yes 38 79% 33 32% 71 47% 130 81%
No 10 21% 69 68% 79 53% 29 18%
no response 0 0% 0 0 0 0 1 1%
total 48 100% 102 100% 150 100% 160 100% In villages of the eastern side of TUC, along with Eita, few respondents used the council collection service, as shown in the table below.
Q7a Does the council collection truck collect your waste regularly? The number of respondents by village in TUC
プロジェクト完了報告書 添付資料7.2.4 第3回意識調査結果
Village in TUC Yes No Total
Bairiki 7 2 9 Teaoraereke 5 13 18 Eita 1 17 18 Bikenibeu 20 22 42 Nawerewere 0 3 3 Causeway 0 3 3 Temaiku 0 9 9 Total 33 69 102
According to the result of the survey in 2013, around 80% of the respondents answered that they received the council collection service, but the percent decreased to 47% in 2015. Based on the comments on the council collection service, some respondents in villages in the eastern side of TUC and Eita gave up the council collection service and decided to use only the green bag collection service, because the frequency of the council collection service was too low, once a month or less. Among respondents who answered that there was a regular collection service by the Council, about 50% of them told that the frequency of the collection service was once a week, while 35% of them told that they received the collection service only once a month.
Q8Actually how often a collection vehicle come and pick up your waste?
BTC TUC total Count % Count % Count %
Twice a week 2 5% 2 6% 4 6%
Once a week 16 42% 18 55% 34 48%
Once every second week 0 0% 1 3% 1 1%
Once a month 15 39% 10 30% 25 35%
I do not know 4 11% 1 3% 5 7%
every second month 1 3% 0 0% 1 1%
no reply 0 0% 1 3% 1 1%
Total 38 100% 33 100% 71 100%
Note: BTC and TUC are supposed to provide a collection service once a week Evaluation of the council collection service
Punctuality BTC TUC total Quality BTC TUC total
very good 3 4 7 No left over of waste 14 20 34
Good 9 17 26 A little bit left over 15 10 25
not good so much 10 8 18 A lot of left over 9 3 12
not good at all 16 4 20
Total 38 33 71 total 38 33 71
(3) Green Bag Collection Service
About 90% of the respondents used the green bag collection service.
Q16 Do you use green bag collection?
BTC TUC total 2013
Count % Count % Count % Count %
Yes 45 94% 90 88% 135 90% 141 88%
no 2 4% 11 11% 13 9% 15 9%
no reply 1 2% 1 1% 2 1% 4 3%
大洋州地域廃棄物管理改善支援プロジェクト(廃棄物管理B、F)(その2) 独立行政法人国際協力機構
プロジェクト完了報告書 添付資料7.2.4 第3回意識調査結果 国際航業株式会社
285
Q16e How often do you use green bag collection service?
BTC TUC total Count % Count % Count %
every week 32 71% 65 71% 97 71%
every second week 7 16% 22 24% 29 21%
once a month 6 13% 4 4% 10 7%
Total 45 100% 91 100% 136 100%
Q16f the number of green bags used every month
BTC TUC Total
average 4.7 5.9 5.5
median 4 4 4
Q16f how much money do you spent for green bags every month BTC TUC Total
average AUD 0.9 AUD 1.2 AUD 1.1
median AUD 1.0 AUD 0.8 AUD 0.8
Almost all the respondents who used the green bag collection were satisfied with its service. Compared to the monthly utility cost, shown in the section 4.2, the monthly average cost of green bags is small and 90% of them thought the price of bags was reasonable.
How do you think about green bag collection (evaluation)?
Punctuality
Punctuality BTC TUC total
Count % Count % Count %
very good 24 53% 67 71% 91 65%
good 20 44% 26 27% 46 33%
not good so much 0 0% 0% 0%
not good at all 1 2% 1 1% 2 1%
no response 0 0% 1 1% 1 1%
total 45 100% 95 100% 140 100%
Quality
Quality BTC TUC total
Count % Count % Count %
No left over of waste 42 93% 90 95% 132 94%
A little bit left over 1 2% 1 1% 2 1%
A lot of left over 2 4% 3 3% 5 4%
no response 0 0% 1 1% 1 1%
total 45 100% 95 100% 140 100%
Fee
Total cost of green bags BTC TUC total
Count % Count % Count %
too expensive 4 9% 0% 4 3%
expensive 5 11% 1 1% 6 4%
reasonable 34 76% 92 97% 126 90%
Cheap 0 0% 0 0% 0 0%
プロジェクト完了報告書 添付資料7.2.4 第3回意識調査結果
no response 2 4% 2 2% 4 3%
total 45 100% 95 100% 140 100%
(4) Distinguish of Council Collection Service and Green Bag Collection Service
The survey in 2015 tried to know how much the respondents recognize the differences of the two collection services. The table below is the number of respondents who use/don’t used the council and green bag collection services.
Close to 10% of the respondents used neither the council collection service nor the green bag collection service. Many of them live on the Pacific Ocean side. More than a hald of the respondents in TUC used only the green bag collection service. According to the conversation with them, they were basically satisfied with the green bag collection service, but many of them wanted to increase the collection frequency from once a week to twice a week.
BTC TUC Total Count % Count % Count %
use both collections 38 79% 32 31% 70 47%
use only council collections 0 0% 1 1% 1 1%
use only green bag 7 15% 58 57% 65 43%
use no collection service 2 4% 11 11% 13 9%
no reply 1 2% 0 0% 1 1%
total 48 100% 102 100% 150 100%
The respondents were asked what kinds of waste are discharged for the council and green bag collection service respectively.
Q9 What do you discharge for the council collection? (Council Collection)
BTC TUC total Count % Count % Count %
kitchen waste 30 79% 25 76% 55 77%
plastic packages 36 95% 33 100% 69 97%
paper and newspaper. 29 76% 19 58% 48 68%
PET bottles 28 74% 28 85% 56 79% glass bottles 33 87% 32 97% 65 92% beer cans 8 21% 13 39% 21 30% tin cans 36 95% 32 97% 68 96% card boards 25 66% 18 55% 43 61% fallen leaves 20 53% 11 33% 31 44% branches 19 50% 11 33% 30 42% diapers 28 74% 26 79% 54 76% others 0 0% 0 0% 0 0%
Base: 38 (BTC), 33 (TUC), 71 (total)
What do you discharge for green bag collection?
BTC TUC total Count % Count % Count %
kitchen waste 31 69% 65 71% 96 71%
plastic packages 38 84% 90 99% 128 94%
paper and newspaper. 22 49% 43 47% 65 48%
PET bottles 26 58% 63 69% 89 65%
glass bottles 34 76% 79 87% 113 83%
beer cans 4 9% 34 37% 38 28%
大洋州地域廃棄物管理改善支援プロジェクト(廃棄物管理B、F)(その2) 独立行政法人国際協力機構
プロジェクト完了報告書 添付資料7.2.4 第3回意識調査結果 国際航業株式会社
287
Those who use both collection service Those who use only green bag collection Council collection Green bag
collection Green bag collection
kitchen waste 55 52 44
plastic packages 68 64 63
paper and newspaper. 47 27 39
PET bottles 55 47 42 glass bottles 64 56 56 beer cans 21 16 22 tin cans 67 62 63 card boards 42 25 17 dead leaves 30 13 13 branches 29 12 9 diapers 54 69 65 others 0 0 Base: 70 Base: 65
As a whole, these respondents used both the council and green bag collection services in order to discharge rubbish. (It seems that they don’t care much about the differences of the two collection services)
Less respondents discharge card board, dead leaves and branches in green bags. It’s partly result of the awareness activity. In addition, these types of waste tend to be bulky and to increase the number of necessary green bags, and this resulted in the disincentive for respondents to discharge for the green bag collection service.
The number of respondents who discharge beer can is small. It can be said that many of beer cans are collected and sold to Kaoki Mange program.
5. Findings and Conclusions
Findings
The findings of the survey are summarized below.
The share of respondents who recognized the problems caused by improper solid waste management in Kiribati increased in the past 5 years.
About 20% of respondents answered that they know compost, but based on the result of questions of oral answers, it can be said that some of them actually don’t know compost well.
The proportions of the respondents using composts now to the whole respondents at the survey in 2011 and 2015 are 11% and 17% respectively. Even though there could be a relatively large error, but it can be said that more than 5% of people in South Tarawa use compost for vegetable growing.
The Kaoki Mange program is more active in Betio, almost 70% of the respondents participated in the program, because it is possible to sell recyclables at any time in Betio, while three places which accept recyclables in TUC are open only once a week.
In TUC two-thirds of the respondents answered that there was no regular council collection service, and more than a half of the respondents used only green bag collection service.
There were still 10% of the respondents, who did not use any collection services.
90% of the respondents used the green bag collection service and most of the green bag collection users were satisfied with its service, but few respondents knew who provided the collection service.
Conclusions
People’s awareness of solid waste management in South Tarawa increased in the past 5 years. It is important to make more people know what compost is, in order to promote compost in
Kiribati. Under the new school curriculum, compost and composting is one of the new topics in Environment Science for Year 5 & 6, and this could resulted in the increase in the number of people, who make and use compost for their gardening in a near future.
Both the council collection service and green bag collection service are basically used as rubbish collection services. It can be said that the two collection services are redundant.
Since the councils could not provide a satisfactory level of the collection service for customers,
プロジェクト完了報告書 添付資料7.2.4 第3回意識調査結果
contracting out one rubbish collection service, combining the council and green bag collection services, could be an option for the South Tarawa in a future. (In this case, it is necessary to review the current collection fee and its fee collection system.)
The Councils could provide a green waste collection service once a month or so at each collection area in their towns. It is also possible for the councils to continue to provide a collection service for a large scale dischargers.
Interview Survey
Interview Survey
Aluminum cans in a green bag Leaves in a hole Vegetable garden Questionnaire
大洋州地域廃棄物管理改善支援プロジェクト(廃棄物管理B、F)(その2) 独立行政法人国際協力機構
プロジェクト完了報告書 添付資料7.2.4 第3回意識調査結果 国際航業株式会社
289
大洋州地域廃棄物管理改善支援プロジェクト(廃棄物管理B、F)(その2) 独立行政法人国際協力機構
プロジェクト完了報告書 添付資料7.2.4 第3回意識調査結果 国際航業株式会社
291
プロジェクト完了報告書 添付資料7.2.5 ごみ教育出張授業と社会科見学報告書
7.2.5 ごみ教育出張授業と社会科見学報告書
Report of Delivery Lecture and Field Trip to a Landfill and Recycling Sites
J-PRISM organized a trial of Field Trip to Nanikai Landfill in order to develop a program and educational materials of field trips in the field of waste education. The outline of the field trip is summarized below.
1. Outline
1) Targets and Destination of Field Trip
Target school: Abaunamoub Primary School Target students: Students of Year 4 (around 90)
Site Visits: Nanikai Landfill, Betio Town Council, and Material Recovery Facilities
2) Program
Date: November 10, 2015
Venue: Abaunamoub Primary School Schedule:
Time Activities Person in charge 8:15- 9:15 Lecture/Discussion at a classroom
Icebreaker: What’s waste? Lecture 1: Wastes in South Tarawa
ECD officers/Council officers
9:15 – 9:30 Moving to a landfill TUC will arrange Taiwan trucks 9:30 – 9:50 Site visit (Nanikai Landfill)
Lecture 2: Disposal site Management and three landfills in Tarawa
ECD officer (TUC officer)
9:50 – 10:10 Moving to Betio
10:10 – 10:30 10:30 – 10:50
Site visit (two recycling sites)
Betio Town Council (organic waste recycling)
MRF of Kaoki Mange (aluminum cans and PET bottles recycling)
BTC officer
Owner of the recycling company responsible for Kaoki Mange 10:50 – 11:10 Moving back to school
11:10 – 11:40 Q&A Refreshment 2. Contents of Lecture/Discussions 1. Icebreaker What’s Waste? 1) What’s Waste?
大洋州地域廃棄物管理改善支援プロジェクト(廃棄物管理B、F)(その2) 独立行政法人国際協力機構
プロジェクト完了報告書 添付資料7.2.5 ごみ教育出張授業と社会科見学報告書 国際航業株式会社
293 Procedures
1. To ask students to give examples of waste, thinking about daily life at home and school
2. To post illustrations of waste, which are mentioned by students, on the walls of the classroom
2) Definitions of Waste
Looking at illustrations of various types of wastes posted on the wall, try to divide them into several groups, according to the reasons why they became waste and define each group.
Examples
3) Categorization of Waste
Encourage students to categorize wastes, posted on the wall, according to the following categories.
Returning to soil or not (Organic or Inorganic) Recyclable or Non-recyclable
2. Lecture
Our Waste in South Tarawa
1) Current Situations of Solid Waste Management
To introduce basic data and information on Solid Waste Management in South Tarawa
To show the flow of waste, waste generation, storage, collection/illegal dumping/waste scattering to landfills
2) Problems
To show problems caused by improper solid waste management To think about countermeasures
プロジェクト完了報告書 添付資料7.2.5 ごみ教育出張授業と社会科見学報告書
3) Necessity of Waste Minimization
To show why waste minimization is necessary
To show examples of waste minimizations (3R related activities) To encourage schools and students to do waste minimizations To promote School Kaoki Mange
大洋州地域廃棄物管理改善支援プロジェクト(廃棄物管理B、F)(その2) 独立行政法人国際協力機構 プロジェクト完了報告書 添付資料7.2.5 ごみ教育出張授業と社会科見学報告書 国際航業株式会社 295 3. Lecture Waste Disposal in South Tarawa
1) What’s disposal treatment at landfill sites? Why we need landfill sites?
How to dispose of waste at landfill sites?
2) 3 disposal sites in South Tarawa
Introductions to 3 landfill sites in South Tarawa 3) Types of waste which accepted at landfill sites
プロジェクト完了報告書 添付資料7.2.5 ごみ教育出張授業と社会科見学報告書
3. Result
(1) Icebreaker, “What’s Waste”
Students were actively involved in the activities during the icebreaker. The result of categorization of wastes by students is shown below. The result shows that students well understood wastes and successfully categorized wastes into two groups, organic waste and inorganic waste, and later recyclables and unrecyclables.
大洋州地域廃棄物管理改善支援プロジェクト(廃棄物管理B、F)(その2) 独立行政法人国際協力機構
プロジェクト完了報告書 添付資料7.2.5 ごみ教育出張授業と社会科見学報告書 国際航業株式会社
297 Students were requested to
categorize each waste on the wall
Result of categorization (a group of inorganic waste)
Result of categorization (a group of recyclables)
(2) Lectures and Site Visit
An ECD officer explained about disposal site management at Nanikai
A BTC officer showed their organic waste recycling
activities at BTC office
BTC staff demonstrated a shredder operation
Head of recycling company, responsible for Kaoki Mange program, explained recycling activities
During the lectures and site visits, students were very active and got interested in solid waste management. It can be said that a field trip is good opportunity for students and teachers to get interested in issues of solid waste management in Tarawa and to consider starting 3R related activities, such as composting and Kaoki Mange, both at schools and home.
It is preferable for Ministry of Education to establish a cooperative relation with organizations concerned, such as ECD and councils, and to develop programs and educational materials of field visits in cooperation with these organizations.
大洋州地域廃棄物管理改善支援プロジェクト(廃棄物管理B、F)(その2) 独立行政法人国際協力機構
プロジェクト完了報告書 添付資料7.3.1 改善されたババウ処分場の運営マニュアル 国際航業株式会社
299 7.3 トンガ国
7.3.1 改善されたババウ処分場の運営マニュアル
The Operation Manual for Vava’u Rehabilitated Disposal Site
Oct. 2014, Ministry of Health, TONGA
1. Daily Operations
1.1 Regular staff meeting
In order to make sure a proper gate control and management of incoming waste, MoH Health Inspectors shall visit the dumpsite twice a week at least.
MoH Health Inspectors shall check the following matters with (a) care taker(s);
- Site conditions
- Operation work
- Working records
If only one care taker appointed, MoH Health Inspectors shall send a trained replacement during his absence.
1.2 Gate Control System
Receiving and inspecting waste are the most important parts of daily operations.
All incoming vehicles shall stop at entrance point by crossing bar, and a care taker shall follow the necessary procedures before opening the gate as shown below;
1.3 Information to be recorded:
It is important to collect information about the daily quantity and type of the waste in order to
improve daily operations and for the future planning of waste management. The following information should be recorded in the working record book:
Time of arrival
Type of waste (e.g., general waste, green/organic waste, bulky waste, etc) Generation source of waste (Neiafu, etc)
Quantity of waste (=Volume (on a load basis))
Source of waste (e.g., residential, commercial, industrial, port, etc) Vehicle type (e.g. dump truck, van, pick-up, etc)
Staff meeting with a care taker
Gate Control
プロジェクト完了報告書 添付資料7.3.1 改善されたババウ処分場の運営マニュアル
Recording in the office Working record book Opening the gate After recording, the gate is finally opened. Once the vehicles enter the site, gate should be closed.
1.4 Recycling station
All incoming vehicles are inspected what they are carrying at entrance. In order to reduce waste going to the disposal site, the driver is requested to separate Metals (UKAMEA) and/or Aluminum cans (KAPA), and to place them at the designed recycling station.
Signboard for recycling station at site Recycling station 1.5 Direction to the correct location for disposal
大洋州地域廃棄物管理改善支援プロジェクト(廃棄物管理B、F)(その2) 独立行政法人国際協力機構
プロジェクト完了報告書 添付資料7.3.1 改善されたババウ処分場の運営マニュアル 国際航業株式会社
301
1.7 Maintenance of the facility
Maintaining a clean, pleasant and secure the site is very important for maintaining a good image and good relationships with dump users and neighbors, and is also beneficial for workers. The following activities ensure the site is in a sanitary condition.
a. Killing unwanted weeds on the embankment
To avoid being bush at site, the embankment shall be kept clean by cutting grass. Landscaping works shall be carried out once a month for dry seasons and twice a month for rainy seasons.
b. Picking up scattered rubbish
Cutting grass on the embankment Changing of filtration materials Picking of scattered waste from surrounding area Scattered rubbish from the surrounding area of the gate and the administration office, outside of the embankment, on the access road and leachate treatment facility, must be picked up when needed (once a month at least). Recyclable items can be also taken to the recycling cages by care takers.
c. Cleaning of inside of the Office Clean sweep with broom and give the floor a mop when it becomes dirty.
Proper location for disposal (between embankment and leachate pipes)
Waste disposed on the access road (Need to avoid being this situation!)
Inside of the Office
プロジェクト完了報告書 添付資料7.3.1 改善されたババウ処分場の運営マニュアル 1.8 Close of the day
a. Meeting
The meeting should be held in case some matters or problems regarding the operation work, fire events, accidents, etc., occurred. Necessary arrangements should be made for the next day’s work.
b. Closing the gate
At the end of the operation work, the crossing bar shall be down and be locked using a key and chain.
2. Regular maintenance 2.1 Pushing of waste
MoH shall hire a Loader to push the disposed waste against the embankment every two months.
There are some options, so MoH shall choose the most cost-effective way. Frequency Equipment
(capacity) Unit cost Total cost for a year Option 1 Monthly Sinali’s loader
(2 ton)
TOP$100/hour 2 hour x 12 times a year = TOP$100 x 2 x 12 = TOP$2,400 Option 2 Monthly Hamani’s
loader (23 ton)
TOP$300/hour 2 hours x 6 times a year = TOP$300 x 2 x 6 = TOP$3,600 Option 3 Monthly Loader owned
by Min. of Infrastructure (20 ton)
TOP$142/hour (for machine) and TOP$40/hour (for operator)
2 hours x 6 times a year = TOP$182 (TOP$142 + TOP$40) x 2 x 6 = TOP$2,184
2.2 Soil covering (if possible)
After pushing, the heap is ideally covered by soil to prevent flies generation, smell and fire if soil, machines and budget are available.
As there is good quality soil available within the boundary of Kalaka disposal site, this should be used for covering. Store a reasonable quantity of soil near the working face in an unobtrusive location.
Rough indication of thickness of covering is 15 to 20cm for periodical cover. Using too much soil will use up the soil more quickly and more importantly will consume landfill leaving less space available for rubbish.
大洋州地域廃棄物管理改善支援プロジェクト(廃棄物管理B、F)(その2) 独立行政法人国際協力機構
プロジェクト完了報告書 添付資料7.3.1 改善されたババウ処分場の運営マニュアル 国際航業株式会社
303
After covering, side slope shall be made and compressed by using an excavator. 2.3 Maintenance of access road
The approach road shall always be kept in a good condition by checking for proper drainage, so that no puddles or mud is formed.
Limestone is purchased from private company (TOP$150/5ton), so will construct and maintain a good approach road.
Before paving a limestone, the cell base should be well-leveled. When the road is paved, consider the vertical interval and slope angle around the road, otherwise the road will be buried with mud in the event of heavy rains. The access road shall be kept free of puddles and mud, especially in the working area.
The above maintenance works should be carried outduring the rainy season.
Heap for drainage of rain water Leveling by loader Paving limestone 3. Finance plan for landfill management
MoH needs to secure necessary budget allocation shown below.
プロジェクト完了報告書 添付資料7.3.1 改善されたババウ処分場の運営マニュアル 4. Water quality monitoring
4.1 Background
Kalaka landfill has been rehabilitated, however, there has been still serious concerns, especially water pollution at lagoon area. In order to assess the level of pollution caused by Kalaka disposal site and nearby environment, water quality monitoring shall be carried out on
a quarterly basis, in collaboration with GEF-funded Integrated Water Coastal Management
(IWCM) Project (former IWRM Project).
4.2 Sampling points
The monitoring team collects water samples at six (6) sites of Kalaka, includes three (3) points from lagoon areas facing to Kalaka disposal site and each sample from three (3) leachate ponds.
4.3 Monitoring parameters
Water quality determines the ‘goodness’ of water for particular purposes. Water quality tests will give information about the health of the waterway. By testing water over a period of time, the changes in the quality of the water can be seen.
The primary water quality parameters selected for the testing are shown as below; Parameters
On-site tests Laboratory testing - Turbidity/Transparency - Ammonia
- Temperature - Nitrate
- pH - Phosphate
: Recycling station : Periphery banks : Crossing Bar : Drains : Office
: Boundary : Leachate pipe
: Leachate treatment facility
Sewage plant ④ ⑤ ⑥ ① ② ③
大洋州地域廃棄物管理改善支援プロジェクト(廃棄物管理B、F)(その2) 独立行政法人国際協力機構
プロジェクト完了報告書 添付資料7.3.1 改善されたババウ処分場の運営マニュアル 国際航業株式会社
305
Summary of monitoring parameters (source: IWCM report)
Parameter Instrument Expected Results
EC WPR-84 Water Quality Meter
Depth to Water Solinist
pH WP-84 Water quality Meter A ph range of 6.5 – 8 is optimal for freshwater. A range of 8 – 9 is optimal for estuarine and sea water. Temp DelAgua membrane filtration
kit/Solinist
Dissolved Oxygen Handhelp YSI Water Quality Meter
Estuaries 60 – 120 Marine 90 - 110 Turbidity DelAgua membrane filtration
kit Excellent = 10 NTU’s Fair 15-30 NTU’s Poor > 30 NTU’s Bacteria (faecal coliforms)
DelAgua membrane filtration kit
Saltwater 104 CFUs per 100 ml Fresh water 61 CFUs per 100 ml
Ammonia HACH Method – no guideline based on health; guideline based on odour and taste are 1.5 and 35mg/L respectively. Phosphate HACH Method As PO4 Low < 0.06
Medium 0.06 – 0.15 High > 0.15 – 0.45 Very High > 0.45 Total Nitrogen
/Nitrate
Hach Method Total N Low < 0.5 (2.2) Medium 0.5 – 1.0 (4.4) High > 1.0 – 3.0 (13.2) Very High > 3
Confirmation of monitoring procedures at site
Sampling from lagoon area next to
disposal site Sampling from leachate pond
Collected samples (left three (3) taken from lagoon area, right three
(3) taken from leachate ponds)
Testing at Laboratory established in MoH Vava’u Office
Testing of Faecal Coliform by MoH staff
プロジェクト完了報告書 添付資料7.3.1 改善されたババウ処分場の運営マニュアル 4.4 Reporting and countermeasures
The results of water quality monitoring shall be reported to the Vava’u Solid Waste Management Steering Committee.
Necessary countermeasures should be examined and taken if any negative results were found.
5. Monitoring Committee
As proposed in the Rehabilitation Plan of Kalaka final disposal site in Vava’u, which was finalized in Aug. 2012, Monitoring committee shall be established to make sure a proper dumpsite management system.
The committee will have the following duties;
The committee members shall visit the site to observe the environmental condition of the site and its surroundings every six months.
The committee shall be regularly reported based on the working records and the result of water monitoring.
The committee shall give a necessary advice and assistance immediately to any incident of effect on environment such as fire.
The committee members will be consisted of relevant Ministries, organizations and community representatives as follows (tentative).
① Governor of Vava’u (Chair of Vava’u Solid Waste Management Steering Committee) ② OIC of MEC
③ OIC of MoH Prince Nqu Hospital ④ OIC of Ministry of Infrastructure ⑤ OIC of Ministry of Finance ⑥ VEPA
Japanese Technical Cooperation Project
for Promotion of Regional Initiative
on Solid Waste Management in Pacific Islands (J-PRISM)
in Kingdom of Tonga
Garbage collection Plan in Vava’u
Incl. Pilot Project Plan
(Final draft)
April 2015
Ministry of Meteorology, Energy, Information, Disaster Management,
Environment, Climate Change and Communication (MEIDECC)
Ministry of Health
Ministry of Internal Affairs
Vava’u Solid Waste Management Steering Committee
307
Index
1
Background ... 5
2
Current Garbage Collection System in Vava’u ... 5
2.1
Waste flow ... 5
2.2
Storage/Discharge ... 5
a. Household waste ... 5 b. Commercial waste ... 6
2.3
Collection / Final disposal ... 6
a. Household waste ... 6 b. Commercial waste ... 7
2.4
Equipment for collection ... 7
3
Definition and Category of Waste ... 7
3.1
What is “Waste”? ... 8
3.2
What to do with each type of waste? ... 8
a. “Waste”to be self-disposed at home ... 8 b. “Waste” to be discharged to recycling containers/station which are placed in the community ... 9 c. “Waste” to be taken directly to GIO Recycling ... 11 d. “Waste” to be discharged to garbage collection service ... 11
4
Proposed garbage collection system ... 12
4.1
HOUSEHOLD WASTE ... 12
4.1.1 Background ... 12 a. Limited capacity of government (MoH) ... 12 b. Issues of garbage collection system in Tongatapu... 12 c. Lessons learnt from the past ... 12 d. Finance issues of outer islands ... 13 e. Strongly united community in outer islands ... 13 4.1.2 Outline of community-based garbage collection system ... 13 a. Target waste ... 13 b. Implementation unit (community unit) ... 13 c. Implementation procedure ... 14
4.2
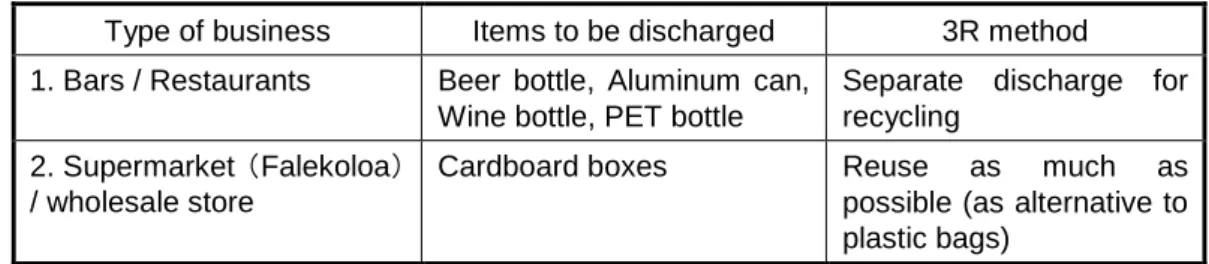
COMMERCIAL WASTE ... 24
4.2.1 Promote August Hoefts garbage collection service ... 24 4.2.2 Promote 3R practices ... 24 a. Target items ... 24
(397)
309 3
b. Cardboard boxes ... 24 c. Aluminum cans and tin cans ... 24 4.2.3 Awareness for Yacht waste ... 25
5
Pilot Project Plan ... 26
5.1
Objective ... 26
5.2
Period ... 26
5.3
Implementation procedure ... 26
5.3.1 Select pilot community ... 26
5.4
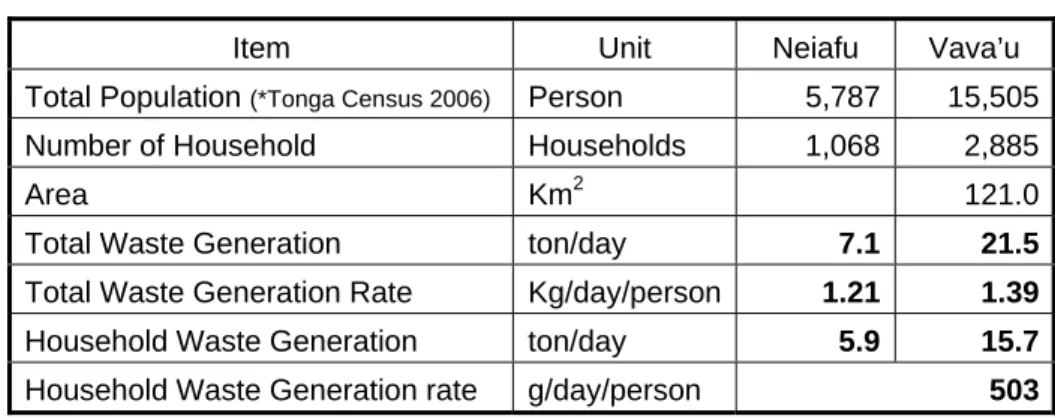
Estimated waste generation amount and waste composition ... 27
5.5
Establishment of Waste Management Committee ... 28
5.6
Planning with Waste Management Committee ... 28
5.7
Preparing for awareness materials (collection calendar) ... 28
5.8
Conduct awareness activities ... 29
a. Door-to-door visits ... 29 b. Community meeting ... 29
5.9
Start collection ... 29
a. Announcement ... 29 b. Collection ... 29
5.10
Conduct regular monitoring ... 29
6
Expansion Plan ... 31
ANNEX
1. Format of VEVE Committee List
2. Format of Hiko VEVE Plan
3. Format of Questionnaire Survey
1
Background
In order to achieve the vision of the Vava’u Solid Waste Management (SWM) Plan, which is to “Establish an effective Solid Waste Management system in Vava’u by the year 2021, in order to keep great Vava’u clean and healthy”, a garbage collection system with introduction of waste minimization practices should be established.
2
Current Garbage Collection System in Vava’u
2.1 Waste flow
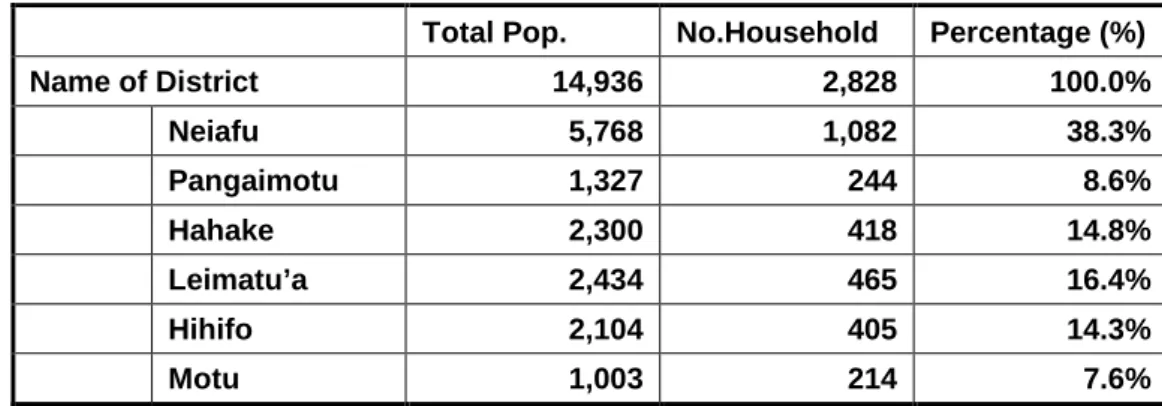
Based on the baseline survey, which was carried out by J-PRISM Project in FY 2011, a waste flow in Neiafu Distinct is drawn as shown in Figure 1. All the figures shown were estimated based on the average amount between on-season and off-season.
Figure 1: Waste stream diagram of Neiafu District
2.2 Storage/Discharge a. Household waste
Burning, burying and dumping waste in the bush are common methods for households in Vava’u due to lack of garbage collection service. Most kitchen waste is used for feeding pigs and dogs. Some people carry out composting but in a traditional and natural way such as covering on their plantation farm. A few communities, namely Toula and Leimatu’a, have placed rubbish bins on streets in their area on their own initiative.
Generation 7.0 ton/day (100%) Feeding pigs/dogs 0.84 ton/day (12.3%) Recycling (Gio) 0.3 ton/day (4.4%) Final disposal (Kalaka) Recycling at final disposal site 0.04 ton/day (0.7%) Composting 0.10 ton/day (1.5%) Burn/Bury/Dump in bush Haulage 1.97 ton/day (28.1%) 3.8 ton/day (53.8%) 1.93 ton/day (27.4%) Generation 7.0 ton/day (100%) Feeding pigs/dogs 0.84 ton/day (12.3%) Recycling (Gio) 0.3 ton/day (4.4%) Final disposal (Kalaka) Recycling at final disposal site 0.04 ton/day (0.7%) Composting 0.10 ton/day (1.5%) Burn/Bury/Dump in bush Haulage 1.97 ton/day (28.1%) 3.8 ton/day (53.8%) 1.93 ton/day (27.4%) (399) 311 5
Open burning in the backyard Rubbish bin placed in Toula Rubbish cage placed in Leimatu’a
b. Commercial waste
Most of businesses have own yard or space to storage for their waste. Some businesses store their waste separately by waste type.
Storage yard at Bar and restaurant (incl. yacht waste) Storage place at wholesale store
2.3 Collection / Final disposal a. Household waste
There is no garbage collection system for households, therefore, residents have no other choice than to haulage their waste to the final disposal site (Kalaka) by themselves.
Toula community in Neiafu District, has placed rubbish bins on streets in the area, hires a truck by community and empties bins every Saturday. The operation cost is paid for primarily by foreign residents living in the area.
Also, Kava Club youth group of Leimatu’a community has taken initiative to carry out a garbage collection services. They also collect metals separately for recycling purpose. This activity was not conducted irregularly, but undertaken on their own initiative. There are some possibilities to apply similar system to other communities in Vava’u.
b. Commercial waste
One private company has provided a garbage collection service on individualized contract basis. Service users are mainly business establishments like bars, restaurants and some foreign residents. As of June 2012, around 14 businesses are using the service. Collection fee is charged from TOP$30 - TOP$350 per month that depends on the frequency of collection, the amount of garbage discharged and the location of collection point.
Ministry of Health (MoH) is collecting general waste discharged from the Nqu hospital and their staff compounds. MCTLA (Ministry of Commerce, Tourism and Labor) placed the bins in 2014, and different government departments and businesses are responsible for emptying the bins.
Collection of commercial waste by private company
MoH workers collecting waste from Nqu hospital staff
compounds
Bins placed by MCTLA
2.4 Equipment for collection
The trucks as shown below are currently utilized for garbage collection in Vava’u. The 3.0 ton - truck owned by MoH Vava’u is often broken down. The private company owns a 2.5 ton – truck and used for collection of commercial waste, however, the compaction function of truck is out of order.
Truck (3.0ton) owned by MoH Vava’u
Truck (2.5 ton) owned by private company
3
Definition and Category of Waste
Vava’u residents are not used to discharging their waste due to lack of garbage collection system in place, so they might not clearly understand (1) “what waste is” and (2) “what to do with each type of waste”. Definition of “Waste” should be clearly defined and be aware by Vava’u residents through a series of awareness activities.
(401)
313 7
“VEVE” means “waste” in Tongan language, and is defined under the Health Act 1992 as “‘Oku kau ki ai ‘a e veve (garbage), veve faka’api, melenga, moveve pea mo e veve mei ha ‘api ngau e”.
In English, the above means “waste will include garbage, household and commercial waste , which is unwanted leftover from consumption and production process, and discharged output which has no marketable value.
3.2 What to do with each type of waste?
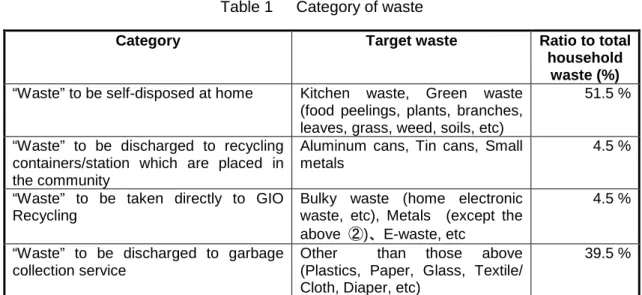
After clarifying the definition of “Waste”, Vava’u residents also need to fully understand that waste can be divided into the following four (4) categories;
Table 1 Category of waste
Category Target waste Ratio to total
household waste (%)
“Waste” to be self-disposed at home Kitchen waste, Green waste (food peelings, plants, branches, leaves, grass, weed, soils, etc)
51.5 %
“Waste” to be discharged to recycling containers/station which are placed in the community
Aluminum cans, Tin cans, Small metals
4.5 %
“Waste” to be taken directly to GIO Recycling
Bulky waste (home electronic waste, etc), Metals (except the above ②)、E-waste, etc
4.5 %
“Waste” to be discharged to garbage collection service
Other than those above (Plastics, Paper, Glass, Textile/ Cloth, Diaper, etc)
39.5 %
a. “Waste”to be self-disposed at home
Kitchen waste and Green waste should be discouraged to discharge to the garbage collection. These waste accounts for approx. 50% of total generation amount of household waste, so proper self-disposal practices such as composting should be promoted, that contribute much to reduce waste amount to be collected and to be disposed at dumpsite. Garden 25% Kitchen 24% Paper 6% Plastic 13% Glasses 6% Metal 13% Textile/Ceramic 3% Others 10% Garden 25% Kitchen 24% Paper 6% Plastic 13% Glasses 6% Metal 13% Textile/Ceramic 3% Others 10%
as taro pealing can be taken to the backyard to make compost mixing with green waste.
Typical kitchen waste Feeding pigs
a.2 Green waste
Green waste is discouraged to dispose at Kalaka landfill in order to prevent leachate generation. Green waste can be taken to the backyard to make a compost. Open burning of green waste mixing with other waste, especially plastics, is also discouraged to avoid harmful gas generation such as dioxin.
Green waste Composting at backyard
b. “Waste” to be discharged to recycling containers/station which are placed in the community
b.1 Target items
Target items which can be discharged to recycling containers/station, should meet the following requirements;
① Acceptable to the recycling company such as GIO Recycling ② Sufficient amount of items can be discharged
③ Small size can be fit to recycling containers/station
In Vava’u, Aluminum cans, Tin cans and small batteries will be mainly targeted.
b.2 Containers/Stations of recyclables collection
The following table shows some options of recycling container and station to be established in the community are shown below;
(403)
315 9
Type Plastic basket Iron cage Nylon sack Wire, Steel plate Cost $10 – 20 /bin $125 – 600 /cage $60 - $100 Adva ntage - Easily obtainable - Removable - People has already accustomed
to this for recycling - Adjustable size - Large capacity - Visually attaractive - Large capacity - Easy setting up Disad vanta ge - Lack of stability (easily movable by strong wind, etc) - To be stolen easily
- Expensive to procure - it gets rust easily
- Need to procure from Tongatapu or overseas
- Will take time to fill up
- To be easily mixed up with other waste as it’s not visible externally
- Need to find enough open space - Need to monitor to avoid mixing of other waste
b.3 Location and responsible management
The location of recycling containers/station and the responsible management strategy and function should be determined by community (see some options shown below). The recycling station should be placed at an easy-to-access place for all residents, i.e, community halls, churches, schools and Falekoloa (shops). Community halls and Falekoloa (shops) are the best location as the large amount of empty can is discharged.
Table 3 Location and responsibly body of recycling station
Location of recycling station Responsibly body
1. Community halls Community group (Town Officer, Kava club, etc)
2. Churches Pastor, Youth group, Women’s group 3. Schools “VEVE” (= Waste) Management Committee
which is established through Clean School Program
b.4 Operation procedure
Operation procedure for recycling station is as follows;
1) “VEVE” Committee, which is established in the community, will monitor each recycling station on a regular basis.
2) If the cages/containers become full with recyclable items, the Committee hauls them to the GIO Recycling on garbage collection days. GIO Recycling weighs them and pay money in accordance to the market price.
3) The Committee records the amount of recyclables collected and the amount of profits received.
4) The records are reported to the whole community through meetings on a regular basis. Apart from the above system, each household is encouraged to bring recyclable items to “GIO” directly.
c. “Waste” to be taken directly to GIO Recycling
Bulky waste like abandoned vehicles, refrigerators and iron roofing shall divert directly to the GIO Recycling as it will become obstacles for normal garbage collection. In case residents can’t take them directly to GIO Recycling by themselves, contact GIO Recycling for necessary arrangements.
d. “Waste” to be discharged to garbage collection service
Waste other than the above waste that includes “Plastics, Paper, Glass, Textile/ Cloth, Diaper, etc.
Bulky waste
(405)
317 11
The quantity and quality of waste generated from (1) households and (2) businesses are different therefore, the optimum garbage collection system should be examined in different ways. 4.1 HOUSEHOLD WASTE
4.1.1 Background
The following points were taken into consideration in examining optimum garbage collection system in Vava’u.
a. Limited capacity of government (MoH)
In Tonga, there are no local municipalities, so the national government has normally a small branch office in each main island. Under the Waste Management Act and Public Health Act No29 of 1992, Ministry of Health (MoH) has a responsibility for solid waste management (SWM) in outer islands groups, however, their technical, institutional and financial capacities are very limited. Only two health inspectors have been assigned to look after 15,000 population size of the Vava’u Islands. MoH Vava’u owns an old 3.0 ton open truck and uses it for collection of waste generated from hospital compounds, but has continuously faced mechanical issues. The MoH’s average annual budget for waste management in Vava’u is TOP$1,500 (≒US$900). The people of the Kingdom of Tonga do not have current obligations to pay a residence tax, including a waste levy, so that MoH’s budget is the only revenue for waste management in Vava’u.
b. Issues of garbage collection system in Tongatapu
In the capital of Tonga, Tongatapu, the Waste Authority Limited has provided commercial, industrial and residential waste collection services. Each household needs to pay $10 per month in exchange for specific bags to discharge waste. Only waste filled in specific bags are collected by the Authority on the collection days (once a week). The waste levy collected by households was supposed to cover the operation cost, however, the government has been forced to subsidy the cost as not all households pays (recovery rate is less than 50 %). The Waste Authority is expected to expand their service to the outer islands such as Vava’u in future, but their system needs to be firmly established in a sustainable way in Tongatapu first.
d. Finance issues of outer islands
MoH has the authority to impose a waste levy, however, Vava’u Islands are remote islands, so that all the monies collected from the people of Vava’u would be integrated into the general account of the MoH head office in the capital island, Tongatapu. This is one of the main difficulties to ensure appropriate budget allocation not only for Vava’u but for other outer islands in Tonga.
e. Strongly united community in outer islands
The households in Vava’u belong to a community group led by Town and District Officer according to the living area. These community groups are well-organized, united and implement various community activities such as clean-up activity. The expenses of these activities are normally covered by the community funds collected through a series of fundraising programs. Some community members have owned a 1.5 – 3.0 ton open dump truck, which can be used as garbage collection truck. In fact, some communities in Vava’u like Leimatu’a and Toula have already conducted a garbage collection system with community’s own initiative. Community itself must have the potential to implement a garbage collection by themselves, instead of relying on the government.
4.1.2 Outline of community-based garbage collection system
Taking the above conditions into consideration, community-based garbage collection system is an optimum system for Vava’u.
a. Target waste
Waste items except for kitchen waste, green waste, recyclables waste (metals). That includes plastics, papers, glasses, textile/cloth and diapers.
b. Implementation unit (community unit)
The community-based garbage collection is implemented by each town/village unit. Neiafu Town is divided to some divisions like Aloitalau, Vaipua, etc.
(407)
319 13