総 説
バイアスを可視化する
1 公益社団法人日本医療機能評価機構 2 東邦大学医学部 3 大船中央病院消化器・IBD センター 4東京女子医科大学医学部衛生学公衆衛生学(二)講座 モリザネ ト シ オ コ ジ マ ハ ラ ノ リ コ 森實 敏夫1∼3 ・小島原典子1,4 (受理 平成 29 年 12 月 13 日)Visualizing Bias Effects Toshio MORIZANE1∼3
and Noriko KOJIMAHARA1,4
1Japan Council for Quality Health Care 2Toho University School of Medicine
3Ofuna Chuo Hospital
4Department of Public Health, School of Medicine, Tokyo Women s Medical University
In systematic reviews, the evaluation of the risk of bias and indirectness on effect estimates is essential to as-sess the certainty of the body of evidence. A program in the programming language R was developed to execute a meta-analysis adjusting for the effects of biases after assessing bias magnitudes, directions, and uncertainty. The program visualizes the effects of biases by creating an overlayered forest plot of bias-adjusted and -unadjusted values. When performing meta-analyses and sensitivity analyses, this helps assess the certainty of the body of evidence by setting various estimates for biases and indirectness of individual studies as risk ratios and standard deviations or 95 % confidence intervals.
Key Words: bias, indirectness, meta-analysis, randomized controlled trial, forest plot
緒 言 診療ガイドライン作成プロセスにおいて研究結果 の確実性の評価は重要な要素である1)2) .GRADE ap-proach3)4) ではシステマティックレビューにおいてク リニカルクエスチョンに関連して包括的に収集され た研究集合について,ランダム化比較試験(RCT)の 場合であれば,アウトカムごとにバイアスリスク, 非直接性,非一貫性,不精確,出版バイアスの 5 つ のドメインを評価し,エビデンス総体としての確実 性が評価される.観察研究の場合には,効果の大き さ,量反応関係,効果減弱交絡因子について評価さ れる. 臨床研究におけるバイアスについては,Berkman ND らの AHRQ の報告書5) に述べられているように 多くの種類がある一方で,経験的なデータに基づい たメタ疫学的研究は少なく,疾患,介入,アウトカ ムによって同じドメインのバイアスが異なる効果を 及ぼす可能性が高いので,実質的なバイアス mate-:小島原典子 〒162―8666 東京都新宿区河田町 8―1 東京女子医科大学医学部衛生学公衆衛生学(二)講座 Email: [email protected] doi: 10.24488/jtwmu.88.Extra1_E38
Copyright Ⓒ 2018 Society of Tokyo Women s Medical University
! # $ 東女医大誌 第 88 巻 臨時増刊 1 号 頁 E38∼E46 平成 30 年 1 月 " # %
rial bias を正確に知ることは困難である.リスクと してバイアスを評価せざるを得ないため,バイアス リスク risk of bias と呼び,確率論的にバイアスを評 価することが行われる. バイアスのモデル化については,Turner RM ら6) の提唱する方法が知られており,インフルエンザワ クチンの効果に関するメタアナリシスに用いた報告 がある7) .このバイアスのモデルでは,バイアスの効 果の大きさをリスク比などの効果指標の値,その不 確実性を分布と分散で表し,実際に研究で得られた 効果指標の値を調整した上で,メタアナリシスを行 うことができる.さらに,非直接性は外的バイアス として評価し,同じ方法で,効果指標の値の調整に 用いる.したがって,Turner RM らが内的バイアス および外的バイアスと呼ぶバイアスリスクと非直接 性を,不確実性を伴った,効果指標の値として導出 し,これらの影響を受けた効果指標の値を調整した 統合値が得られる.一方で,Turner RM らの提唱す る方法は,バイアスのドメインごとに評価した上で, 全体としての効果指標の値への影響を調整する精密 な方法であり,著者がすでに報告8) したように Excel などを用いて分類・整理しながらまとめることがで きるが,煩雑なため,広く普及するには至っていな い9) .本論文では,Turner RM らのバイアスのモデル に基づいて,一つの研究の非直接性を含めたバイア ス全体の効果をリスク比として表し,その不確実性 は標準偏差あるいは 95 %信頼区間で表し,バイアス の効果で調整したメタアナリシスを行うことで,バ イアスを可視化することを試みた. 方 法 1.バイアスのモデル 研究 i において,J 個のバイアスが認められた場合 のモデルでは,以下の式で表すことができる.実際 の R プログラムと解説は Appendix を参照してほ しい. J biases, j=1,...,J δb ij:bias j of study i δb ij∼N(μbij,σbij2) δb i∼N(μbi,σbi2):μbi=Σjμij σbi2=Σjσbij2 δb i∼N(Σjμbij,Σjσbij2) yi∼N(θi+μbi, si2+σbi2) yi−μbi∼N(θi, si2/αi):αi=si2/(si2+σbi2) なお,これらの式はすべて対数変換した上で成立 する.N は正規分布を表し,カッコ内は平均値と分 散を示す.δb iは研究 i における J 個のバイアスのバ イアス効果の値の合計値を平均値とし,分散の合計 値を分散とする正規分布に従うことになる.yiは研 究 i で得られたリスク比の値の自然対数であり,μb i はその研究のすべてのバイアスの効果のリスク比の 自然対数の総計である.バイアスで調整した介入の 効果は最後の式で表される.すなわち,各バイアス のリスク比の自然対数を加算した総計μb iを効果指 標の値の自然対数から減算し,分散はバイアスの分 散を加算した総計σb i2を効果指標の値の分散に加算 することで,バイアスで調整されたそれぞれの値が 得られる. 以上述べたバイアスはリスク比の乗算,自然対数 に変換した後には加算される効果なので,Turner RM らは加算バイアスと呼んでいる.それに対して, 対数スケール上でリスク比の値を乗算するとその効 果の結果が表されるようなバイアスを比例バイアス と呼んでいる.今回の検討では,実行の容易さを優 先し,さまざまなドメインのバイアス全体としての 効果を一つにまとめ,リスク比とその標準偏差(対 数スケール上)あるいは 95 %信頼区間で表し,加算 バイアスとしてリスク比の値を調整した. バイアスの効果の大きさは,“もし介入には効果が ない場合,サンプリングエラーはないとして,この バイアスだけでどれくらいの見かけ上の効果が表れ るか?”に答えるつもりで,それをリスク比で表し た値を設定する.非直接性の評価の際には,非直接 性が効果推定値に及ぼす効果をバイアスとしてとら え,“もし介入には効果がない場合,バイアスがない 理想の研究であっても,この外的バイアスだけでど れくらいの見かけ上の効果が表れるか?”に答える つもりで同じように設定する. Turner RM ら10) はバイアス判定の目安としてバ イ ア ス な し(none):リ ス ク 比 1.0,バ イ ア ス 低 (low):リスク比 0.9∼1.0,バイアス中(medium): リスク比 0.7∼0.9,バイアス高(high):リスク比< 0.7 という基準を提示している.リスクが上昇する方 向のバイアスの場合はこれらの数値の逆数となる. バイアスの効果の不確実性は,これらリスク比に対 する標準偏差あるいは信頼区間で表される.メタア ナリシスは R パッケージの metafor と Forest plot 作成のためのパッケージである forestplot を用い た.PC 環境としては Windows10 または Mac OSX いずれでも動作可能であることを確認済みである.
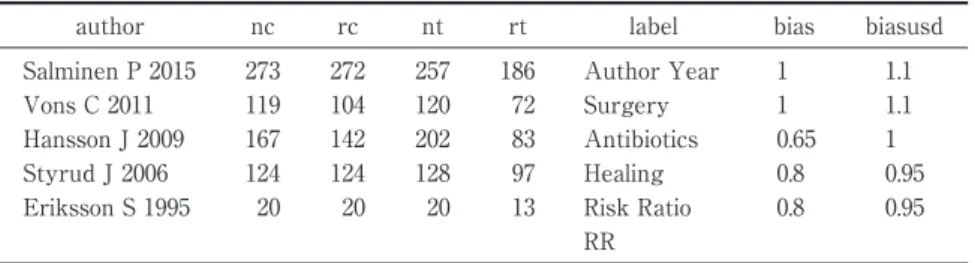
Table 1 Data prepared on Excel for analysis
author nc rc nt rt label bias biasusd Salminen P 2015 273 272 257 186 Author Year 1 1.1 Vons C 2011 119 104 120 72 Surgery 1 1.1 Hansson J 2009 167 142 202 83 Antibiotics 0.65 1 Styrud J 2006 124 124 128 97 Healing 0.8 0.95 Eriksson S 1995 20 20 20 13 Risk Ratio 0.8 0.95
RR
Author: Research ID; nc: total number of patients in the control group; rc: number of risk events in the control group, nt: total number of patients in the treatment group; rt: number of risk (event) in the treatment group label: Research ID to be displayed in a forest plot; bias: the degree of indirectness and risk that is expressed as a risk ratio; biasusd: the value of+1 standard deviation, the value of risk ratio before logarithmic transformation.
The value obtained by subtracting the logarithm of the bias value from that of the bi-asusd value corresponds to one standard deviation of the normal distribution on a log-arithmic scale. The value of -1 standard deviation is the exponential of the value ob-tained by subtracting that value from the logarithm of the bias value, which is calculated from the values of bias and biasusd. Furthermore, the probability of falling within the range of±1 standard deviation is twice that of falling within any other range. On the other hand, when using the upper limit value of the 95% confidence in-terval, the label used is biasuci. The pre-logarithmic-transformation value of the risk ratio is used in this case as well. Subtracting the logarithm of biasuci from the loga-rithm of bias and dividing the resulting value by 1.96 yields a value equivalent to one standard deviation of the normal distribution on a logarithmic scale. The difference be-tween the value of bias and the values of both biasusd and biasuci could be interpret-ed as an index of the uncertainty of the bias effect.
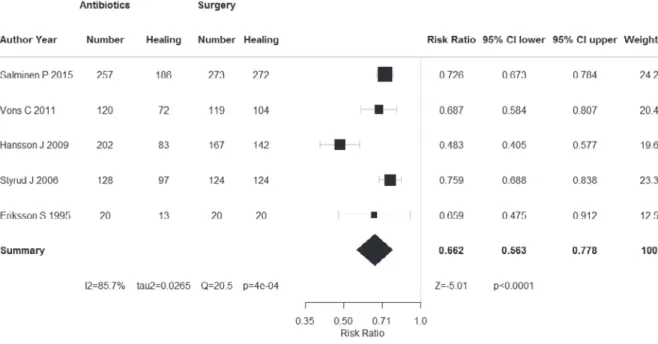
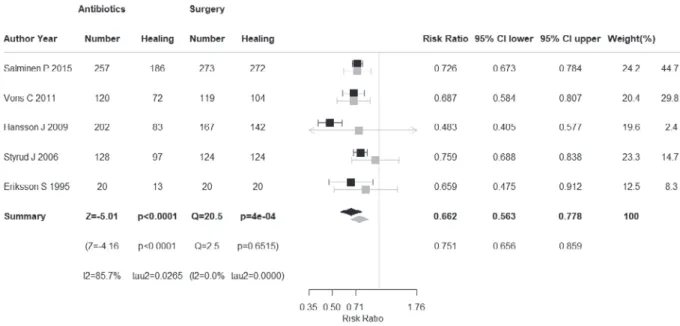
2.解析用データの準備 メタアナリシスのためのサンプルデータを Table 1 に示す.成人の急性虫垂炎で手術を対照とし,抗菌 薬投与による保存的治療を介入とした 5 件の RCT のデータである.アウトカムは“再発を伴わない 1 年以内の治癒”である.このデータの例におけるバ イアスの評価は,最近の 2 つの研究 Salminen P11) , Vons C12) はバイアス,非直接性は低,方向性は不明, Hansson J13) はバイアス,非直接性が高く介入群の治 癒率が低い方向へ過大評価されており(抗菌薬の効 果としては過小評価),その程度も大きくまた不確実 性も高い,Styrud J14) ,Eriksson S15) は治癒率が低い方 向へ過大評価されているが,その程度は中程度で, 不確実性は低いと判定した場合である(Table 2). 結果および考察 Fig. 1 に示すように,ランダム効果モデルによる 通常のメタアナリシスの統合値はリスク比 0.662 で,95 %信頼区間上限値 0.778 となった.研究間の異 質性の統計学的指標のひとつである I2値は 85.7 % と異質性が高いことを示唆している.Hansson J は 症例減少バイアスが大きい研究であり,真の値から かなりのずれが推定される.ランダム効果モデルを 用いているため,サンプルサイズの小さな研究の Weight は低くなるが,統合値からのずれが大きい 研究も Weight が低くなる.したがって,Styrud J と比べると,Hansson J はサンプルサイズが大きい にも関わらず,Weight は小さくなっており,ランダ ム効果モデルの特性が表れている. バイアス調整後には,過大評価されており,不確 実性も大きいと判断した研究 Hansson J は効果指標 の値が右側へずれ,1 により近づいた値になってい るとともに,信頼区間の幅が拡大して,不確実性が 高いという評価が反映されている(Fig. 2).そのた め,Weight も 19.6 から 2.4 %に低下している.興味 深いことに,バイアス調整後の統合値は 0.751 と,よ り介入の効果が高い方に移動しており,上限値も 0.859 と,より大きな値になっているとともに,95 % 信頼区間の幅は狭くなっている.Hansson J の値が 上記のごとく調整された結果および各研究の分散が 大きくなった効果以上に各研究の効果指標の値が調 整された結果研究間のばらつきが小さくなったため と考えられる. バイアス調整前の Forest plot に調整後の各研究 の効果指標,統合値とそれらの信頼区間を図として
Table 2 Results on evaluat ion of ind irectness and r isk of b ias among f ive random ized controlled tr ials(low(0) ;unclear /moderate(−1) ;h igh(−2) ) 個別研究 バイアスリスク* 選択バイアス 実行バ イアス 検出バ イアス 症例減少 バイアス その他 非直接性* リスク人数(アウトカム率) 研究コード 研究 デザイン ランダ ム化 コン シール メント 盲検化 盲検化 ITT 不完全 アウトカ ムデータ 選択的 アウト カム報告 早期 試験 中止 その他 のバイ アス まとめ 対象 介入 対照 アウト カム まとめ 対照群 分母 対照群 分子 ( % ) 介入群 分母 介入 群 分子 ( % ) 効果 指標 (種類) 効果 指標 (値) 信頼区間 Salm inen P 2015 RCT −1 −1 −1 −1 0 0 0 0 0 − 1 0 − 1 0 0 − 1 273 272 99.6 257 186 72.4 RR 0.7 26 0.67 ∼ 0.78 Vons C 2011 RCT −1 −1 −1 −1 0 − 2 0 0 − 1 − 1 − 1 0 0 0 − 1 119 104 87.4 120 7 2 60 R R 0.69 0.58 ∼ 0.81 Hansson J 2009 RCT −2 −1 −2 −1 0 − 2 0 0 0 − 2 − 2 − 1 0 0 − 2 167 142 85 202 8 3 41.1 RR 0.48 0.40 ∼ 0.58 St y rud J 2006 RCT −1 0 −1 −1 0 0 0 0 − 1 − 1 − 2 − 1 0 0 − 2 124 124 100 128 9 7 75.8 RR 0.76 0.69 ∼ 0.84 Er iksson S 1995 RCT −1 −1 −1 −1 0 0 0 0 − 1 − 1 − 2 − 1 0 0 − 2 20 2 0 100 2 0 13 65 RR 0.66 0.48 ∼ 0.91 計 703 662 727 451 重ねて表示したのが Fig. 3 である.なお,個別研究の 効果指標の値と 95 %信頼区間の上限値・下限値の 値は研究間のバラつきの指標であるτ2が加味され ていない通常のメタアナリシスの場合(Fig. 1)と同 じ結果を示す.また,Table 1 に示すバイアスの効果 を Forest plot の形式で表したのが Fig. 4,これらの バイアスの効果で Fig. 1 に示す効果指標を調整した ものが Fig. 2 といえる. バイアスリスクおよび非直接性の効果の大きさも 方向性も判定せず,効果推定値の不確実性を大きく する効果だけを判定し,それをメタアナリシスの結 果に反映させた場合にどうなるか見てみよう.Fig. 5 にバイアスの効果を可視化して Forest plot とし て表示し,Fig. 6 にバイアス調整前後のメタアナリ シスの結果を示す.Turner RM らのモデルでは,リ スク比の分散にバイアスの分散が加算されるため通 常バイアス調整後のメタアナリシスでは統合値の信 頼区間が拡大する場合が多いはずであるが,この例 では逆に狭くなった.Hansson J の重みが 2.8 %と無 視しうるほどに減少したため,研究間のばらつきが 小さくなったためと考えられる.一方,感度分析と してバイアスリスクも非直接性も大きい Hansson J を除いて,その他の条件は Fig. 6 と同じにしてバイ アス調整メタアナリシスを行うと,Fig. 7 に示すよ うに統合値の信頼区間は拡大した. RCT におけるバイアスリスクの評価法について は,コクランレビューで用いられている方法がよく 知られている16)17)
.Cochrane risk of bias tool と呼ば れているが,現在 Version 2.0 の草案が公開されてい る18)
.この新バージョンでは,例えば,今まで Other biases に 分 類 さ れ て い た Baseline imbalances を Bias arising from randomization process す な わ ち 選択バイアスに含め,“Was the allocation sequence random ? ”,“ Was the allocation sequence con-cealed?”,“Were there baseline imbalances that sug-gest a problem with randomization?”の 3 つのシグ ナリングクエスチョンに対して,Yes,Probably yes, Probably no,No,No information で答えることで, “High”,“Some concerns”,“Low”の 3 段階で評価す
るようになっている.
Cochrane Handbook for Systematic Reviews of Interventions も現 在 の Version 5.1 か ら 5.2 へ 改 訂 作業中で一部は作業が終了しているようであるが, 大きな変更は行われないようである.現在のハンド ブックの 8 章 8.5.3 The judgement の項には以下の
Fig. 1 Forest plots of meta-analysis based on the random-effects model
Fig. 2 Forest plots of the meta-analysis after bias adjustment
ように記述されている.“material bias”(リスクとし て評価される実質的バイアスという意味に解釈され る)を“研究の結果あるいは結論に顕著な影響を持 つほど十分な大きさのバイアス”と定義した上で, 何らかのバイアスのリスクではなく“material bias” のリスクを考慮すべきであり,そのような判断には いずれの場合も主観性が含まれる. バイアスリスク評価の際の評価者間の一致率につ いても報告があり19)20) ,その判定には評価者の専門 性,経験などが影響し,バラつきが生じることが示 されている.上記 Cochrane handbook でも臨床疫 学,医学統計学,システマティックレビューのエキ スパートとコンテンツのエキスパートすなわち疾患 の専門家がペアで研究の評価を行うことが推奨され ている.たとえば,Baseline imbalances の一つとし て,比較される群間で年齢分布が異なっていたり, 重症度が異なっていたりした場合に,それがアウト カムにどのように影響するのかを推定するのは疾患
Fig. 3 Forest plots of the meta-analysis before and after bias adjustment
Fig. 4 The bias effect expressed as risk ratio and 95 % confidence interval limits
専門家には容易であっても,システマティックレ ビューの専門家には困難である. また,非直接性の評価は特に疾患専門家以外には 困難であり,日本人の患者に適用した場合の効果を 推定する場合には,疾患専門家でなければ困難と考 えられる.バイアスリスクの評価の際にバイアスの 大きさ magnitude と方向 directions,すなわち過大 評 価 か 過 小 評 価 か,に つ い て 評 価 す る こ と は Cochrane handbook には推奨されるレベルであり 必須ではないと述べられているため,バイアスリス クの各ドメインを High,Unclear,Low の 3 分類で 評価するにとどまり,例えば High と判定された場 合に,研究結果に顕著な影響を及ぼしているバイア スの可能性が高いという以上の情報は提供されな い.もし 2 つの異なるドメインのバイアスの方向性 が異なる場合には,その研究結果の効果推定値は真 の値からずれていない可能性が高くなる.しかし, High と判定されたドメインが 2 つあれば,全体とし て,その研究のバイアスリスクは High と判定され てしまうことになる.その場合の解釈として効果推
Fig. 5 Visualized bias effect
When only the effect on the uncertainty to the estimated value was assessed, without evaluating the direction and magnitude of the bias, we visualized the bias effect expressed by the risk ratio and the value of+1 SD by using a forest plot.
Fig. 6 Forest plots of meta-analysis before and after bias adjustment
If the bias effect is perceived only as an effect on uncertainty, the value of the effective-ness indicators of each study will not change, and the confidence interval will expand. The grey colour indicates having been bias-adjusted, and in this example, based on the use of the random effect model, the integration value approaches 1.0 and the confidence interval narrows. 定値はバイアスにより真の値から大きくずれが生じ ていると考える者が多いであろう.しかし,効果推 定値は変動せず,不確実性のみが大きくなるはずで ある. 本稿で示した方法を用いることによって,①バイ アスの効果の大きさと方向性が推定できる場合(リ スク比の値が設定でき分布の大部分が>1.0 または <1.0 にある場合)も,②大きさは推定できるが方向
Fig. 7 Results of the sensitivity analysis of the meta-analysis
Excluding Hansson J 2009, when only the effect on the uncertainty of each study was evaluated, the integrated value decreased from 0.730 (95 %CI 0.690-0.771) to 0.712 (0.621-0.818) following bias adjustment. Thus, the confidence interval expanded and uncertainty increased. 性が推定できない場合(リスク比の値が設定できる が分布が 1.0 をまたぐ場合)も,③大きさも方向性も 推定はできないがバイアスのリスクが高いと判定で きる場合(リスク比の値を 1.0 に設定しバイアスの リスクの程度に応じて分布の広がりを設定する場 合)も,いずれの場合も調整した結果に反映させる ことができ,メタアナリシスで統合した場合の影響 も容易に知ることができる.さらに,感度分析とし てさまざまなバイアスの大きさ,方向性,不確実性 を設定して,統合値がどのように変動するかを見る ことによって,エビデンス総体の確実性を検討する ことが可能となる. 結 論 Cochrane の方法のように,方向性,大きさについ て明確な判断をしない場合は,High risk of bias の判 定に対してバイアスの効果の標準偏差を大きく, Low risk of bias の判定に対しては小さく設定して バイアス調整メタアナリシスを実行することによ り,バイアスが可視化され,エビデンスの確実性の 評価が容易になる可能性がある.バイアスの効果の 標準偏差をどの程度に設定するかは評価者の判断に より,バイアスの効果の不確実性に応じて設定する. また,バイアスの評価を複数の評価者が行うことも 可能であり,その場合,評価ドメイン,項目,バイ アスの効果の判定方法について,あらかじめ議論し, 理解を共有した上で,独立して評価を行う.結果に ついて,議論した上で思い違いや判定エラーがない か確認し,大きさと標準偏差について中央値を用い て,バイアス調整メタアナリシスを実行することが 可能である.評価者が多数の場合,大きさと標準偏 差の分布を示したり,中央値と最小値,最大値を示 したりすることで,バイアスリスクの評価に透明性 を確保することが可能になる.また,従来行われて いる方法の様に,2 名の評価者で意見を調整して一 つの評価にまとめる必要がなくなる. 今後,現在一般的に行われている定性的なバイア スリスクの評価法と,本稿で示したバイアスの大き さ,方向,不確実性の 3 つの要素を定量的に評価す る方法とを比較する研究が必要であろう.その際に, 本稿で述べた方法は有力なツールになると考える. 利益相反は特にない. 文 献
1)IOM (Institute of Medicine). Clinical Practice Guide-lines We Can Trust. The National Academies Press, Washington, DC ( 2011 ) http://www. nationalacademies.org/hmd/Reports/2011/ Clinical-Practice-Guidelines-We-Can-Trust.aspx ( ac-cessed on Nov 23, 2017)
2)IOM ( Institute of Medicine ) . Standards for Sys-tematic Reviews. The National Academies Press, Washington, DC (2011) http://www.
nationalacademies.org/hmd/Reports/2011/ Finding-What-Works-in-Health-Care-Standards-for-Systematic-Reviews/Standards.aspx ( accessed on Nov 23, 2017)
3)Atkins D, Best D, Briss PA et al; Grade Working Group: Grading quality of evidence and strength of recommendations. BMJ 328: 1490, 2004
4)GRADE handbook 2013. http://gdt. guidelinedevelopment.org/app/handbook/ handbook.html#h.svwngs6pm0f2 (accessed on Nov 23, 2017)
5)Berkman ND, Santaguida PL, Viswanathan M et al: The Empirical Evidence of Bias in Trials Meas-uring Treatment Differences. Methods Research Report. Agency for Healthcare Research and Qual-ity, Rockville (2014)
6)Turner RM, Spiegelhalter DJ, Smith GC et al: Bias modelling in evidence synthesis. J R Stat Soc Ser A Stat Soc 172: 21―47, 2009
7)Darvishian M, Gefenaite G, Turner RM et al: Af-ter adjusting for bias in meta-analysis seasonal in-fluenza vaccine remains effective in community-dwelling elderly. J Clin Epidemiol 67: 734―744, 2014 8)森實敏夫:医学統計学シリーズ第 35 回 バイアス
による効果指標の調整.あいみっく 37(1):8―18, 2016
9)Dias S, Sutton AJ, Welton NJ et al: Evidence synthesis for decision making 3 : heterogeneity -subgroups, meta-regression, bias, and bias-adjustment. Med Decis Making 33: 618―640, 2013 10)森實敏夫:医学統計学シリーズ第 40 回 バイアス
で調整したメタアナリシス.あいみっく 38(1): 10―19,2017
11)Salminen P, Paajanen H, Rautio T et al: Antibi-otic therapy vs appendectomy for treatment of un-complicated acute appendicitis: The APPAC ran-domized clinical trial. JAMA 313: 2340―2348, 2015 12)Vons C, Barry C, Maitre S et al: Amoxicillin plus
clavulanic acid versus appendicectomy for
treat-ment of acute uncomplicated appendicitis: an open-label, non-inferiority, randomised controlled trial. Lancet 377: 1573―1579, 2011
13)Hansson J, Körner U, Khorram-Manesh A et al: Randomized clinical trial of antibiotic therapy ver-sus appendicectomy as primary treatment of acute appendicitis in unselected patients. Br J Surg 96 : 473―481, 2009
14)Styrud J, Eriksson S, Nilsson I et al: Appendec-tomy versus antibiotic treatment in acute appendi-citis. a prospective multicenter randomized con-trolled trial. World J Surg 30: 1033―1037, 2006 15)Eriksson S, Granström L: Randomized controlled
trial of appendicectomy versus antibiotic therapy for acute appendicitis. Br J Surg 82: 166―169, 1995 16)Higgins JP, Altman DG, Gøtzsche PC et al;
Co-chrane Bias Methods Group; CoCo-chrane Statistical Methods Group: The Cochrane Collaboration s tool for assessing risk of bias in randomised trials. BMJ 343: d5928, 2011
17)Cochrane handbook for systematic reviews of in-terventions (version 5.1.0). http://training.cochrane. org/handbook (accessed on Nov 23, 2017)
18)Higgins JPT, Savovic´ J, Page MJ, Sterne JAC, ed: Revised Cochrane risk of bias tool for random-ized trials (RoB 2.0), 2016. (accessed on Nov 23, 2017) https://www.bristol.ac.uk/media-library/sites/ social-community-medicine/images/centres/ cresyda/RoB2-0_indiv_main_guidance.pdf
19)Armijo-Olivo S, Ospina M, da Costa BR et al: Poor reliability between Cochrane reviewers and blinded external reviewers when applying the Co-chrane risk of bias tool in physical therapy trials. PLoS One 9: e96920, 2014
20)Hartling L, Hamm M, Milne A et al: In Validity and Inter-Rater Reliability Testing of Quality As-sessment Instruments. Agency for Healthcare Re-search and Quality (US), Rockville (2013)