foster a sense of coherence? - A 2-year
follow-up study of Japanese men and women
著者(英)
Taisuke Togari
journal or
publication title
Journal of The Open University of Japan
volume
33
page range
27-43
year
2016-03-25
Do social factors in adolescence and adulthood foster a sense of
coherence? ‒ A 2-year follow-up study of Japanese men and women
Taisuke TOGARI
sense of coherenceを規定する思春期及び成人期の社会的要因〜
日本人成人男女における2年間の追跡調査から
戸ヶ里 泰 典
1)ABSTRACT
A sense of coherence (SOC), i.e. the capacity to cope with stressors, is fostered by socioeconomic background and status. Thus, the current study of Japanese adults sought to clarify how the socioeconomic status of oneʼs parents at
age 15 and an individualʼs academic performance, level of education, current occupation, and financial situation are associated with the level of that individualʼs SOC. This study also sought to clarify how these aspects were associated with changes in SOC over a period of 2 years. In 2007, two-stage stratified random sampling of Japanese men and women ages 20 to 40 was done by sex, age, and city of residence. These individuals were surveyed by mail via a self-administered questionnaire; 4,800 individuals who agreed to participate in this study constituted the baseline participant pool. A follow-up survey was conducted 2 years later, and 3,605 individuals who responded (follow-up rate 75.1%) constituted the participant sample.
Hierarchical multiple regression by fixed effect model analysis was done with SOC as a dependent variable and social factors as independent variables. For both men and women, having a family that was financially well off during adolescence and success in school were directly associated with an individuals current SOC. In addition, the occupation of an individualʼs father and being in a family that was financially worse off were not directly associated with an individualʼs current SOC, but an individualʼs current SOC was indirectly affected by academic performance and level of education. In addition, only men in a blue-collar profession and being unemployed foster a low SOC regardless of sex and age group and regardless of the financial situation during adolescence and level of education. These findings essentially corroborate Antonovskyʼs concept of the development of an SOC. They also indicate that
success in school during adolescence is a particularly powerful factor for development of an SOC. Two factors promoting the development of an SOC, parentsʼ occupation and level of education, were not necessarily determinants but were found to be readily affected by an individualʼs current occupation and financial situation. In addition, the salutogenic model stands as a way to explain the mechanisms of class disparities and inequality in health.
要 旨 ストレス対処力概念であるsense of coherence(SOC)は社会経済的な生育環境や地位によって規定されるとされ ている。そこで日本人成人を対象として15歳時の親の社会経済的地位、学業成績、学歴、現在の職業、経済状況が SOCの高低、ならびに2年間の変化にどのように関連するのかを明らかにすることを目的とした。2007年に日本国民 で満20歳以上40歳以下の男女を性、年齢、居住都市による層化2段無作為抽出し、郵送自記式質問紙調査を行ない協 力を得た4,800名をベースライン調査対象とした。2年後に追跡調査を実施し回答した3,605名(追跡率75.1%)を分 析対象者とした。 SOCを従属変数とし社会的各要因を独立変数とした階層的重回帰分析の結果、男性、女性ともに、ず思春期におけ る家庭の経済的状況が豊かであったこと、学校における成功体験があったことは、直接現在のSOCとの関連性を持っ ていた。また、父親の職業、家庭が経済的に貧しかったことは、現在のSOCに対して直接の関連性は持たず学業成績 あるいは学歴を介して間接的に影響していた。また、非正規雇用のブルーカラー職と無業者であることは、男性、女 1) 放送大学准教授(「生活と福祉」コース) 放送大学研究年報 第33号(2015)27-43頁
cope with stressors, which Antonovsky termed the SOC.
A GRR is defined as a “physical, biochemical, artifactual-material, cognitive, emotional, valuative, attitudinal, interpersonal-relational, macrosociocultural characteristic of an individual, primary group, subculture, society that is effective in avoiding/combating a wide variety of stressors” (Antonovsky 1979: 103). These GRRs shape the SOC. GRRs provide life experiences that are characterized by consistency, an underload-overload balance of stimuli, and participation in shaping outcome. Continually going through these experiences shapes an individualʼs SOC. The GRRs that serve to shape an SOC are themselves shaped by aspects such as socioeconomic context, cultural/historical context, childrearing patterns, and social roles (Antonovsky 1979: 182-97).
SOC is defined as consisting of three components, i.e. comprehensibility, manageability, and meaningfulness. Comprehensibility is “the feeling of confidence that… the stimuli deriving from oneʼs internal and external environments in the course of living are structured, predictable and explicable,” manageability is “the feeling of confidence that…the resources are available to one to meet the demands posed by these stimuli,” and meaningfulness is “the feeling of confidence that… these demands are challenges, worthy of investment and engagement” (Antonovsky 1987=2001: 23). 1.3 Salutogenic model
The salutogenic model can be divided into two main components. This first concerns confronting stressors and health. When confronting a stressor, an individual experiences a state of tension. Salutary factors successfully resolve this state of tension, leading to health, or fail to resolve this tension, leading to stress and illness. An individual with a high SOC is able to mobilize more psychosocial GRRs and physiological GRRs, i.e. neuroimmunological or neuroendocrinological resources in the brain. This action protects the body from harm and promotes health (Antonovsky 1987=2001: 178-86).
The second part of the model concerns the process
1
Introduction
1.1 Salutogenesis and a sense of coherence
According to the health sociologist Aaron Antonovsky, the concept of a sense of coherence (SOC) can be understood as successfully coping with chronic stressors, life events such as schooling, employment, marriage, and childbirth, and traumatic events such as war when experiencing events and adversity in life. An SOC is the capacity to cope with these stressors and successful coping promotes health (Antonovsky 1979: 160-81; Antonovsky 1987=2001: 149-75). Antonovsky describes factors for the onset or exacerbation of disease as risk factors. Modern medicine studies the origins of disease, which Antonovsky terms pathogenesis, by amassing findings with regard to mitigating or eliminating these risk factors. Antonovsky describes this perspective as a pathogenic approach. Antonovsky, however, looked at salutary factors that promote health and recovery from illness. Salutogenesis, according to Antonovsky, is the study of these salutary factors, and a salutogenic approach is the study of the mechanisms of promoting health and recovery from illness. According to Antonovsky, the complementary development of the 2 approaches, pathogenesis and salutogenesis, is crucial (Antonovsky 1979: 35-7). This concept of salutogenesis is considered to be the philosophical basis for the Ottawa Charter for Health Promotion (Kickbush 1996; Antonovsky 1996; Eriksson & Lindström 2006). A salutary factor that plays a central role in salutogenesis is the SOC (Antonovsky 1979: 182-7).
1.2 Generalized resistance resources and the SOC
From a salutogenic perspective, Antonovsky presented a model encompassing the various historical/cultural, socioeconomic, psychosocial, and biomedical aspects of human existence and the processes that lead to health based on numerous empirical studies. He termed this model the salutogenic model (Antonovsky 1979: 182). Salutary factors in the salutogenic model consist of resources, which Antonovsky termed generalized resistance resources (GRRs), and a view of life and capacity to
性によらず、また、世代によらず、また、思春期の社会経済的な状況、学歴によらず正規雇用の専門・技術職よりも 低いSOCが規定され、現在の経済的状況を介した間接的な関連性を持っていた。 以上よりAntonovskyによるSOCの形成に関する理論を概ね支持することができ、また特に、思春期の学校におけ る成功体験は有力な形成要因としてSOC形成の理論において重要な位置にあることが明らかとなった。また、SOC形 成を促す要因のうち、親の職業や学歴は必ずしも決定的な要因ではなく、現在の職業や経済的状況の影響を受けやす いことが明らかとなった。また、健康生成モデルは健康の階層間格差・不平等発生のメカニズムを説明しうる1つの 理論として位置づけることができるものと考えられた。
indicated that experiences with financial difficulties in the home prior to age 16, an alcoholic in the home, domestic violence, and domestic discord, are, the more often they are encountered, associated with a lower SOC regardless of sex, age, and level of education. Of experiences with the divorce or death of both parents prior to early adolescence, financial difficulties during early adolescence, and the relationship with oneʼs parent, a lack of experience with financial difficulties and a good relationship with oneʼs parents are associated with an individualʼs subsequent SOC, as Volanen et al. (2006) indicated. Feldt et al. (2005) indicated that good family relationships at age 14 are directly associated with a high SOC at age 42. However, Krantz & Östergren (2004) indicated that residing with both parents at age 16, having siblings, and suffering abuse from school age through early adolescence are not directly associated with SOC. Multivariate analysis of the association between the familyʼs socioeconomic status during adolescence and SOC by Lundberg (1997) indicated that the familyʼs socioeconomic status was indirectly associated with current SOC through current occupation. Feldt et al. (2005) indicated that the prestige of a fatherʼs occupation was indirectly associated with adult SOC through later level of education.
In addition, Feldt et al. (2005) indicated that academic performance at age 14 was indirectly associated with adult SOC through an individualʼs later level of education. Compared to university graduates, graduates of a technical school were 1.2 times (men) and 2.0 times (women) more likely to have a low SOC while high school graduates were 1.5 times (men) and 3.1 times (women) more likely to have a low SOC (Suominen et al. 1999). A higher level of education had a direct effect on increasing oneʼs SOC score after age 65 (Sagy & Antonovsky 2000). Compared to individuals with 13 or more years of education, individuals with fewer than 9 years of education had a low SOC score; this was true for both men and women (Volanen et al. 2004; Volanen et al. 2006). Nevertheless, these findings did not statistically control for an individualʼs later occupation and financial state. A study controlling for nationality, age, and occupation (Grøholt et al. 2003) indicated that women with 12 years of education were 1.3 times more likely to have a low SOC than were women with 13 or more years of education, women with 10-11 years of education were 1.4 times more likely to have a low SOC, and women with 9 or fewer years of education were 1.6 times more likely to have a low SOC, so years of education had a direct effect on SOC. A study that controlled for academic of developing an SOC, a central salutary factor. In
other words, sex, race, socioeconomic status, social networks, or the life experiences provided by GRRs (experiences characterized by consistency, an underload-overload balance of stimuli, and participation in shaping outcome) produce an SOC. Continually going through these experiences shapes comprehensibility, manageability, and meaningfulness, the components of an SOC (Antonovsky 1987=2001: 103-9).
Numerous empirical studies have been conducted on the first component of the salutogenic model, i.e. an individual with a high SOC is able to successfully mobilize more neuroimmunological or neuroendocrinological resources in the brain and thus stay healthy or recover.
Examples include the ability of the SOC to predict the total mortality rate (Surtees et al. 2003, Poppius et al. 2003), the mortality rate from cardiovascular disease (Poppius et al. 2003), the mortality rate from cancer, (Poppius et al. 2006), the incidence of cardiovascular disease (Poppius et al. 1999), the incidence of cancer (Poppius et al. 2006), the incidence of cerebral infarction (Surtees et al. 2006), the incidence of type II diabetes (Kouvonen et al. 2008), and Self-Rated Health (Suominen et al. 2001). Moreover, a systematic review (Eriksson et al. 2006) indicated that most of the 1,000 or more previous empirical studies on SOC were studies on the function and prediction of SOC that demonstrated an association between SOC and health. Almost all indicated an association between subjective health status and SOC.
1.4 Determinants of SOC
Nevertheless, the reality is that there are very few empirical studies on the second component of the salutogenic model, i.e. how the SOC is shaped.
1.4.1 Social factors in adolescence and SOC
Several studies have indicated an association between family relationships during adolescence and subsequent SOC. Of experiences with financial difficulties at age 16 and difficulties at home (divorce or a parentʼs death, family discord), financial difficulties were associated with an individualʼs current SOC through current social status, according to Lundberg (1997). Difficulties at home had the direct effect of lowering oneʼs current SOC. Sagy & Antonovsky (2000) indicated that having participated in decision-making in the home during adolescence and having parents with a high level of education were associated with a high SOC after age 65. Volanen et al. (2004)
2006). The more stable an individualʼs career is from ages 27 to 42, the higher that individualʼs SOC at age 42 (Feldt et al. 2005).
With regard to the association between SOC and an individualʼs current financial situation, SOC decreased only for women with a lower household income; an increase in SOC with a higher income was not noted (Smith et al. 2003). One report found no association between the level of an individualʼs income and the level of an individualʼs SOC (Krantz & Östergren 2004).
Thus, few empirical studies have examined the determinants of an SOC. These studies have been limited mostly to Northern Europe and Canada. Nevertheless, SOC is, as Antonovsky explained, highly dependent on conditions that are related to GRRs, i.e. it is closely related to social conditions involving acquaintances and groups (providing life experiences and being mobilized when the individual copes with stressors). Focusing on social factors that are GRRs, such as socioeconomic conditions in the home during childhood and later socioeconomic status, as factors for development of an SOC is significant in that this approach facilitates the formulation of future strategies to examine the development of an SOC. 1.5 Hypotheses on the development of an SOC
In light of the research reviewed thus far, there are four hypotheses on the development of an SOC to consider.
The first is that having parents with a prestigious occupation during adolescence and being raised in social conditions where the family is in a good financial state foster a high current SOC either directly or indirectly through later socioeconomic status. This is based on three premises. The first is Antonovskyʼs hypothesis that societal context, such as the socioeconomic status of oneʼs upbringing during adolescence, significantly shapes oneʼs SOC. The second involves previous studies by Lundberg (1997) and Feldt et al. (2005) indicating that parentsʼ occupation contributes to an individualʼs subsequent SOC through later level of education. The third involves previous studies by Lundberg (1997) and Volanen et al. (2004, 2006) indicating that financial difficulties in the home prior to age 16 are associated with adult SOC regardless of later level of education and occupation.
The second hypothesis is that academic performance during adolescence fosters a high current SOC directly or indirectly through later level of education and that a higher level of education achievement as an indicator of success in school (Feldt
et al. 2005) also indicated that having a high level of education only had an indirect effect associated with a satisfactory adult SOC through later occupation. 1.4.2 Relationship between SOC and an individual s
current occupation and financial situation
Several studies described the association between an individualʼs current occupation and SOC. Compared to upper white-collar workers, middle-white collar workers were 1.70 times more likely to have a low SOC, lower while-collar workers were 2.06 times more likely to have a low SOC, self-employed individuals were 1.48 times more likely to have a low SOC, farmers were 3.01 times more likely to have a low SOC, skilled laborers were 3.04 times more likely to have a low SOC, and unskilled laborers were 3.93 times more likely to have a low SOC (Lundberg 1997). Compared to upper white-collar workers, lower while-collar workers, blue-collar workers, and farmers had a low SOC; this was true for both men and women (Volanen et al. 2004). Compared to blue collar workers, more white-collar workers had a good SOC (Krantz & Östergren 2004). Compared to top white-collar workers, bottom blue-collar workers were 1.38 times more likely to have a low SOC and unskilled laborers were 1.58 times more likely to have a low SOC. An association was not noted between a low SOC and the categories of middle white-collar workers, self-employed individuals, farmers, and students (Grøholt et al. 2003).
In a longitudinal study (Smith et al. 2003), the SOC score decreased 2.00 times for male unskilled laborers compared to specialized/technical workers and management; for female skilled laborers, it decreased 1.62 times, for female semi-skilled laborers it decreased 2.41 times, and for female unskilled laborers it decreased 2.45 times more. That said, statistically significant differences from individuals with an increasing SOC were not noted. A 5-year follow-up (Nilsson et al. 2003) noted no changes in both men and women who were self-employed and female blue-collar workers, but it did note a decline in SOC for male blue-collar workers, male white-collar workers, and female white-collar workers.
Unemployed individuals and individuals receiving a disability pension have a lower SOC compared to employed individuals, regardless of level of education and difficulties in childhood, so an association between employment status and SOC has been noted regardless of current profession (Volanen et al. 2004). Compared to employed individuals, unemployed individuals have been found to have a significantly lower SOC (Volanen
1.6 Aims of this study
In light of the 4 hypotheses cited previously, the current study first sought to clarify by sex the association between SOC in adulthood and the familyʼs socioeconomic situation during adolescence and the individualʼs academic success and later level of education using 2 years of longitudinal study data from a representative sample of Japanese ages 20 to 40. Second, this study sought to determine how SOC relates to an individualʼs current occupation, employment status, and financial situation. Third, this study sought to determine how these social factors relate to changes in SOC over a period of 2 years.
2
Methods
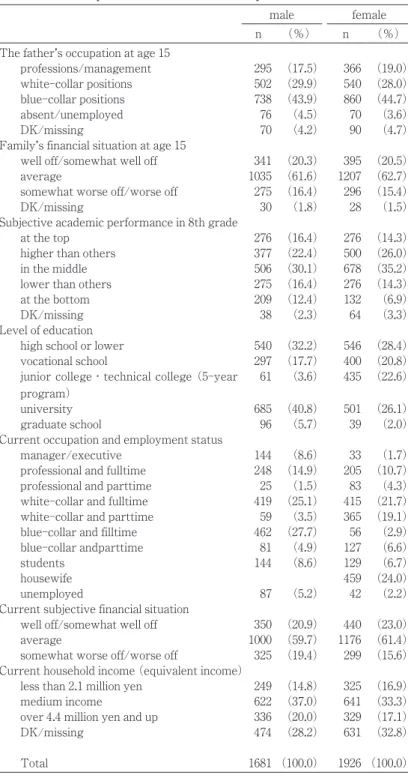
2.1 Participants and proceduresMen and women ages 20 to 40 residing in Japan as of January 1, 2007 were selected by two-stage stratified random sampling by sex, age, and city of residence. A self-administered questionnaire was distributed by mail and collected in person by a researcher. Potential participants were sent a postcard about the survey in early January 2007 and the questionnaire was mailed in late January. In early February, the questionnaire was collected in person by a researcher. Of the questionnaires sent, 4,801 were completed (response rate: 34.4%). One questionnaire with extremely skewed responses was excluded, leaving 4,800 individuals in the baseline participant pool. A follow-up was conducted 2 years later (January-March 2009) and responses were received from 3,605 individuals (follow-up rate: 75.1%) who constituted the survey participants. The distribution of the participants is shown in Table 1.
The study sample had roughly the same distributions by sex and age group as in national population estimates announced by the Japanese Government in October 2006, so no correction was done. In addition, this survey provided the baseline for a panel survey to be conducted over the next 5 years, so participants were asked to answer the questionnaire assuming they would participate in future surveys.
2.2 Measures
2.2.1 SOC3-UTHS
Three-item version of SOC scale (University of Tokyo Health Sociology version of the Sense of Coherence Scale: UTHS) was used. The SOC3-UTHS is a short form of the SOC scale created for large-scale multi-purpose population surveys and had 3 items rated on a 7-point semantic differential fosters a higher SOC directly or indirectly through
later socioeconomic status. This corresponds to the hypothesis of Feldt et al. (2005) that completing work in school provides good experience balancing loads, possibly promoting the development of an SOC. Additional evidence is a previous study (Feldt et al. 2005) that found an association with SOC through later level of education and occupation. Further evidence comes from previous studies on an individualʼs education level and SOC (Grøholt et al. 2003; Feldt et al. 2005).
The third hypothesis is that an individualʼs occupation or work status contributes to the current level of the individualʼs SOC. In other words, occupations providing more opportunities to make socially meaningful decisions, complex work that is technical and specialized, and professions providing job security (mostly full-time employment in a management position) foster a high SOC. A profession or work status without those traits (blue-collar professions, part-time employment, unemployment, etc.) fosters a low SOC. A profession or work status with those traits features frequent participation in decision-making at work and provides conditions that facilitate difficult work. The assurance one will not be fired without violating legitimate rules and the confidence that the current system will continue promote the development of an SOC, as Antonovsky hypothesized (Antonovsky 1987). Evidence comes from a previous study (Smith et al. 2003) indicating that unskilled blue-collar professions foster a low SOC, compared to a specialized or technical profession, for both men and women. Evidence also comes from previous studies indicating that blue-collar professions foster a low SOC compared to upper white-collar professions (Lundberg 1997; Volanen et al. 2004; Grøholt et al. 2003).
The fourth hypothesis is that a better current financial situation directly fosters a high SOC score regardless of conditions during adolescence or occupation. Evidence comes from previous studies (Smith et al. 2003; Krantz & Östergren 2004) that examined the strong association between SOC and economic clout, a GRR that provides life experiences that shape an SOC.
To sum up, studies need to examine social factors for development and determinants of an SOC, and this topic needs to be studied in a large-scale national sample from Japan. In addition, the salutogenic model and SOC may explain the mechanisms of socioeconomic disparities and inequality in health and thus need to be studied.
Table 1 Descriptive statistics in this study
male female
n (%) n (%)
The fatherʼs occupation at age 15
professions/management 295 (17.5) 366 (19.0)
white-collar positions 502 (29.9) 540 (28.0)
blue-collar positions 738 (43.9) 860 (44.7)
absent/unemployed 76 (4.5) 70 (3.6)
DK/missing 70 (4.2) 90 (4.7)
Familyʼs financial situation at age 15
well off/somewhat well off 341 (20.3) 395 (20.5)
average 1035 (61.6) 1207 (62.7)
somewhat worse off/worse off 275 (16.4) 296 (15.4)
DK/missing 30 (1.8) 28 (1.5)
Subjective academic performance in 8th grade
at the top 276 (16.4) 276 (14.3)
higher than others 377 (22.4) 500 (26.0)
in the middle 506 (30.1) 678 (35.2)
lower than others 275 (16.4) 276 (14.3)
at the bottom 209 (12.4) 132 (6.9)
DK/missing 38 (2.3) 64 (3.3)
Level of education
high school or lower 540 (32.2) 546 (28.4)
vocational school 297 (17.7) 400 (20.8)
junior college・technical college (5-year program)
61 (3.6) 435 (22.6)
university 685 (40.8) 501 (26.1)
graduate school 96 (5.7) 39 (2.0)
Current occupation and employment status
manager/executive 144 (8.6) 33 (1.7)
professional and fulltime 248 (14.9) 205 (10.7)
professional and parttime 25 (1.5) 83 (4.3)
white-collar and fulltime 419 (25.1) 415 (21.7)
white-collar and parttime 59 (3.5) 365 (19.1)
blue-collar and filltime 462 (27.7) 56 (2.9)
blue-collar andparttime 81 (4.9) 127 (6.6)
students 144 (8.6) 129 (6.7)
housewife 459 (24.0)
unemployed 87 (5.2) 42 (2.2)
Current subjective financial situation
well off/somewhat well off 350 (20.9) 440 (23.0)
average 1000 (59.7) 1176 (61.4)
somewhat worse off/worse off 325 (19.4) 299 (15.6) Current household income (equivalent income)
less than 2.1 million yen 249 (14.8) 325 (16.9)
medium income 622 (37.0) 641 (33.3)
over 4.4 million yen and up 336 (20.0) 329 (17.1)
DK/missing 474 (28.2) 631 (32.8)
Total 1681(100.0) 1926 (100.0)
DK: do not know
Table 2 Descriptive statistics about continuous variables
male female
n mean (SD) n mean (SD)
Age 1681 30.9 (5.7) 1926 31.0 (5.9)
Time1 SOC 1666 15.0 (3.5) 1913 15.0 (3.3)
Time2 SOC 1328 14.8 (3.3) 1683 14.8 (3.1)
combined into the 3 categories of “well off/somewhat well off,” “average,” and “somewhat worse off/worse off,” and individuals who responded that they did not know and individuals who failed to respond were combined into 1 category, so 4 categories in total served as variables.
2.2.2.3 Subjective academic performance in 8th grade
Given that the current survey was a large-scale multi-purpose survey and given constraints in terms of the questionnaire, success during adolescence as was cited in a previous study (Feldt et al. 2005) was signified by overall academic performance. In addition, grades in 8th grade (age 15) were used to foster recollections of the same period as in other questions about home environment during adolescence since the response would be based on recollection. Responses to the question “When you were in the 8th grade, what were your grades like compared to other students?” were tallied in the 5 categories of “at the top,” “higher than others,” “in the middle,” “lower than others,” and “at the bottom.” In addition, individuals who responded that they did not know and individuals who failed to respond were combined into 1 category, so 6 categories in total served as variables.
2.2.2.4 Level of education
Responses to the question “What type of school did you last attend (or are currently attending)? ” were tallied in the 6 categories of “middle school,”
“high school,” “technical school (vocational school), ” “junior college・technical college (5-year program), ” “university”, and “graduate school.” “Middle school”
and “high school” to create a new category, “high school or lower,” resulting in 5 categories.
2.2.3 Current occupation and employment status
Current occupation and employment status were determined at time 1. Open-ended responses regarding being employed were coded based on occupational subcategories in SSM survey in 1995 and categorized based on occupational categories as
“a specialized or technical profession,” “white collar
(office work, sales, or a service position), ” or “blue collar (shop floor position, technician, transportation, security, or agriculture/forestry/fishing). ” Employment status was tallied by combining “full-time staff/regular employee” and “family business” into the category of “full-time employment” while
“part-time, contract, or temporary work,” “temporary
staff,” “contractor,” and “side job/home-based work” were combined into the category of “part-time employment.” “Manager/executive” and “self-employed/freelance” were combined into 1 category. scale. This scale was developed in Japanese, and
its reliability and validity has been demonstrated (Togari, et al. 2007). Responses to the 3 statements
“I am able to find a solution to everyday problems
and difficulties,” “I think that itʼs worthwhile to take some of lifeʼs problems and difficulties head-on,” and
“I think that I understand and can predict everyday
problems and difficulties” were rated on a 7-point semantic differential scale from “almost always” to
“never.”
Cronbachʼs α was .83 at time 1 and .84 at time 2. Descriptive statistics were shown in Table2.
2.2.2 Socioeconomic conditions during adolescence
Socioeconomic conditions were measured at time 1. 2.2.2.1 The father s occupation at age 15
The occupation of an individualʼs father at age 15 served to indicate the familyʼs socioeconomic status during adolescence. The age of 15 was used to coincide with the time period in other questions about adolescence since the response would be based on recollection; this was done to improve survey accuracy. Open-ended responses regarding the occupation of an individualʼs father at age 15 were coded based on occupational subcategories in social stratification and morbidity (SSM) survey in Japan in 1995 and categorized based on occupational categories. In addition, a combined variable was created to include individuals with a father who was absent, individuals who responded that they did not know, and individuals who failed to answer. Specialized or technical professions and management were combined into 1 category, office work, sales, and service positions were combined into the category of white-collar positions while shop floor positions, technicians, transportation, and security were combined into the category of blue-collar positions. Individuals with a father who was absent or unemployed were combined into 1 category and individuals who responded that they did not know and individuals who failed to respond were combined into 1 category. Combined variables consisting of 5 categories in total were used.
2.2.2.2 The family s financial situation at age 15
Like the fatherʼs profession, the familyʼs financial situation at age 15 was determined. Like the fatherʼs profession at age 15, the age of 15 was used to foster recollections of the same period as in other questions given that the response would be based on recollection. Responses to the question “Which of the following describes your familyʼs circumstances when you were 15 years old?” were tallied on a 5-point scale from
situation at age 15
Model 3: SOC = parentsʼ occupation+familyʼs financial situation at age 15+subjective academic performance in 8thgrade+level of education
Model 4: SOC = parentsʼ occupation+familyʼs financial situation at age 15+subjective academic performance in 8thgrade + level of education +current occupation
Model 5: SOC = parentsʼ occupation+familyʼs financial situation at age 15+subjective academic performance in 8thgrade + level of education +current occupation+
current subjective financial situation
Subjective financial situation and equivalent income are closely correlated, so equivalent income was not entered in regression equations. A separate equation was devised.
Model 5-1: SOC = parentsʼ occupation+familyʼs financial situation at age 15+subjective academic performance in 8th grade + level of education +current
occupation+current equivalent income
A model with the SOC at time 1 entered in regression equations was examined last to ascertain associations with changes in the intervening 2 years. Model 6: SOC = parentsʼ occupation+familyʼs financial situation at age 15+subjective academic performance in 8thgrade + level of education +current occupation+
current subjective financial situation + SOC at time 1 For analysis, age served as an adjustment variable. IBM SPSS®version 22.0 was used for analysis.
3
Results
3.1 Distribution of SOC scores in terms of various factors (Table 3)
Bivariate relationships between social factors and the SOC score were examined by comparing the average score by category. Significant differences in terms of sex were not noted. Significant differences in terms of current occupation were not noted except a relations between housewife and blue-collar-part-time..
3.2 Association between SOC and local conditions during childhood, academic success, and level of education (Table 4-1 and Table4-2)
In terms of sex, both men and women with a father who had a “blue-collar position” at age 15 had a low SOC compared to men and women with a father who had “professions or management position.” An association with SOC was noted when the familyʼs financial situation at age 15 was entered (model2), but the association disappeared when academic performance and level of education were entered. The possibility that the fatherʼs occupation at age 15, and In addition, unemployed individuals were tallied in
the 3 categories of students, homemakers, and other.
“Homemakers” who were married were treated as “housewives,” and those who were unmarried or who
answered “other” were treated as “unemployed.” The above variables were combined to create combined variables consisting of 10 categories in total: “manager/executive, self-employed/freelance,”
“specialized or technical profession, full-time
employment,” “specialized or technical profession, part-time employment,” “white collar, full-time employment,” “white collar, part-time employment,”
“blue collar, full-time employment,” “blue collar,
part-time employment,” “housewife,” “unemployed,” and
“student.”
2.2.4 Current financial situation
An individualʼs current financial situation was determined at time 1. An individualʼs subjective financial situation was determined using responses to the question “Which of the following describes your familyʼs current circumstances?” tallied on a 5-point scale of “well off,” “somewhat well off,” “average,”
“somewhat worse off,” and “worse off.” For analysis,
responses were tallied in the 3 categories of “well off/ somewhat well off,” “average,” and “somewhat worse off/worse off.”
Current household income was equivalent income, obtained by dividing household income by the square root of the number of members of the household. Equivalent income was an income in the top 25% (over 4.4 million yen and up), an income in the bottom 25% (less than 2.1 million yen), or a medium income in between the two. Responses from individuals who failed to respond or who responded that they did not know were combined into 1 category, so there were 4 categories in total. According to statistics from the Japanese Government, the average equivalent income for Japanese in 2008 was 3.4 million yen.
2.3 Statistical analysis
Bivariate relationships were examined by sex using one-way analysis of variance (ANOVA) and multiple comparisons (Tukey procedure). To ascertain relationships between variables and determinants, hierarchical regression analysis (step-up procedure) by fixed effect model was performed, and restricted maximum likelihood estimation was conducted with an individualʼs SOC score at time 2 as a dependent variable. The following regression equations were used:
Model 1: SOC = parentsʼ occupation
both male and female in model3. However, there were significant differences in bivariate analysis in male group (Table 4-1). Therefore, educational level may be proxy indicator for subjective academic performance in relationship with SOC.
particularly when that occupation is a “blue-collar profession,” may be associated with SOC through the familyʼs financial situation at age 15 was examined. In terms of sex, the subjective academic performance in 8th grade was associated with the SOC of both men and women in model3. The other hand, levels of education did not related to SOC of
Table 3 SOC score1)
distributions by socioeconomic factors
male female
mean (SD) mean (SD)
The fatherʼs occupation at age 15
professions/management 15.2 (3.1) 15.2 (3.0)
white-collar positions 14.8 (3.1) 15.1 (2.9)
blue-collar positions 14.8 (3.3) 14.6 (3.2)
absent/unemployed 14.7 (3.7) 14.8 (3.2)
DK/missing 14.4 (4.3) 14.1 (3.8)
Familyʼs financial situation at age 15
well off/somewhat well off 15.5 (3.2) 15.5 (2.9)
average 14.8 (3.2) 14.7 (3.1)
somewhat worse off/worse off 14.4 (3.6) 14.2 (3.3)
DK/missing 13.0 (4.4) 13.1 (3.9)
Subjective academic performance in 8th grade1)
at the top 15.9 (2.9) 15.6 (3.1)
higher than others 15.5 (3.0) 15.4 (2.8)
in the middle 14.6 (3.0) 14.6 (2.9)
lower than others 14.1 (3.6) 14.3 (3.2)
at the bottom 13.7 (3.9) 13.7 (3.9)
DK/missing 13.0 (3.4) 13.9 (3.6)
Level of education
high school or lower 14.1 (3.7) 14.3 (3.4)
vocational school 14.5 (3.3) 14.7 (2.9)
junior college/technical college 15.2 (3.6) 14.8 (2.9)
university 15.3 (2.9) 15.2 (2.9)
graduate school 15.9 (2.9) 15.6 (3.3)
Current occupation and employment status
manager/executive 15.9 (3.1) 15.4 (3.1)
professional and fulltime 15.6 (2.7) 14.7 (2.9) professional and parttime 16.0 (2.3) 15.6 (2.5) white-collar and fulltime 15.1 (2.9) 14.9 (2.9) white-collar and parttime 14.6 (3.5) 14.7 (3.2)
blue-collar and filltime 14.2 (3.3) 13.9 (3.2)
blue-collar andparttime 14.5 (4.2) 13.8 (3.8)
students 14.8 (3.5) 14.9 (2.9)
housewife 15.1 (3.1)
unemployed 13.0 (4.2) 14.2 (3.3)
Current subjective financial situation1)
well off/somewhat well off 15.5 (3.1) 15.6 (2.9)
average 14.8 (3.2) 14.7 (3.0)
somewhat worse off/worse off 14.2 (3.7) 14.0 (3.5) Current household income (equivalent income)
less than 2.1 million yen 14.6 (3.4) 14.4 (3.3)
medium income 15.3 (3.0) 15.1 (2.9)
over 4.4 million yen and up 15.2 (3.2) 15.4 (3.0)
DK/missing 14.0 (3.5) 14.3 (3.2)
Total 14.8 (3.3) 14.8 (3.1)
DK: do not know, SOC: sense of coherence
Note. Differences connected by solid line are significant (p<0.05). 1) Time 2 SOC score
Table 4−1 Hierarchical regression analysisin regard to effects of family status and education on SOC─fixed
effect model (male)
model1 model2 model3
B (95% CI) p B (95% CI) p B (95% CI) p
Intercept 14.83 (13.78, 15.89) <0.01 15.05 (13.99, 16.11) <0.01 15.25 (13.99, 16.52) <0.01 The fatherʼs occupation at age 15
professions/management ref. ref. ref.
white-collar positions −0.49 (−1.01, 0.04) 0.07 −0.32 (−0.85, 0.21) 0.23 −0.08 (−0.61, 0.44) 0.75 blue-collar positions −0.50 (−1.00, 0.00) 0.05 −0.29 (−0.79, 0.22) 0.27 0.13 (−0.38, 0.64) 0.62 absent/unemployed −0.53 (−1.48, 0.42) 0.28 −0.03 (−1.01, 0.96) 0.96 0.44 (−0.52, 1.41) 0.37 DK/missing −0.79 (−1.84, 0.25) 0.14 −0.35 (−1.40, 0.71) 0.52 0.28 (−0.80, 1.35) 0.61 Familyʼs financial situation at age 15
well off/somewhat well off ref. ref.
average −0.70 (−1.16, −0.24) <0.01 −0.63 (−1.08, −0.18) 0.01
somewhat worse off/worse off −1.03 (−1.64, −0.42) <0.01 −0.78 (−1.38, −0.17) 0.01
DK/missing −2.48 (−3.94, −1.02) <0.01 −2.25 (−3.83, −0.66) 0.01
Subjective academic performance in 8th grade
at the top ref.
higher than others −0.35 (−0.90, 0.20) 0.21
in the middle −1.07 (−1.63, −0.52) <0.01
lower than others −1.56 (−2.22, −0.91) <0.01
at the bottom −1.92 (−2.66, −1.18) <0.01
DK/missing −2.32 (−3.95, −0.70) 0.01
Level of education
high school or lower ref.
vocational school 0.21 (−0.31, 0.74) 0.42
junior college・technical college (5-year program) 0.43 (−0.50, 1.36) 0.36
university 0.34 (−0.15, 0.84) 0.18
graduate school 0.81 (−0.03, 1.64) 0.06
−2 log likelihood 6940.96 6922.89 6840.15
SOC: sense of coherence, DK: do not know, CI: confidence intervals. All models were adjusted for age.
Dependent variable: time 2 SOC score
Table 4−2 Hierarchical regression analysisin regard to effects of family status and education on SOC─fixed
effect model (female)
model1 model2 model3
B (95% CI) p B (95% CI) p B (95% CI) p
Intercept 14.79 (13.95, 15.63) <0.01 15.05 (14.20, 15.90) <0.01 15.17 (14.10, 16.24) <0.01 The fatherʼs occupation at age 15
professions/management ref. ref. ref.
white-collar positions −0.14 (−0.57, 0.30) 0.54 −0.03 (−0.47, 0.41) 0.89 0.06 (−0.38, 0.50) 0.79 blue-collar positions −0.66 (−1.07, −0.26) <0.01 −0.43 (−0.84, −0.02) 0.04 −0.25 (−0.68, 0.18) 0.25 absent/unemployed −0.44 (−1.27, 0.38) 0.29 −0.08 (−0.91, 0.76) 0.86 0.23 (−0.60, 1.06) 0.59 DK/missing −1.10 (−1.85, −0.34) 0.01 −0.73 (−1.50, 0.03) 0.06 −0.29 (−1.07, 0.50) 0.47 Familyʼs financial situation at age 15
well off/somewhat well off ref. ref.
average −0.71 (−1.10, −0.33) <0.01 −0.60 (−0.98, −0.21) <0.01
somewhat worse off/worse off −1.18 (−1.71, −0.65) <0.01 −1.03 (−1.56, −0.50) <0.01
DK/missing −2.29 (−3.54, −1.03) <0.01 −1.97 (−3.31, −0.63) <0.01
Subjective academic performance in 8th grade
at the top ref.
higher than others −0.11 (−0.60, 0.37) 0.64
in the middle −0.88 (−1.37, −0.39) <0.01
lower than others −1.08 (−1.67, −0.49) <0.01
at the bottom −1.65 (−2.38, −0.91) <0.01
DK/missing −1.12 (−2.15, −0.10) 0.03
Level of education
high school or lower ref.
vocational school 0.18 (−0.24, 0.61) 0.40
junior college・technical college (5-year program) 0.05 (−0.38, 0.48) 0.81
university 0.14 (−0.33, 0.61) 0.56
graduate school 0.23 (−0.88, 1.33) 0.69
−2 log likelihood 8585.40 8559.69 8476.78
SOC: sense of coherence, DK: do not know, CI: confidence intervals. All models were adjusted for age.
Table 5−1 Hierarchical regression analysisin regard to effects of current socio economic statuses on SOC─
fixed effect model (male)
model4 model5 model5−1
B (95% CI) p B (95% CI) p B (95% CI) p
Intercept 16.93 (15.34, 18.52) <0.01 17.08 (15.49, 18.68) <0.01 17.33 (15.67, 18.99) <0.01 Current occupation and employment status
manager/executive ref. ref. ref.
professional and fulltime −0.70 (−1.47, 0.07) 0.08 −0.70 (−1.47, 0.07) 0.07 −0.74 (−1.51, 0.03) 0.06 professional and parttime −0.37 (−1.84, 1.11) 0.63 −0.34 (−1.81, 1.14) 0.65 −0.32 (−1.79, 1.15) 0.67 white-collar and fulltime −0.90 (−1.59, −0.21) 0.01 −0.86 (−1.54, −0.17) 0.01 −0.92 (−1.61, −0.24) 0.01 white-collar and parttime −1.18 (−2.31, −0.06) 0.04 −0.99 (−2.11, 0.14) 0.09 −1.06 (−2.18, 0.06) 0.06 blue-collar and filltime −1.31 (−2.01, −0.60) <0.01 −1.24 (−1.94, −0.54) <0.01 −1.30 (−2.00, −0.60) <0.01 blue-collar andparttime −1.27 (−2.28, −0.26) 0.01 −1.17 (−2.17, −0.16) 0.02 −1.21 (−2.22, −0.20) 0.02 students −1.45 (−2.43, −0.48) <0.01 −1.45 (−2.42, −0.48) <0.01 −1.31 (−2.28, −0.33) 0.01 unemployed −2.53 (−3.52, −1.55) <0.01 −2.32 (−3.32, −1.32) <0.01 −2.22 (−3.22, −1.23) <0.01 Current subjective financial situation
well off/somewhat well off ref.
average −0.41 (−0.89, 0.06) 0.09
somewhat worse off/worse off −0.81 (−1.42, −0.20) 0.01
Current household income (equivalent income)
less than 2.1 million yen ref.
medium income 0.37 (−0.17, 0.92) 0.18
over 4.4 million yen and up −0.09 (−0.70, 0.53) 0.78
DK/missing −0.65 (−1.22, −0.07) 0.03
−2 log likelihood 6743.75 6707.98 6727.27
SOC: sense of coherence, DK: do not know, CI: confidence intervals.
Note. All models were adjusted for age, fatherʼs occupation at age 15, familyʼs financial situation at age 15, subjective academic performance in 8th grade and level of education.
Dependent variable: time 2 SOC score
Table 5−2 Hierarchical regression analysis in regard to effects of current socio economic statuses on SOC─
fixed effect model (female)
model4 model5 model5−1
B (95% CI) p B (95% CI) p B (95% CI) p
Intercept 16.06 (14.40, 17.71) <0.01 16.24 (14.59, 17.90) <0.01 15.91 (14.19, 17.62) <0.01 Current occupation and employment status
manager/executive ref. ref. ref.
professional and fulltime −0.96 (−2.20, 0.28) 0.13 −0.86 (−2.09, 0.38) 0.17 −0.92 (−2.15, 0.31) 0.14 professional and parttime 0.05 (−1.28, 1.38) 0.94 0.24 (−1.09, 1.57) 0.73 0.13 (−1.20, 1.47) 0.85 white-collar and fulltime −0.57 (−1.76, 0.62) 0.35 −0.45 (−1.63, 0.74) 0.46 −0.54 (−1.72, 0.65) 0.38 white-collar and parttime −0.70 (−1.89, 0.50) 0.25 −0.48 (−1.67, 0.72) 0.43 −0.58 (−1.78, 0.61) 0.34 blue-collar and filltime −1.32 (−2.76, 0.12) 0.07 −1.18 (−2.61, 0.26) 0.11 −1.24 (−2.67, 0.20) 0.09 blue-collar andparttime −1.14 (−2.43, 0.15) 0.08 −0.95 (−2.24, 0.34) 0.15 −1.06 (−2.35, 0.24) 0.11 students −0.77 (−2.09, 0.56) 0.26 −0.60 (−1.93, 0.72) 0.37 −0.63 (−1.95, 0.69) 0.35 students −0.42 (−1.60, 0.76) 0.49 −0.28 (−1.46, 0.90) 0.65 −0.34 (−1.52, 0.85) 0.58 unemployed −1.14 (−2.66, 0.37) 0.14 −0.93 (−2.45, 0.58) 0.23 −1.02 (−2.53, 0.49) 0.19 Current subjective financial situation
well off/somewhat well off ref.
average −0.55 (−0.95, −0.16) 0.01
somewhat worse off/worse off −1.03 (−1.55, −0.50) <0.01
Current household income (equivalent income)
less than 2.1 million yen ref.
medium income 0.50 (0.06, 0.93) 0.03
over 4.4 million yen and up 0.61 (0.09, 1.13) 0.02
DK/missing −0.06 (−0.52, 0.39) 0.78
−2 log likelihood 8417.73 8376.98 8407.48
SOC: sense of coherence, DK: do not know, CI: confidence intervals.
Note. All models were adjusted for age, fatherʼs occupation at age 15, familyʼs financial situation at age 15, subjective academic performance in 8th grade and level of education.
3.3 Association between SOC and current occupa- tion and financial situation (Table 5-1 and Table 5-2)
Both men and women who were employed full-time in a blue-collar or who were unemployed had a lower SOC than manager or executive. Individuals employed full-time and part-time in a white-collar had a somewhat lower SOC only in male. A low SOC was noted only for men employed full-time in a blue-collar profession. Men who were unemployed had a low SOC, regardless of current financial situation. In model 5, the significant association with men
employed part-time in a white-collar disappeared (Table 5-1).
In terms of their current financial situation, both men and women had a lower SOC the more they were somewhat worse off/worse off. In terms of equivalent income, female participants with low income had a low SOC compared to participants with a medium or high income.
3.4 Association with time2 SOC controlled for time1 SOC (Table 6)
In model 6, SOC decreased more for individuals
Table 6 Multiple regression analysis in regard to effects of social factors on Time2 SOC controlled
for Time1 SOC─fixed effect model
model6 for male model6 for female
B (95% CI) p B (95% CI) p
Intercept 7.64 (6.12, 9.17) <0.01 7.82 (6.26, 9.37) <0.01
The fatherʼs occupation at age 15
professions/management ref. ref.
white-collar positions 0.05 (−0.38, 0.48) 0.83 −0.02 (−0.39, 0.36) 0.92 blue-collar positions 0.11 (−0.31, 0.53) 0.60 −0.15 (−0.51, 0.21) 0.41
absent/unemployed 0.33 (−0.47, 1.12) 0.43 −0.09 (−0.80, 0.61) 0.80
DK/missing 0.95 (0.05, 1.86) 0.04 −0.19 (−0.87, 0.48) 0.58
Familyʼs financial situation at age 15
well off/somewhat well off ref. ref.
average −0.08 (−0.48, 0.33) 0.71 −0.07 (−0.43, 0.28) 0.68
somewhat worse off/worse off −0.23 (−0.77, 0.30) 0.39 −0.49 (−0.96, −0.02) 0.04
DK/missing −1.25 (−2.62, 0.13) 0.08 −0.72 (−1.88, 0.45) 0.23
Subjective academic performance in 8th grade
at the top ref. ref.
higher than others −0.01 (−0.47, 0.44) 0.95 −0.27 (−0.68, 0.14) 0.20
in the middle −0.30 (−0.76, 0.16) 0.21 −0.64 (−1.06, −0.22) <0.01
lower than others −0.68 (−1.22, −0.13) 0.02 −0.93 (−1.43, −0.42) <0.01
at the bottom −0.57 (−1.19, 0.05) 0.07 −0.95 (−1.58, −0.32) <0.01
DK/missing −1.51 (−2.90, −0.12) 0.03 −0.71 (−1.59, 0.17) 0.11
Level of education
high school or lower ref. ref.
vocational school 0.00 (−0.44, 0.44) 0.99 0.17 (−0.21, 0.55) 0.38
junior college・technical college (5-year program) 0.22 (−0.55, 0.98) 0.57 −0.21 (−0.58, 0.16) 0.27
university 0.10 (−0.33, 0.53) 0.64 −0.12 (−0.53, 0.30) 0.58
graduate school 0.25 (−0.49, 0.98) 0.51 0.09 (−0.88, 1.06) 0.86
Current occupation and employment status
manager/executive ref. ref.
professional and fulltime −0.41 (−1.05, 0.23) 0.21 −0.25 (−1.30, 0.79) 0.64 professional and parttime −0.22 (−1.44, 1.00) 0.72 0.43 (−0.70, 1.56) 0.46 white-collar and fulltime −0.36 (−0.93, 0.21) 0.21 0.21 (−0.80, 1.21) 0.69 white-collar and parttime −0.20 (−1.13, 0.74) 0.68 0.36 (−0.66, 1.37) 0.49 blue-collar and filltime −0.45 (−1.03, 0.14) 0.13 −0.56 (−1.78, 0.66) 0.37 blue-collar andparttime −0.21 (−1.05, 0.64) 0.63 −0.08 (−1.18, 1.02) 0.89
students −0.82 (−1.63, −0.02) 0.05 −0.24 (−1.36, 0.88) 0.67
housewife 0.29 (−0.71, 1.29) 0.57
unemployed −1.12 (−1.96, −0.29) 0.01 0.29 (−1.00, 1.57) 0.66
Current subjective financial situation
well off/somewhat well off ref. ref.
average −0.01 (−0.41, 0.38) 0.95 −0.25 (−0.58, 0.09) 0.15
somewhat worse off/worse off −0.03 (−0.54, 0.48) 0.92 −0.27 (−0.72, 0.18) 0.24
Time1 SOC 0.55 (0.50, 0.59) <0.01 0.51 (0.47, 0.55) <0.01
−2 log likelihood 7796.90 6203.85
SOC: sense of coherence, DK: do not know, CI: confidence intervals. All models were adjusted for age.
in lower academic performance in 8th grade than for individuals in higher. Nevertheless, these results were independent of other current socioeconomic statuses. In addition, SOC decreased more for the unemployed than for individuals in a profession or management. Moreover, financial situation did not affect SOC change.
4
Discussion
This study examined several questions. The first was how upbringing during adolescence, academic success, and later level of education contribute to subsequent SOC. The second was how current occupation and financial situation contribute to current SOC. The third was which social factors are associated with changes in SOC over a period of 2 years. The answers to these three questions will not be discussed.
4.1 SOC and upbringing during adolescence, success in school, and level of education
There were four findings regarding how upbringing during adolescence, success in school, and later level of education contribute to subsequent SOC.
The first was that having a family that was financially well off during adolescence and being successful in school were directly associated with current SOC for both men and women, regardless of later level of education. This was true regardless of age group. The fact that being in an affluent family during adolescence subsequently fostered a high SOC corroborates hypothesis of this study. This direct effect corroborates the results of previous studies in Finland (Volanen et al. 2004; Feldt et al. 2005; Volanen et al. 2006) since a similar association was found in Japan.
Good academic performance (subjectively assessed), indicating success in school during adolescence, was directly associated with current SOC, regardless of level of education, later occupation, and financial situation. This differed from a previous study in Finland (Feldt et al. 2005) indicating that academic performance, assessed by scores on objective academic achievement tests, mediated SOC through later level of education and occupation. The current study noted a direct effect regardless of later level of education and occupation. Nevertheless, the current results differ from those of Feldt et al. (2005). There may be two reasons why a direct effect was noted here regardless of later level of education and occupation. The first is that performance in school may be a more significant life experience in Japan
than in Finland. This point needs to be carefully studied in the future in light of the nature of secondary education in the two countries. The second reason for noting a direct effect may be a problem with survey methodology. Feldt and colleagues used scores on objective academic achievement tests while the current study used self-assessment based on recollections. Survey bias coinciding with the use on recollections may have had an effect.
The second finding was that the fatherʼs occupation was not directly associated with current SOC for either men or women. Current SOC was indirectly affected by academic performance and level of education. The mechanisms differed for each age group, but an indirect association was noted. Thus, having parents with a prestigious occupation during adolescence was directly associated with a high current SOC while upbringing was indirectly associated with a high current SOC. Regardless of the age, the occupation of an individualʼs father indirectly affected an individualʼs current SOC through later level of education and occupation. This is similar to the results of Lundberg (1997) and Feldt et al. (2005). Feldt and colleagues cited the fact that Finland, where their study place, is the Northern European country with the least socioeconomic disparity as a reason why they noted no direct effect. Lundberg stated that factors for development of an SOC are not dictated by the familyʼs socioeconomic environmental factors during adolescence that started in childhood, as Antonovsky assumed. Rather, Lundbergʼs framework fully considered the possibility that SOC varies due to an individualʼs later occupation and more recent life experiences, as reflected in his analytical framework. In actuality, Chen & Matthews (2001) empirically examined the association between childhood socioeconomic status (SES) and total peripheral resistance and systolic blood pressure (BP) in stressful situations. They indicated that subjects with a high SES had a low total peripheral resistance and low systolic BP and they indicated that hostile intent and feelings of anger mediated the relationship between SES and total peripheral resistance and systolic BP. Their results indicate that resistance to stress, which is akin to SOC, is determined by SES and that less resistance may be linked to an increased risk of subsequently developing heart disease, corroborating the current results. Antonovsky himself described experiences during adolescence as experiences vital to the development of an SOC. However, he later asserted that SOC may be
governed by life experiences provided by GRRs, such as oneʼs occupation (Antonovsky 1987=2001: 138-41). He also asserted that the level of meaningfulness, a component of SOC, in oneʼs life is linked to variations in SOC evident as increases and decreases in the other 2 components (Antonovsky 1987=2001: 24-7). In addition, he suggested that SOC during adolescence is unstable since it is in the process of developing (Antonovsky 1987=2001: 124). In actuality, one study reported that the SOC of younger individuals was less stable than that of the middle-aged (Feldt et al. 2007). Thus, the current study corroborates Lundbergʼs view (Lundberg 1997).
The third finding was that level of education had an indirect association, through subjective academic performance, occupation and current financial situation, affecting the SOC of both men and women. Among the research that has examined an individualʼs level of education and SOC, a study of women that controlled for later occupation indicated that an individualʼs level of education had a direct effect on SOC (Grøholt et al. 2003) while another study that controlled for sex indicated an indirect effect on SOC via occupation (Feldt et al. 2005). As to why no direct effect occurred, Feldt and colleagues stated that Finland was the Northern European country with the greatest equality of educational opportunities; they also mentioned the fact that having a high level of education is probably not a major GRR. Although a large percentage of individuals in Japan tend to continue on to higher education, e.g. university, having a high level of education while in a company is not necessarily linked to high pay; this reality has been reported. Thus, having a high level of education in Japan is not necessarily a powerful GRR particularly for women, as Feldt et al. (2005) noted. In the current study, level of education did not surface as a direct determinant of SOC.
The fourth and final finding was that having a father who was absent or unemployed contributed to a certain level of SOC for both men and women and regardless of age group; this level of SOC was no different than that of individuals in a specialized or management position. From the perspective of hypotheses on development of an SOC, having a father who was absent or unemployed is a situation that hampers life experiences that would help to foster an SOC. That said, results of this study revealed no indirect association. This can potentially be explained by the hypothesis (Antonovsky 1987=2001: 195-96)
that an individual encounters stressful life events and chronic stressors, another route to developing an SOC, and successfully copes with them, enhancing SOC itself. Having a father who was absent or unemployed during adolescence is a chronic stressor. Successfully coping with this stressor may provide some level of SOC. That said, the possibility that the participants in this study included a number of individuals who had successfully coped was fully considered, so generalization must be done carefully. The current results, as well as the life courses of individuals whose father who was absent or unemployed, need to be studied in detail in the future.
4.2 SOC and current occupation and financial situation
There were four findings in response to the question about how current occupation and financial situation contribute to current SOC.
The first was that being employed fulltime and part-time in a blue-collar profession fostered a low SOC for men, regardless of the familyʼs financial situation during adolescence and the individualʼs level of education. Being so employed was indirectly associated with a low SOC through an individualʼs current financial situation. Being in a blue-collar profession is linked to a low SOC, as previous studies noted (Lundberg 1997; Volanen et al. 2004; Smith et al. 2003; Nilsson et al. 2003). As described by hypothesis 3 of the current study, being employed part-time in a blue-collar profession resulted in a low SOC. In all of the age groups, being so employed was associated with SOC through current financial situation. The issue of whether these workers were affected by financial difficulties has been examined. Poor health has been reported in individuals employed part-time (Tsutsumi 2006; Kivimäki et al. 2003; Virtanen et al. 2005). However, there are concerns about various health problems and problems adapting occurring in individuals employed part-time and particularly in blue-collar workers since they have a low SOC. Detailed examination of these workers is needed. The second finding was that being unemployed directly fostered a low SOC for men. In addition, results revealed that SOC may decrease in such individuals. Evidence comes from Antonovskyʼs hypothesis (Antonovsky 1987=2001: 129-36) that life experiences in which oneʼs situation is unstable, one has no opportunities to do complex work and one cannot participate in socially meaningful decision-making, i.e. being unemployed, are linked to a lower
SOC. Additional evidence comes from previous studies (Volanen et al. 2004; 2006) indicating that both men and women who are unemployed have a low SOC compared to employed individuals.
The third finding was that for only men being employed full-time or part-time in a blue-collar or white-collar profession fostered a low SOC directly or indirectly through current financial situation. Differences between women occupations were not necessarily noted, so the issue of whether women are in a situation in which they cannot enjoy life experiences needed to shape an SOC despite being in stable and prestigious occupation was examined. Results of previous studies mostly in Northern Europe differed widely for women in different professions, so employment conditions for women in Japan should be studied further in the future.
There are several reasons why being employed blue-collar or white-collar profession directly fostered a low SOC. Despite establishing oneʼs independence as a professional and having greater job responsibility
“early in oneʼs career,” being so employed may
inhibit development of an SOC. This is because of life experiences with part-time employment that is unstable and that involves little job responsibility, compared to a specialized or technical profession, and because of life experiences that only come from being in a blue-collar profession that offers few opportunities for socially meaningful decision-making or to be assigned complex work. However, this was true for other age groups and particularly for the 35-40 age group.
The fourth finding was that being financially well off right now was associated with a good current SOC for both men and women and regardless of age group while being financially worse off was associated with a low SOC. When equivalent income was entered, an association between a low income and a low SOC was noted for both men and women and in all age groups. SOC tended to be higher the more financially well off an individual was. These results are similar to those from a previous study regarding the association between household income (Smith et al. 2003) and SOC. An individualʼs current financial situation is a factor that contributes to the individualʼs SOC, corroborating hypothesis 4 of the current study. 4.3 Theoretical implications of this study
This study has several Theoretical and policy implications.
The first is its contribution to the concept of how an SOC develops. This study essentially corroborates Antonovskyʼs concept of the development of an SOC. In other words, this study reaffirms the fact that socioeconomic conditions from adolescence to adulthood, as Antonovsky cited, are an important part of the development of an SOC.
The second implication of this study is that success in school during adolescence, which Antonovsky did not mention, is an important part of the development of an SOC. Work in school primarily in academic form is a powerful factor that shapes an SOC. Thus, attention needs to be given to success in school during adolescence when studying the development of an SOC. In addition, the importance of adapting to life at school from school age to adolescence was underscored since school constitutes a key setting in everyday life.
The third implication of this study is that although parentsʼ occupation and an individualʼs level of education are GRRs that provide life experiences promoting the development of an SOC, they are not necessarily determinants in that process. Rather, they have something of an indirect effect. Development of an SOC is readily affected by current GRRs and particularly occupation and financial status. Thus, SOC gradually develops as it is affected by conditions at the given moment.
The fourth implication of this study is that SOC is likely affected by social factors such as socioeconomic status, so the salutogenic model stands as a way to explain mechanisms of class disparities and inequality in health. In other words, the relationship between socioeconomic disparities and health exists via SOC, linking health disparities and inequality. That said, SOC buffers the effects of socioeconomic disparities on health, so mechanisms need to be further established by studies with a longitudinal design in the future. 4.4 Significance and limitations of this study and
topics for the future
This study is the first in Japan to examine factors for development and determinants of an SOC through a large-scale population survey of average adults. Given the dearth of studies on factors for development and determinants of an SOC, this study is important because it clearly indicated an association between SOC and social conditions, which are GRRs in adolescence and adulthood. Specifically, success as gauged by self-assessment of academic performance during adolescence was directly associated with SOC regardless of sex and age and irrespective of later