Initial Report “IRIDeS Fact-finding missions
to Philippines”
著者
International Research Institute of Disaster
Science (IRIDeS) Tohoku University
page range
1-107
year
2014-05-17
Initial
Report
International Research Institute of Disaster Science (IRIDeS)
17 May 2014
“IRIDeS Fact-finding missions to Philippines”
TOHOKU University
2014
iii
INITIAL REPORT of IRIDeS Fact-finding mission to Philippines
IRIDeS Task Force Team
Hazard and Risk Evaluation Research Division:
Prof. F. Imamura (Team leader), Prof. A. Mano, Prof. S. Koshimura, Dr. K. Goto, Dr. J.D. Bricker, Dr. E. Mas, Dr. D. Sugawara, Dr. V. Roeber, Dr. S. Kure, and Ms. M. Yasuda
Human and Social Response Research Division:
Prof. T. Muramoto, Dr. M. Sugiura, Dr. K. Iuchi, and Dr. R. Nouchi
Regional and Urban Reconstruction Research Division:
Prof. O. Murao, Prof. S. Tadokoro, Dr. K. Hanaoka, Dr. E. Takeuchi, and Dr. C. J. Yi
Disaster Science Division: Prof. T. Iwasaki
Disaster Medical Science Division:
Prof. S. Egawa, Prof. T. Hattori, Prof. H. Tomita, Dr. H. Chagan-Yasutan, and Dr. Motoki Usuzawa
Disaster Information Management and Public Collaboration Division:
Prof. Y. Ono, Dr. T. Izumi, Dr. M. Matsumoto, Dr. M. Kuri, Dr. S. Sato, Dr. K. Sugiyasu, and Dr. Y. Jibiki
Endowed Research Division: Dr. A. Suppasri
Public Relations Office: Ms. Y. Suzuki
Philippines Counterparts:
Dr. S. Espinueva (PAGASA), Dr. C. Lao (PAGASA), Dr. M. Quimpo (DPWH), Ms. M. Manio (NDRRMC), Prof. C. Espina (UP), Mr. K. Taberdo (UP), Mr. P. Tupaz (UP), Mr. C. Gerona (UP), Dr. E. Telan (SLH), Dr. W. Go (SLH), Dr. M. Go (DOH), Dr. C. Banatin (DOH), and Mr. U-Nichols A. Manalo (Tohoku University)
UK Counterparts:
v
IRIDeS thanks to:
Prof. Arata Hirakawa (Former IRIDeS Director, now president of Miyagigakuin Women’s University) Dr. Romeo S. Momo and Mr. Rolando M. Asis (DPWH)
Dr. Vic Malano (PAGASA)
Mr. Gerald V. Paragas, Mr. Boy Naputo, and Mr. Clinton Price (Tacloban City) Mr. Marco Paolo Pajares (Municipality of Palo)
Ms. Cecile Mae M. Ocado and Ms. Regilda M. De La Cruz (Municipality of Tanauan) Mr. Elpidio C. Nogales and Ms. Nemesia B. Cuerdo (NSO)
Mr. Masayuki Harigai, Mr. Akio Isomata, and Mr. Akio Yonezawa (Embassy of Japan in the Philippines) Mr. Kimio Takeya, Mr. Masami Fuwa, Mr. Eiji Otsuki, and Mr. Hayato Nakamura (JICA)
Mr. Yukio Mabuchi (Pacific Consultants Co., LTD.) The National Mapping and Resource Information Authority National Statistics Office
Community-led Disaster Rehabilitation Project Kawit Barangay Office
Municipality of Daanbantayan Municipality of Basey
We owe special gratitude to the late Dr. Susan Espinueva, chief of the Philippine Atmospheric, Geophysical and Astronomical Services Administration Hydro-meteorological Division (PAGASA). Dr. Espinueva’s support of the IRIDeS survey made this work possible. Her kindness and passion were a gift to the scientific community, and she will be sorely missed.
vi
Contents
1. Executive Summary ・・・・・・・・・・・・・・・・・・・・・・・・・・・・・・・・・・・1
2. Summary of Typhoon Haiyan ・・・・・・・・・・・・・・・・・・・・・・・・・・・・・・・5
Shuichi Kure 2.1 Track of Typhoon Haiyan
2.2 Ground Observations 2.3 Summary of Damage 2.4 Evacuation Warning
3. Initial damage mappings by satellite Images ・・・・・・・・・・・・・・・・・・・・・・・・13
Erick Mas and Bruno Adriano 3.1 Rapid Damage Assessment
3.2 Rapid Inundation Mapping
4. Storm Surge Simulation ・・・・・・・・・・・・・・・・・・・・・・・・・・・・・・・・・18
Jeremy D. Bricker 4.1 Methodology
4.2 Results and Discussion
5. IRIDeS fact-finding mission, Hazard and Damage Evaluation Team ・・・・・・・・・・・・・・22
Jeremy D. Bricker, Shuichi Kure, Erick Mas, and Carine J.YI 5.1 Missions and local collaborators
5.2 Inundation map
5.3 Northern extent of surge 5.4 Types of damage in Tacloban 5.5 Wind damage
5.6 Eastern Samar Damage 5.7 Seawall Damage
5.8 Conclusions and Recommendations
6. IRIDeS fact-finding mission, Warning and Evacuation Assessment Team ・・・・・・・・・・・・44
Yasuhito Jibiki and Miwa Kuri 6.1 Purpose
6.2 Method: Social survey
vii 6.4 Preliminary summary
7. IRIDeS fact-finding mission, Disaster Medical Science Team ・・・・・・・・・・・・・・・・・52
Shinichi Egawa, Toshio Hattori, Hiroaki Tomita, and Haorile Chagan-Yasutan 7.1 Missions 7.2 Investigations 7.3 Methods 7.4 Results 7.5 Future Perspectives 7.6 Establishment of Partnerships
8. IRIDeS fact-finding mission, Disaster Recovery Team
8.1 Data Acquisition and Field Survey in Cebu and Basey ・・・・・・・・・・・・・・・・・・・・64 Osamu Murao, Kazumasa Hanaoka, and Kazuya Sugiyasu 8.2 The Post-Disaster Phase of Transitional Settlement: A Perspective from Typhoon Haiyan in the Eastern
Philippines ・・・・・・・・・・・・・・・・・・・・・・・・・・・・・・・・・・・・・77 David Alexander, Joanna Faure Walker, Joshua Macabuag, and Anawat Suppasri 8.3 Path to “Build Back Better”: involvement of local stakeholders in future disaster risk reduction and
planning recovery and implementation ・・・・・・・・・・・・・・・・・・・・・・・・・88 Takako Izumi, Kanako Iuchi, and Michimasa Matsumoto
1
1. Executive Summary
Super Typhoon Haiyan, called Yolanda in the Philippines, devastated the Eastern Visayas and part of the Central Visayas on November, 8, 2013. Haiyan caused over 7,000 casualties, displaced over 4 million people, and damaged or destroyed over 1 million houses due to remarkably high wind speed, storm surge and large waves.
The International Research Institute of Disaster Science (IRIDeS), at Tohoku University in Sendai, Japan dispatched several investigating teams from December, 2013 through March, 2014 to gather information from governmental, hospital and research organizations in Manila. In addition, the teams assessed damage in several areas on Leyte and Samar islands with local counterparts. The name of the mission was the “IRIDeS fact-finding mission,” and the IRIDeS survey team consisted of 4 teams; 1) Hazard and Damage Evaluation team, 2) Warning and Evacuation Assessment team, 3) Disaster Medical Science team, and 4) Disaster Recovery team.
The Hazard and Damage Evaluation team first conducted the damage interpretation using satellite images in order to identify severly damaged areas and to provide important information to focus the activities for the on-site field survey (Chapter 3). This kind of rapid damage assessment can contribute actively to emergency response and relief effort allocation and management when disasters impact a large area. In addition, a numerical simulation of the storm surge and large waves using Delft-3D and SWAN with a parametric hurricane model was promptly conducted for Leyte and Samar Islands in order to understand the magnitude and features of surges and waves induced by Haiyan (Chapter 4). From the simulation results, it was found that the water levels were dominated by wind-driven storm surge near Tacloban and by waves in eastern Samar.
During the on-site survey in Leyte and Eastern Samar on January 16 – 24, 2014 (Chapter 5), inundation heights of storm surges and large waves were measured, and a detailed inundation map in Tacloban was developed, mainly based on local interviews with eyewitnesses. For example, storm surge heights up to 6 m were measured near the shoreline in Tacloban and wave runup of up to 12 m were measured in Eastern Samar. In addition, typical damage to houses and seawalls by strong wind, storm surge and high waves in Leyte and Eastern Samar were investigated throughout the survey. Based upon the initial analysis and on-site survey, several problems and recommendations are presented in this report. Data analysis and numerical simulations are still ongoing.
The Warning and Evacuation Assessment team aimed at examining and recording evacuation behavior and information notification in the area affected by Haiyan. A questionnaire survey in Tacloban city and Palo and Tanauan municipalities on Leyte Island was implemented from March 14, 2014 to March 22, 2014 and in total 642 samples were taken. The survey shows that the ratio of evacuation away from home was about 70%. Patterns of evacuation behavior differ with location, gender and age. Although all survey sites are located in the same coastal area, preliminary analysis shows that reasons and clues for evacuation are different at each site.
The Disaster medical science team investigated the immediate medical and public health response, domestic and international medical aid, outbreak of infectious diseases, psychosocial problems and mental health of the affected people in collaboration with medical and public health researchers in the Philippines, WHO, the Department of
2
Health and others to promote collaborative research and publicizing of the results. According to the geographical mapping of the possible hospitals and health related facilities in the affected area, individual visits to health facilities and interviews were very effective for understanding the structural, non-structural and functional damage of health related facilities. They observed the sanitary and health condition of the affected people and also visited international humanitarian assistance agencies. They established and extended the collaborative relationships between IRIDeS and San Lazaro Hospital, DOH, WHO and WPRO, Univ. Philippines Manila and Angeles Univ. to exchange information and knowledge about disaster medicine and public health. They shared their experience of the Great East Japan Earthquake and made recommendations at DOH in a technical discussion to establish safe hospitals as a building last standing in a disaster.
Research on post-disaster recovery needs to track several areas affected by the typhoon in the Philippines for a long time. The Disaster Recovery team organized three groups according to timing of surveys and topics. The first group was in charge of data acquisition necessary to understand the social context of the Philippines, to study long-term recovery phenomena, and to obtain basic information. They obtained statistic data, maps and geospatial data from the Government for IRIDeS’s study. They also conducted field surveys, including building damage records and interviews of affected people and local governments, in Daanbantayan in Cebu, and in Basey on Samar Island. Although some analysis of building damage is in progress, several regional specific problems facing recovery were clarified by the surveys.
The second group conducted a collaborative field survey between UCL-IRDR and Tohoku University-IRIDeS four months after the typhoon. Interviews and accompanying structural engineering surveys of the respondents’ dwellings were conducted for 160 households in 12 coastal barangays. Regarding evacuation, the system of using barangay leaders to disseminate warnings appeared successful in terms of reaching people, although in many cases the severity of the storm surge was underestimated. Almost all interviewees knew about the 40m no-build zones, but this policy does not reflect variations in hazard associated with variable coastline topography. Those within these zones seemed to have little idea about relocation plans while most households outside these zones wanted to stay in place. It appears that cash distributions from an NGO, despite likely causing price inflation, were useful in allowing the purchase of reconstruction materials. Property insurance is sparse in the Philippines and the surveys highlighted the lack of awareness about it. More than half of the temporary shelters examined were built without the aid of professional advice or help leading to people living in precarious, makeshift conditions. Therefore, training programs are needed in the early stages of the transitional phase of recovery to ensure lower vulnerability to future natural disasters.
The third group emphasized to investigate community resilience, to a lesser extent, issues on post-disaster planning and policies, as well as roles that NGOs and private firms have played. The group held various interviews with national and local government officers, Civil Society Organizations (CSOs), the private sector, community (Barangay) leaders, and local residents, in the cities of Tacloban and Ormoc, where the major causes of devastation were storm surge and strong wind, respectively. Intervies were also held in Manila. Key findings from
3
reconnaissance include: i) Land use along the seashore has been seriously discussed after typhoon Haiyan, and local governments are planning land use measures to reduce risk, including relocation of communities. Yet, the opportunity to achieve this goal is decreasing as time proceeds; ii) an innovative disaster management act named “the Philippines Disaster Risk Reduction and Management Act of 2010” has not yet nurtured the disaster management capacity of local governments in practice. However, the role of Philippines-based stakeholders, including national and local CSOs as well as the private sector, has been important in disaster response and mitigation; and iii) Barangays, as the smallest administrative body, have sufficient ability to respond to and recover from smaller disasters. However, the impact and the scale of typhoon Haiyan were overwhelming to infrastructure, and as a result, local communities were devestated.
The results of these fact finding surveys are presented in this report. Priority proposed activities for investigating the disaster caused by Typhoon Haiyan are listed below.
1. A rapid response Task Force Team is formed within IRIDeS
2. The Task Force Team will consider conducting the following activities:
1) Setting clear objectives and deliverables of the Task Force Team and giving assignments to each Division Chief and volunteer
2) Gathering information on the identified subjects and setting up a website to share information within IRIDeS and beyond
3) Dispatching research missions to the affected area to gather on-site information for better analysis and provide useful guidance to the authorities and communities
4) Publishing IRIDeS reports based on the findings of the Task Force 5) Sharing lessons learnt from the disaster in an international symposium
3. Proposed subjects to be pursued and confirmed by IRIDeS researchers are as follows:
1) Hazard perspective: investigation of storm surge, flooding, landslides, and wind.
2) Structural and engineering perspective: survey of buildings damaged by storm surge and strong wind 3) Non-structural measures: early warning system, public awareness and education.
4) Social, human and behavioral perspective: impacts on socially vulnerable communities including illegal settlements, gender and other social issues, review of evacuation and shelter options, management of shelters. 5) Environmental perspective: land use.
6) Public health and medical perspective: epidemiological survey of victims, management of transmittable diseases, mid-term to long-term medical assistance, psychological impacts.
4 8) Others
4. Interaction with exchange students from the Philippines
5
2. Summary of Typhoon Haiyan
A powerful tropical cyclone, named as Typhoon Haiyan, struck some areas of Southeast Asian countries. The Philippines was one of the most affected regions due to high winds and storm surges. Thousands of people are feared dead or missing after Typhoon Haiyan swept across the central Philippines on November 8, 2013. The details of Haiyan are described below.
2.1 Track of Typhoon Haiyan
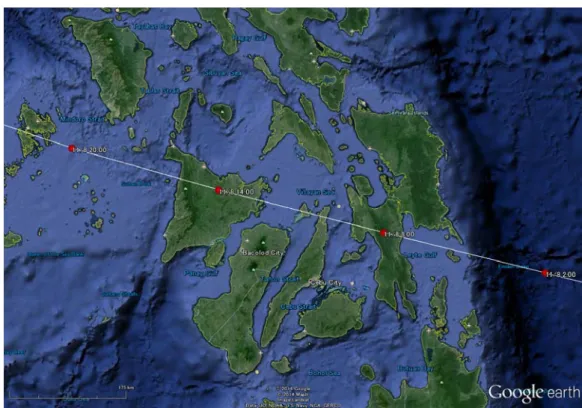
According to the National Disaster Risk Reduction and Management Council (NDRRMC), at 4:40 am on November 8, 2013 at Philippine time, Haiyan made its first landfall over Guiuan, Eastern Samar with the maximum wind speed of 125 kt and central pressure of 895 hPa (Category 5 on the Saffir-Simpson Hurricane Scale). Haiyan kept the same maximum wind speed and made the 2nd landfall over Tolosa, Leyte at 7:00 am and its 3rd landfall over Daanbantayan, Cebu at about 9:40 am. At 10:40 am, Haiyan made its 4th landfall over Bantayan Island, Cebu and by 12:00 its 5th landfall over Concepcion, Iloilo. In the afternoon, it maintained its strength as it approached the Calamian Group of Islands, and it made its 6th landfall over Busuanga, Palawan at 8:00 pm. Haiyan weakened as it continued to traverse over the West Philippines Sea. Fig. 2-1 shows the track of Haiyan at the Philippines local time: UTC + 8 hrs (Unisys Weather, 2013). Fig. 2-2 shows the track of Haiyan in a large domain with the time series of the central pressure (NII, 2013). A rapid decrease of the central pressure of Haiyan can be seen from Fig.
2-2.
Fig. 2-1. Track of Haiyan shown by white line and red circles (Google earth). The time indicating along the track is
6
Fig. 2-2. Track of Haiyan (left) and time series of the central pressure of Haiyan (right), UTC (National Institute of
Informatics [NII], Digital Typhoon: Typhoon 201330 [Haiyan]).
2.2 Ground observations
Fig. 2-3 shows the time series of the observed wind speed and mean sea level pressure at Tacloban weather station
in Leyte and Guiuan station in Eastern Samar. The data was provided by the Philippine Atmospheric Geophysical and Astronomical Services Administration (PAGASA). The rainfall data is also measured at Tacloban station. The landfall time is around 8:00 am in Tacloban and 5:00 am in Guiuan on November 8. A rapid increase of wind speed and rainfall and a decrease of mean sea level pressure toward the peak landfall time can be clearly seen from Fig.
2-3. It should be emphasized that the observation equipment was totally destroyed due to the high wind and/or
storm surge inundation and data recordings stopped around the peak time, so that the observation may have missed the peak values of the wind speed and pressure. These incidents prove that the wind speed on the ground and storm surge were enormously strong during the Haiyan event.
Fig. 2-4 shows the time series of the predicted astronomical tide at Tacloban and Guiuan. The data was also provided by PAGASA. The tide levels are based on the average mean sea level. It is noted that the tide level data at Tacloban in Fig. 2-4 is based on the linear interpolation of the predicted peak tide level data. It can be seen from the figure that the tide level was not so high during the landfall of Haiyan. If the landfall had occurred during the high tide, the damage by storm surges and high waves would have been more serious.
Fig. 2-5 shows 24-hr rainfall depth during the Haiyan event (13:00, Nov. 6 – 12:00, Nov. 9, UTC) over the Philippines obtained from GSMaP data (JAXA). GSMaP (e.g. Kubota et al., 2007) developed by JAXA is based on satellite-derived rainfall data. From this figure relatively high 24-rainfall more than 150 mm was observed in several regions during the Haiyan event. These heavy rainfalls may have caused flooding in rivers and landslides in the mountainous regions. However, it should be noted that satellite-driven rainfall data provided by GSMaP may have some uncertainties and biases.
7
Fig. 2-3. Time series of wind speed and mean sea level pressure at Tacloban station in Leyte Island and Guiuan
station in Eastern Samar from 0:00 on November 7 through 8:00 am on November 8.
Fig. 2-4. Time series of the predicted astronomical tide level at Tacloban and Guiuan from 0:00 on November 7
through 8:00 am on November 8.
13:00, 11/6 – 12:00 11/7 (UTC) 13:00, 11/7 – 12:00, 11/8 (UTC) 13:00, 11/8 – 12:00, 11/9 (UTC)
Fig. 2-5. 24-hr rainfall depth [mm] during the Haiyan event over Philippines obtained from GSMaP data.
950 960 970 980 990 1000 1010 0 5 10 0 10 20
Mean Sea Lev
el Pres s u re (hPa) Wind Speed (m/ s ) Rainfall (mm/15min.) :mslp :wind speed 11/7 0:00 8:00 16:00 11/8 0:00 8:00 4:00 12:00 20:00 4:00
PAGASA TACLOBAN STATION
930 940 950 960 970 980 990 1000 1010 0 10 20 30 40 50 M
ean Sea Level
Pr essur e ( h Pa) W ind Speed ( m /s) :mslp :wind speed 11/7 0:00 8:00 16:00 11/8 0:00 8:00 4:00 12:00 20:00 4:00 98558 Guiuan 0 0.2 0.4 0.6 0.8 0 0.2 0.4 0.6 0.8 Tide Lev el [ m ] at Guiuan 11/7 0:00 8:00 16:00 11/8 0:00 8:00 4:00 12:00 20:00 4:00 Tide Lev el [ m ] at Tac loban Guiuan Tacloban Landfall Landfall
8
2.3 Summary of Damage
Haiyan caused massive damages in Philippines. As of 6:00 am on March 14, 2014, 6,268 individuals were reported dead, 28,689 injured and 1,061 are still missing. A total of 3,424,593 families (16,078,181 persons) were affected in 12,139 barangays in 44 provinces, 591 municipalities and 57 cities of Regions IV-A, IV-B, V, VI, VII, VIII, X, XI, and Caraga in Philippines. The number of damaged houses was 1,140,332 (550,928 totally and 589,404 partially). The total cost of damage is PHP 39,821,497,852.17 with PHP 19,559,379,136.11 for infrastructures and PHP 20,262,118,716.06 for agriculture in Regions IV-A, IV-B,V,VI, VII, VIII, and CARASA (NDRRMC, 2014).
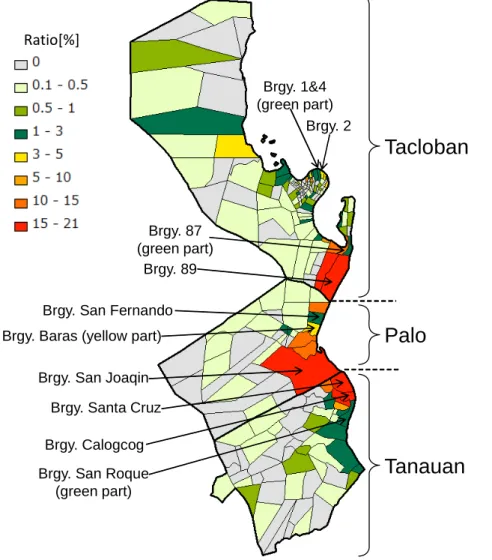
Especially, human casualties in Tacloban city and Palo and Tanauan municipalities of Leyte were very high. The locations of those places and DEM of Leyte and Samar are shown in Fig. 2-6. The number of deaths and missing people are 2,603 in Tacloban, 1,101 in Palo and 859 in Tanauan (as of February 25, 2014) according to the information provided by each municipality. It means that more than 60 % of human casualties from Haiyan were concentrated in those 3 cities in Leyte. Fig. 2-7 shows the population, the number of deaths and missing people due to Haiyan and fatality ratio [%] in each barangay in Tacloban, Palo and Tanauan of Northern Leyte Island (Kure et al., 2014). A barangay is the smallest administrative division in the Philippines. Barangays with more than 10 % of the fatality ratio can be found along the coastal zones in three cities, and the damage clearly indicates the massive external force of the storm surge during the Haiyan event and the vulnerability of those coastal areas.
9
Fig. 2-7. Population (left), number of deaths and missing people (middle) due to Haiyan and fatality ratio [%]
(right) in each barangay of Tacloban, Palo and Tanauan (Kure et al., 2014).
2.4 Evacuation Warning
Warning Record
A tropical storm spotted over the Caroline island in the Pacific Ocean on November 4 and it was named as Haiyan at 8:00 am at the Philippines local time. PAGASA officially announced the Weather Advisory #1 as the warning of Haiyan at 11:00 am on November 5. The Joint Typhoon Warning Center (JTWC) assessed the system as a Category 5 super typhoon on the Saffir-Simpson hurricane wind scale on November 6. Accordingly PAGASA upgraded the warning to the Sever Weather Bulletin #1 at 11:00 am on November 6. The Japan Meteorological Agency (JMA) estimated the system’s one-minute sustained winds to 315 km/h and gusts up to 378 km/h at 3:00 am on November 7. At 11:00 am, PAGASA announced the Sever Weather Bulletin #3, warning that the storm surges might reach up to a 7-meter wave height in the coastal areas of
Eastern Samar, Samar, Leyte and Southern Leyte in Visayas. Then, as explained in Section 2.1, Haiyan made
its first landfall over Guiuan, Eastern Samar with the peak intensity at 4:40 am on November 8. President Aquino declared the state of “National Disaster” from the damage of Haiyan on November 11.
It should be emphasized that PAGASA estimated and warned the 7-meter wave height in the coastal areas with the leading time of about 18 hours before the first landfall in Guinuan. This estimation was based on the numerical simulations technically supported by the JMA and historical records of the waves that PAGASA has. It was found from the survey after the Haiyan event that the estimation of 7 m wave height of PAGASA was appropriate, and the storm surge of about 6 m high attacked Tacloban city in Leyte.
10
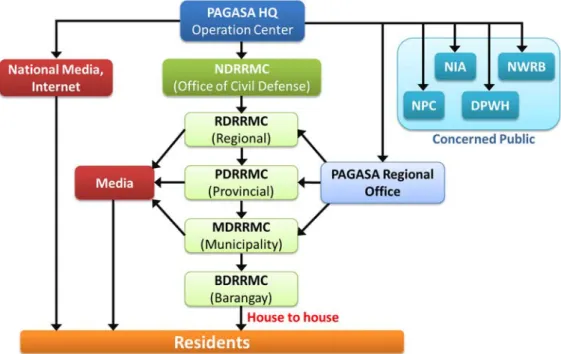
Disaster Information Transfer System
A disaster information transfer system in Philippines is shown in Fig. 2-8 (Miyamoto et al. 2014). The figure was provided by Dr. Mamoru Miyamoto (International Centre for Water Hazard and Risk Management [ICHARM]). Disaster information from PAGASA is transferred to the NDRRMC, National Media, and the public departments concerned such as the Department of Public Works and Highways (DPWH). The NDRRMC transfers the information to the Barangay through the Regional, Provincial and Municipality Disaster Risk Reduction Management Councils (DRRMC). Then, the disaster information is conveyed to a house to a house in local barangays. As explained in the previous section, PAGASA warned the 7-meter wave height in the coastal areas before the landfall. Thus, it is important to assess whether this information transfer system worked well or not during the Haiyan event and how long it took for the houses to receive this disaster information.
Fig. 2-8. Disaster information transfer system in Philippines (Miyamoto et al., 2014).
Problems for Evacuation
Several problems related to the evacuation to prepare for Haiyan were found through the on-site survey and local interviews by the IRIDeS team, as discussed in later chapters. Main problems were lack of education, poverty and inappropriate evacuation facilities. It is a famous story that many people did not understand what a storm surge is. During the local interview by the IRIDeS team, many people claimed that they did not understand the meaning of the storm surge that was used in the evacuation warning from PAGASA and local DRRMCs. They also claimed that if the warning had been made by using the word “tsunami,” they would have evacuated. This incident clearly indicates the importance of disaster education.
Another problem is the poverty. Young strong men had to stay in their houses during the Haiyan event in order to protect their properties from being stolen by somebody during the evacuation. This kind of social problem
11
should be seriously considered by the government, and some kind of insurance system or a guarantee system from the government should be discussed.
It is also a famous story of Haiyan that the evacuation facilities were not appropriate against the storm surges and enormously strong wind. For example, the Tacloban City Convention Center in Tacloban is located near the coastline as shown in Fig. 2-9 (left). About a thousand people evacuated to the center, and the center was inundated by the storm surge induced by Haiyan. Again, this incident shows the importance of disaster education. Another example is the Leyte Convention Center located in Palo. About 400 people evacuated to this center but this center was completely destroyed by the strong wind as shown in Fig. 2-9 (right). It was very fortunate that nobody died from Haiyan in those centers because people who evacuated to the Tacloban City Convention Center could escape upstairs after the center began to be inundated by the storm surge, and those who went to the Leyte Convention Center could evacuate to another facility before it collapsed. We confirmed this with local offices. For future typhoons, evacuation facilities should be evaluated and selected considering their strength and appropriateness. However, the population of Tacloban is more than 200,000, so that it is not easy for the government to provide appropriate evacuation facilities for all the people living in Tacloban.
12
References
Kubota, T., Shige, S., Hashizume, H., Aonashi, K., Takahashi, N., Seto, S., Hirose, M., Takayabu,Y.N., Nakagawa, K., Iwanami, K., Ushio, T., Kachi, M., Okamoto, K.: Global Precipitation Map using Satelliteborne Microwave Radiometers by the GSMaP Project: Production and Validation. IEEE Transactions on Geoscience and Remote Sensing 45(7): 2259–2275, 2007.
Kure, S., Anawat, S., Yi, C.J., Mas, E., Bricker, J.D., Koshimura, S., and Mano, A.: Human loss due to storm surge disaster caused by typhoon Haiyan in the coastal region of Leyte island, Journal of Japan Society of Civil Engineers, Ser. B2 (Coastal Engineering), Vol.70, No.2, 2014 (Abstract accepted), in Japanese.
Miyamoto, M., Tajima, Y., Yasuda, T., Nobuoka, H., Kawasaki, K., and Asano, Y.: Storm Surge Disaster due to Typhoon Haiyan and related Warning Activities in the Philippines, Civil Engineering Journal, Vol.52, No.6, 2014, in press, in Japanese.
National Institute of Informatics, Digital Typhoon: Typhoon 201330 (Haiyan), Available at: http://agora.ex.nii.ac.jp/digital-typhoon/index.html.en
NDRRMC: SitRep No.107 Effects of Typhoon “YOLANDA” (HAIYAN), 2014. Available at: http://reliefweb.int/sites/reliefweb.int/files/resources/Update%20Yolanda%20Sitrep%20107.pdf Unisys Weather: Individual Storm Details, Super Tyophoon-5 Haiyan [2013] Available at:
13
3. Initial damage mapping by satellite images
3.1 Rapid Damage Assessment
Introduction
After the impact of Super Typhoon Haiyan to the coast of Tacloban city, a set of satellite images was obtained to grasp the extension of the damage using visual interpretation of pre- and post-event satellite optical images. Satellite imagery has been used to assess the extent and level of damage in areas with limited access and on need for support and quick emergency response (Wegscheider et al., 2013).
Manual visual interpretation method was used following the first steps described on the methodology to develop tsunami fragility functions (Koshimura et al., 2009; Suppasri et al., 2011; Mas et al., 2012). It is one of the most accurate methods when using very-high-resolution (VHR) imagery (Wegscheider et al., 2013).
Satellite Image Data
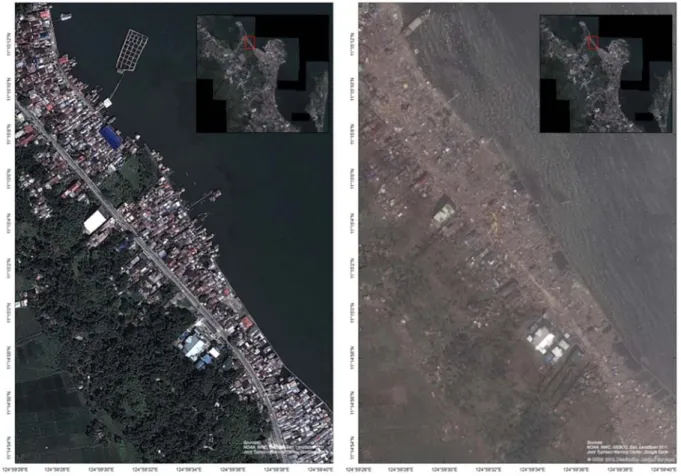
The pre-event data used for the damage interpretation was obtained directly from Google Earth, retrieved by November 8, 2013; while the post-event image was acquired on November 13, 2013 through Digital Globe in Google Earth. A zoom into the Anibong area in Tacloban city is shown in Fig.3-1.
Methodology
For the visual inspection we classified the damage interpretation into two levels according to the following criteria:
a. High damage or destruction. Here, roofs that had been reduced by more than 50% between pre- and post-event images are included together with structures that had been washed or blown away.
b. Low damage or survival. These are structures where only a small variation on its geometry or roof shape could be observed. Structures in areas near the coastline where flood was expected are also considered into this classification of low damage and survival.
Results and discussion
Fig.3-2 shows the area of Tacloban city and the damage interpretation resulted in this area. As shown in the figure,
the areas to the north and the south near to the coastline presented high damage, while the center of Tacloban, the downtown area was less damaged by the winds or surges in comparison.
Following the remote sensing approach, the field survey observations confirmed qualitatively the damage in these areas (Mas, E. et al., 2014). Reasons for the distribution of such damage in the areas were confirmed during the field survey and can be summarize as follows:
a. The structures to the north and to the south of downtown Tacloban city were built based on lightweight material and very near to the shoreline. Thus, high vulnerability to wind and storm surge was confirmed. Structures in
14
downtown Tacloban are mainly of concrete frame buildings and brick walls with corrugated galvanized iron sheets for houses with one or two stories.
b. The topography of downtown Tacloban is higher at some points compared to its northern and southern areas. In addition, to the north, in the Anibong area, following the low-lying flat area a immediate steep slope could be observed. This slope might have caused refraction of waves and wind damaging and triggering slope failures.
c. At the Anibong area, ships were found stranded inland. The storm surges carrying these ships inland caused more damage to the urban settlements.
Conclusion
The damage interpretation using satellite images provided important information to grasp the damage in the areas and, in our field survey team case, focus the activities for our field survey. A rapid damage assessment such as the one developed here can contribute actively to the emergency response and relief effort allocation and management when disasters impact on wide areas.
Fig. 3-1. Close view of the Anibong area in Tacloban city from pre- and post-event satellite images used on the
15
Fig.3-2. Result of the visual damage assessment using pre- and post-event satellite images of Tacloban city.
3.2 Rapid Inundation Mapping
Introduction
In response to the Super Typhoon Haiyan event, a rapid inundation mapping was conducted (Adriano, B. et al., 2014). Here, visible near-infrared (VNIR) imagery from the Advanced Spaceborne Thermal Emission and Reflection Radiometer (ASTER) sensor was used to infer the extent of the possible flooded areas. Using the Normalized Difference Water Index (NDWI), the presence of water features can be enhanced and then observed as a result of image processing.
Satellite Image Data
ASTER data was used, where the pre-event VNIR image was taken on June 1, 2008 and the post-event VNIR image was taken on November 15, 2013.
Methodology
The index analysis of ASTER’s VNIR images using NDWI was performed using ArcGIS software. To enhance the water features and discover wetland areas, the following equation is applied during image processing:
16
Where “Green” refers to the green band from the color band spectrum of the VNIR image; and “NIR” stands for the near-infra red band of the VNIR image.
The equation is applied to both, the pre- and the post-event, images and finally the difference of post- minus pre-event image is applied to obtain the new wetland areas presenting the post-event image condition, as shown in blue in Fig.3-3.
Results and discussion
The blue areas presented in Fig.3-3 correspond to areas with high probability of presence of water. A preliminary estimation of flooded areas by the typhoon was observed from the shoreline to the inland following the blue colored areas. However, field survey observations and measurements were needed to differentiate the cause of the flood, either by storm surge, rainfall or river.
Conclusion
A rapid assessment of possible inundated areas form the storm surges in Super Typhoon Haiyan event was conducted using satellite imagery. The NDWI analysis of pre- and post-event images provided a preliminary estimation of areas possibly flooded and where damage could occur. Field survey was necessary to confirm the origin and intensity of the flood at each location.
Fig.3-3. Result of the NDWI analysis of pre- and post-event satellite images. The blue areas represent areas which
experienced flooding. Areas where storm surge was responsible for the flooding can be inferred by connectivity with the shoreline.
17
References
Adriano, B., Gokon, H., Mas, E., Koshimura, S., Liu, W., Matsuoka, M. Extraction of damaged areas due to the 2013 Haiyan typhoon using ASTER data: Proceedings of the International Geoscience and Remote Sensing Symposium IGARSS 2014 and 35th Canadian Symposium on Remote Sensing CSRS, Quebec, Canada, 2014. (Abstract accepted).
Koshimura, S., Oie, T., Yanagisawa, H., and Imamura, F.: Developing Fragility Functions for Tsunami Damage Estimation using Numerical Model and Post-Tsunami Data from Banda Aceh, Indonesia, Coastal Engineering Journal, 51, 243–273, 2009.
Mas, E., Kure, S., Bricker, J., Adriano, B., Yi, C., Suppasri, A., Koshimura, S.: Field survey and damage inspection after the 2013 Typhoon Haiyan in The Philippines, Journal of Japan Society of Civil Engineers, Ser. B2 (Coastal Engineering), Vol.70, No.2, 2014 (Abstract accepted)
Mas, E., Koshimura, S., Suppasri, A., Matsuoka, M., Matsuyama, M., Yoshii, T., Jimenez, C., Yamazaki, F., and Imamura, F.: Developing Tsunami fragility curves using remote sensing and survey data of the 2010 Chilean Tsunami in Dichato, Natural Hazards and Earth System Science, 12, 2689–2697, 2012.
Suppasri, A., Koshimura, S., and Imamura, F.: Developing tsunami fragility curves based on the satellite remote sensing and the numerical modeling of the 2004 Indian Ocean tsunami in Thailand, Natural Hazards and Earth System Science, 11, 173–189, 2011.
Wegscheider, S., Schneiderhan, T., Mager, A., Zwenzner, H., Post, J., and Strunz, G.: Rapid mapping in support of emergency response after earthquake events, Natural Hazards, 68, 181–195, 2013.
18
4. Storm Surge Simulation
4.1 Methodology
The behavior of Typhoon Haiyan was hindcast using typhoon track data from the Japan Meteorological Agency (2013), which was input into a parametric hurricane model (Holland, 1980) for air-pressure field estimation, followed by the moving-typhoon model of Fujii & Mitsuda (1986) as described in Veltcheva & Kawaii (2002) for estimation of the wind field. The typhoon track data included data on location of the center of the storm, surface-level air pressure at the storm center, and maximum sustained wind speed. However, it did not contain information on the radius to maximum winds, so a radius to maximum winds of 25 km is assumed (Quiring, 2011). The hindcast pressure and wind fields are input into a combined hydrodynamic and wave model to hindcast the water level and wave heights induced by the typhoon. The hydrodynamic model used is Delft-3D (Deltares, 2011), and the spectral wave model used is SWAN (Booij et al., 1999). Delft-3D and SWAN are run together, with the hydrodynamic model repeatedly passing water level and current fields to the wave model, which calculates the wave field including the effects of currents and storm surge. The wave model in turn passes the radiation stress field back to the hydrodynamic model, which uses this information to calculate wave-induced setup and nearshore currents. Tides are included using the Global Tide database TPXO (2014) as a boundary condition to the hydrodynamic model.
Rough bathymetry was taken from GEBCO (2014) and topography from SRTM (NASA, 2014). Detailed bathymetry of Leyte Gulf was digitized from a nautical chart (NAMRIA, 1980) by Associate Prof. Hiroshi Takagi of the Tokyo Institute of Technology, and topography of downtown Tacloban and Tacloban Airport were surveyed during the January 2014 IRIDeS site visit. Nearshore coral reef topography east of Samar is not available, so the horizontal extents of reefs were digitized from Google Earth images, and a depth of 1 m relative to mean sea level was assumed. Model resolution is 2.5 km for the large domain (Fig.4-1), 100 m for the Tacloban domain (Fig.4-2), and 50 m for the Guiuan (Fig.4-3) and Hernani (Fig.4-4) domains. Manning’s n was assumed to be 0.025 everywhere, though for more detailed inundation analysis in the future, this will need to be adjusted for land use.
4.2 Results and Discussion
The water levels shown in Fig.4-1 were dominated by wind-driven storm surge near Tacloban and waves in eastern Samar. Fig.4-1 (right) shows maximum (in time) hindcast significant wave heights during the storm, reaching up to 20 m off Eastern Samar, and decreasing to less than 5 m in Leyte Gulf near Tacloban. Fig.4-2 shows the storm surge (wind-dominated) near Tacloban, including inundation of downtown Tacloban and Tacloban Airport. The 5-m surge extends up the San Juanico Strait to Bogulibas, then rapidly dissipates where the strait narrows. Damage along Tacloban’s shoreline (Fig.4-2c) indicated waves atop the surge (Fig.4-2b) were strong enough to wreck RC structures, and to cause erosion near building foundations. Inland from the shoreline (Fig.4-2d), damage resembled that of a slow, deep flood. In Eastern Samar (Fig.4-3 and 4-4), wind- and pressure-driven storm surges were small (Fig.4-3a and 4-4a), but wave-induced setup over the broad coral reefs in these areas generated a surge up to 5 m
19
high (Fig.4-3b and 4-4b). Waves on top of this wave setup (Fig.4-3c and 4-4c) wrecked structures (Fig.4-3d and
4-4d) and transported concrete and coral debris up to 50 m inland.
An important item that this surge and wave modeling has not resolved, however, is the tsunami-like behavior of the flood captured on film in Hernani by a member of the NGO Plan Philippines International. Monserrat et al. (2006) describe mateo-tsunamis, which are bore-like seiches that can cause destruction similar to that of a tsunami. If the present phenomenon is indeed a meteo-tsunami generated by the travelling low-pressure system (the typhoon), the Delft3D shallow water model should be able to reproduce it, and the lack of this effect in the model result indicates that either the local topography/bathymetry data is insufficient, or the hurricane model is not sufficiently resolving the pressure field. Alternately, if the bore is related to wave phenomena (infragravity waves such as surf beat, for instance), the phase-averaged SWAN wave model would not resolve this physics; in this case, a phase-resolving wave model such as BOSZ (Roeber et al., 2010) must be implemented via further nesting under SWAN.
Fig.4-1. (left) Maximum water level (including both surge and waves) measured by the IRIDeS survey team
(Chapter 5.2 and Mas et al., 2014). (right) Maximum significant wave height hindcast by SWAN. Note the jagged result east of Samar is merely an artifact due to hourly model output.
Fig.4-2. (a) Maximum storm surge for small domain (1) of Fig.4-1. (b) Maximum significant wave height. (c)
Typical damage along the coast of downtown Tacloban. (d) Typical water line in inland downtown Tacloban.
Leyte Samar 1 2 3 a Downtown Tacloban Airport Bogulibas Uba n Santa Rita b c d Downtown Tacloban Airport Boguliba Uba Santa Rita
20
Fig.4-3. (a) Maximum storm surge neglecting wave setup for domain (2) of Fig.4-1. (b) Maximum storm surge
including wave setup. (c) Maximum significant wave height. (d) Damage along coast near Guiuan PAGASA station.
Fig.4-4. (a) Maximum storm surge neglecting wave setup for domain (3) of Fig.4-1. (b) Maximum storm surge
including wave setup. (c) Maximum significant wave height. (d) Damage to seawall in Hernani.
d c Guiuan PAGASA b Guiuan PAGASA a Guiuan PAGASA d a Hernani b Hernani c Herna
21
References
Booij, N., R. Ris and L. Holthuijsen, 1999. A third-generation wave model for coastal regions, Part I, Model description and validation. Journal of Geophysical Research 104 (C4): 7649-7666.
Deltares (2011) Delft3D-FLOW User’s Manual. Version 3.15.
Fujii, T., and Mitsuda, Y. (1986) Synthesis of a stochastic typhoon model and simulation of typhoon winds. Annuals Disaster Prevention Research Institute, Kyoto University, No. 29 B-1 pp. 229-239.
GEBCO (2014). General Bathymetric Chart of the Oceans. British Oceanographic Data Center. http://www.gebco.net/
Holland, G.J. (1980) An analytic model of the wind and pressure profiles in hurricanes. Monthly Weather Review. Vol.108, pp.1212-1218.
Japan Meteorological Agency (2013) Regional Specialized Meteorological Center Tokyo – Typhoon Center, Best Track Data. http://www.jma.go.jp/jma/jma-eng/jma-center/rsmc-hp-pub-eg/RSMC_HP.htm
Monserrat, S., Vilibic, I., and Rabinovich, A.B. (2006) Meteotsunamis: atmospherically induced destructive ocean waves in the tsunami frequency band. Natural Hazards and Earth Systems Science. Vol.6, pp.1035-1051.
NAMRIA (1980) National Mapping and Resource Information Authority, Hydrographic and Geodetic Surveys Department, SAN PEDRO BAY Bathymetric Chart.
NASA (2014). Shuttle RADAR topography mission (SRTM). http://www2.jpl.nasa.gov/srtm/
Quiring, S., A. Schumacher, C. Labosier, and L. Zhu (2011), Variations in mean annual tropical cyclone size in the Atlantic, J. Geophys. Res., Vol.116, D09114, doi:10.1029/2010JD015011.
Roeber, V., Cheung, K.F., and Kobayashi, M.H. (2010). Shock-capturing Boussinesq-type model for nearshore wave processes. Coastal Engineering, 57(4), pp.407-423.
TPXO (2014) The OSU TOPEX/POSEIDON Global Inverse Solution TPXO. http://volkov.oce.orst.edu/tides/global.html
Veltcheva, A., and Kawai, H. (2002) Investigation of the typhoon pressure and wind field with application for storm surge estimation. Report of the Port and Airport Research Institute, Vol.41, no.2, pp. 23-44.
22
5. IRIDeS fact-finding mission, Hazard and Damage Evaluation Team
5.1 Missions and local collaborators
IRIDeS sent the Hazard and Damage Evaluation Team to conduct an on-site field survey to collect general information including evacuation response, inundation time and depth, emergency response by local government, etc. and obtain spatial data, statistical data and documents related to the damage caused by Typhoon Haiyan. And discussed with local authorities about possible collaborations to mitigate typhoon-related disasters in the future.
Name of the mission
IRIDeS Fact-finding mission to Philippines (2nd mission, January 16 - 24, 2014)
Hazard and Damage Evaluation team
1. Ass. Prof. Shuichi Kure (Team Leader, Disaster Potential Study) 2. Assoc. Prof. Jeremy D. Bricker (Technology for Global Disaster Risk)
3. Ass. Prof. Erick Mas (Remote Sensing and Geoinformatics for Disaster Management) 4. Ass. Prof. Carine J. YI (International Strategy for Disaster Mitigation)
5. Mr. Bruno Adriano (Remote Sensing and Geoinformatics for Disaster Management)
Philippines counterparts
1. Dr. Maritess S. Quimpo (Bureau of Research and Standards, DPWH) 2. Prof. Cristopher Stonewall P Espina (College of Architecture, UP) 3. Mr. Karl Taberdo (College of Architecture, UP)
4. Mr. Paul Tupaz (BS Economics Student, UP)
5. Mr. Christer Kim Gerona (BS Political Science Student, UP)
Tasks of the Hazard and Damage Evaluation team, IRIDeS
Target Area:
1) The city of Tacloban, Municipality of Palo, Municipality of Tanauan, and rural areas around rivers and mountains on Leyte Island
2) Coastal areas on Eastern Samar Island
Task 1. Verification of satellite image analysis using ground truth data and understanding the damage characteristics of buildings due to typhoons:
23
Classification of buildings damaged by storm surge and strong wind Taking of photos with GPS information of damaged places and buildings
Task 2. Data measurement and collection for detailed storm surge and wave modeling:
Measurement and/or collection of bathymetry data of Tacloban Bay and the straight that connects Tacloban Bay to Carigara Bay
Collection of fine-resolution topographic data of Tacloban city and other areas that experienced significant inundation and storm surge damage
Cataloging of coastal defenses (seawalls, levees, gates, if any) that existed before the storm, as well as their condition after the storm
Task 3. Investigation of other hazards (flooding, landslides, wave intrusion along the river, etc.) induced by Haiyan:
Collection of hazard maps and hydro-meteorological data such as wind speed, rainfall, river discharge, tide level data, etc.
Travel around rivers and mountainous regions to identify flooding and landslide damage induced by the typhoon
Modeling of the flood due to heavy rainfall with high tide level induced by the typhoon.
5.2 Inundation map
The main objectives of the mission were to collect spatial data, statistic data and documents and measure the inundation heights from storm surge and waves to inspect the damage and magnitude of Haiyan, and to conduct and verify the numerical simulation and satellite image analysis results. In order to make an inundation map of Haiyan, we conducted an on-site survey in Tacloban city and towns on Leyte and Samar Islands.
The survey was mainly conducted based on local interviews to obtain inundation heights and reliable information because it was difficult to find clear water marks of the storm surge and high wave inundation due to heavy rainfall during the Haiyan event and severe building damage induced by the strong wind. On the other hand, many residents around the coast stayed in their houses until inundation occurred, and witnessed the flooding event. Measurements were conducted using a portable laser rangefinder referenced to sea water level at the time of the survey. Examples scenes from the survey are shown in Fig.5-1.
Fig.5-2 shows the area of the city of Tacloban where the most of survey point data was taken by the team. The
bottom left inset shows the inundation heights measured in downtown Tacloban. In the right inset an estimated inundation limit was drawn as a result of the Normalized Difference Water Index (NDWI) analysis explained in
Chapter 3 of this report; the measurements were available from the field survey and interviews with eyewitnesses
24
6m near the shoreline. The survivors reported waves up to 4 m high atop the surge. Wave runup up to 12 m high was observed in Eastern Samar (Mas et al., 2014; Bricker et al., 2014). For more details, please see Bricker et al. (2014), Mas et al. (2014) and Kure et al. (2014). Also, the JSCE-PICE1 joint survey team reported detailed
inundation and run-up heights in Leyte and Samar (Tajima et al., 2014).
Fig.5-1. Pictures of the inundation survey in Leyte and Samar.
25
Fig.5-2. Measured inundation heights in Tacloban city based on survivors’ interviews (left) and inundated area
estimated from NDWI analysis (right) [explained in Chapter 3].
5.3 Northern extent of surge
The storm surge simulation hindcast a steep change in maximum surge elevation about 15 km north of downtown Tacloban, where the San Juanico Strait narrows and curves before widening again near Santa Rita to the north.
Fig.5-3 shows the result of the storm surge simulation near Tacloban. Between Tacloban Airport and Bogulibas,
maximum storm surge height was about 5 m above Mean Sea Level. North of Bogulibas, storm surge elevation rapidly diminished to less than 1 m. In Santa Rita, the modeled storm surge elevation was less than 1 m, and during our team’s field survey, interviewed residents reported no flooding in Santa Rita. Fig.5-4 shows surveyed water levels, in close agreement with the simulated surge levels of Fig.5-3 (since no flood was measured in Santa Rita, it is not included in Fig.5-4).
Fig.5-5 shows damage along the coast in Uban. The row of homes closest to the shore (near the seawall in the
foreground of the photo) was destroyed, and one set of concrete stilts can still be seen amongst the wreckage. Homes further inland had been damaged, but already rebuilt. Fig.5-6 shows wind waves up to 2 m high impacted Uban, and, atop the surge, these were likely responsible for destroying homes along the shoreline. Wind damage (i.e., missing roofing sheets) was not as severe in Uban as it was further south, and no wind damage was apparent in Santa Rita, indicating that the typhoon wind field diminished this far north. In addition to structural damage in Uban, surge flooded agricultural land tended by the town, destroying the season’s rice crop due to salinization, and damaged the town’s fishing industry because residents are hesitant to eat fish caught nearby the location of so many bodies (of the townspeople who drowned in the surge and whose bodies were not discovered on land).
26
Fig.5-3. Simulated maximum water level due to storm surge near Tacloban.
27
Fig.5-5. Damaged and rebuilt homes in Uban.
28
5.4 Types of damage in Tacloban
Water-related damage in downtown Tacloban varied between two regions of the town: inland and coastal. In inland downtown Tacloban, buildings were dirtied by storm surge and by rain falling in through roofs that had been blown away. Fig.5-7 and Fig.5-8 show water lines inside buildings in inland downtown Tacloban. Most buildings are built of concrete or wood. While concrete buildings are concentrated in downtown Tacloban, poorly built and unsafe wooden houses are along the coastline. Typical houses are built with bricks and a longitudinal wire through the bricks whenever financial conditions allow for it. Fig.5-9 is the typical brick house wall with only few longitudinal reinforced wires and this is common housing structure in Tacloban area. Soft walls and windows were broken out, equipment, furniture, and architectural elements inside these buildings were ruined by strong winds and rain.
Fig.5-10 shows a house in downtown Tacloban that was reconstructed using wooden studs and corrugated
galvanized iron sheet. Houses along the coast in the Anibong area of Tacloban were also rebuilt with debris and distributed tents as shown in Fig.5-11.
Fig.5-3 shows the area of downtown Tacloban submerged by the storm surge, but Fig.5-6 shows that waves in
the same location were very small. Waves that were incident onto the city from the bay around it, were broken when they impacted structures on the shoreline. Unlike the damage seen in Japan after the 2011 Tsunami, buoyancy of structures did not seem to contribute to building failure; this is because in Tacloban most buildings are very porous, with water quickly flooding in through doorways and windows.
Along the coastline of downtown Tacloban, however, the presence of waves atop the wind-driven storm surge caused heavy damage. Fig.5-12 shows the remains of a reinforced concrete building, with only its foundation and damaged columns still remaining. The rubble of its concrete walls is seen around the building’s floor. Fig.5-13 shows scour around the foundation of a building along the coastline. This is probably the result of waves; as such scour did not exist inland. Another mechanism of damage to coastal buildings was debris impact. Fig.5-14 shows the foundation of a house leveled by a ship that lost its moorings in Tacloban Harbor and was then blown onshore in a residential area. Many houses along Tacloban’s coastline were leveled by drifting ships.
29
Fig.5-8. Water line inside a building in inland downtown Tacloban.
Fig.5-9. Brick house wall with few longitudinal reinforced wire
Fig.5-10. A partially damaged house reconstructed its outer wall in downtown Tacloban.
a) b)
Fig.5-11. a) A house rebuilt with corrugated galvanized iron sheet and wooden studs, b) A house being rebuilt with
30
Fig.5-12. Destruction of Reinforced Concrete building in coastal downtown Tacloban.
31
Fig.5-14. Flattening of houses by a drifting ship in coastal Tacloban.
5.5 Wind damage
Damage due to extreme wind was present throughout the survey area. The major mechanism of wind damage was the ripping off of roofing materials from roof frames. Once the roof was destroyed, rain poured into the structure, ruining the architectural elements, equipment, furniture, and other items inside. Fig.5-15 and Fig.5-16 show examples of roofs ripped off public structures. In addition to destroyed roofs, wind-borne projectiles shattered windows and soft walls.
The most common roofing material in the region is Corrugated Galvanized Iron (GI) sheets, which are popular because of their low cost and ease of installation as shown as Fig.5-16. They are tied to the roofing frame/rafters (usually wooden, though sometimes metal) by nails. A common mechanism of failure of these ties is the nails ripping through the GI sheet. Sometimes the sheets and the nails are dissimilar metals, which can accelerate corrosion of both nail and sheet, further weakening the tie-down. In most cases, the roofing frames themselves remained tied down to the building structure quite well; contrast this to the US, in which the most common roof failure mode during hurricanes and tornadoes is the entire roofing frame lifting up off the building structure. The most direct method of preventing nails from ripping through GI sheet roofs is by using thicker GI sheets. However, this increases costs, and some hospitals complained that thicker GI sheets were not available (not in stock locally) for use in repair or reconstruction of their roofs after Haiyan, so thin GI sheets were used instead.
Fig.5-17 shows a building that was totally damaged by wind and storm surge, and Fig.5-18 is a health facility
partially damaged by only wind. Both health facilities were not functioning as of mid-January, 2014.
Coconut trees dominate the vegetation in eastern Leyte Island. These are the source of the coconut oil industry in the area. Many trees fell and snapped off their trunks during the storm. A devastated canopy of coconut trees was observed as shown in Fig.5-19.
32
Fig.5-15. Roof damage at a public area in Tacloban.
33
Fig.5-17. Roof damage at a hospital in Palo (south of Tacloban).
Fig.5-18. Tacloban Doctor’s Medical Center affected by only strong wind.
34
5.6 Eastern Samar damage
The eastern coast of Samar faces directly into the Pacific Ocean, thus it was exposed to the 20 m height (offshore) waves generated during Haiyan. Most of the eastern coast drops rapidly to deep water, with coral reefs along the shoreline. However, there is a small, shallow bay (Matarinao Bay) near the town of General MacArthur. As
Fig.5-20 shows, high water levels (6 to 10 m) were measured along the coastline. Inside Matarinao Bay, lower
flood levels (about 3 m) were inferred via interviews.
Near the Guiuan PAGASA station, Fig.5-21 shows a surge (mostly from wave setup) of 3 to 4 m, and wave heights of about 3 m on the landward side of the reef. Approximating runup as surge plus wave height (i.e. against a vertical wall), the 6.6 m recorded water level is reasonable. Fig.5-22 shows a foundation destroyed by the flood. Scour of sand under the foundation is responsible for some of the damage, as well as wave forces. Concrete blocks from foundations were drifted up to 30 m landward by the waves. In addition to the damage on the coast, the flood propagated far inland. Fig.5-23 shows a school building half kilometer inland flooded by the surge. However, due to lack of ground-level topography data in this location, inundation here cannot be simulated. Since a palm forest over 1/2 km wide separated this school from the coast, waves could no longer have been sizeable by the time they reached this location, so it is likely that the flood here was due to surge induced by wave setup.
Further north, in a coastal Barangay of Salcedo, total water level was measured to have been at least 11.5 m above mean sea level. Fig.5-24 shows a toilet vault along a debris line located on land at 9 m above mean sea level, and a building with its top story washed away. The base of the top story is located at 11.5 m above mean sea level. From these photos, it is evident that scour was also a major cause of destruction. The toilet vault had been buried in the sand before the storm, so sand around the vault must have been scoured to have allowed the vault to float. Sever scour (greater than 1 m) is also seen around the foundation of the house in Fig.5-24. Scour caused the house’s approach stairway to collapse, though the house itself remained standing because its foundation footings remained partially supported by sand. The reason total water level was higher in Salcedo than in Guiuan was probably because the reef in Salcedo was much narrower than it was at the Guiuan site, allowing larger waves to runup onshore, whereas at the Guiuan site waves broke over the reef, causing a large setup but lower wave heights onshore.
Fig.5-25 shows surge elevation and wave heights along the northern segment of Eastern Samar surveyed. At
Quinapondan and General MacArthur, due to wave breaking over the broad reef at the entrance to Matarinao Bay, wave breaking inside the shallow bay itself, and shielding by islands inside the bay, wave heights were small. However, surge inside the bay, due to both wind-induced and wave-induced setup, was about 3 m above Mean Sea Level. This agrees with the water level measurements of Fig.5-20 at the locations inside Matarinao Bay. Fig.5-26 shows damage seen in the fishing village of Quinapondan surveyed. Some traditional low-lying wooden homes on stilts were destroyed by the surge, but damage was not widespread, probably due to the lack of large waves. A similar situation existed in the town of General MacArthur.
Further to the north, in the town of Hernani, damage was severe. Fig.5-25 shows about 3 m of surge and 3 m wave heights, thus about 6 m runup height would be expected on the landward side of the reef; however, runup up to 9 m was reported by eyewitness accounts (Fig.5-20), indicating that local topography might have played a role in
35
enhancing damage to this town (ground-level topography and actual nearshore bathymetry data for this area were not available). This town has been repeatedly damaged by typhoons, and had even been relocated from its previous location further southwest after the town in that location had been destroyed by a typhoon. Hernani has two seawalls, an old one slightly offshore which had already been demolished by previous storms, and a new one at the shoreward edge of the town. Nonetheless, damage to Hernani was severe. Fig.5-27 shows an example of scour measured in the town. Fig.5-28 shows the remaining frame columns of a wooden house washed away by a bore-like surge (filmed by Nickson Gensis, a member of Plan Philippines International). Fig.5-29 shows the damage seen along the coast of the town, reinforced concrete structures demolished by waves riding atop surge. Note that the bore-like surge that struck Hernani may have been a localized phenomenon; Monserrat et al. (2006) describes the phenomenon of meteotsunamis, localized tsunami-like long waves generated by an atmospheric disturbance and enhanced by interaction with local bathymetry. The surge in Hernani may have been an example of this phenomenon, or it may have been due to infragravity motions such as surf beat. Research on this topic is underway.
In Llorente, north of Hernani, maximum water level was reported by witnesses to be up to 6 m above Mean Sea Level (Fig.5-20). However, the town experienced little damage. One reason for this is the elevation of the town, the coastal part of which is about 5 m above Mean Sea Level; this is in contrast to Hernani, where most of the devastated area was at most 3.5 m above Mean Sea Level. Also different from Hernani is that Llorente is in a bay and has no coral reef offshore. The lack of a coral reef would have allowed larger wave heights to reach the town’s coast, but may have resulted in a smaller surge (wave setup) than existed at Hernani (Fig.5-25); however, the model resolution is too coarse, and nearshore bathymetry data nonexistent, making accurate hindcasting of the wave behavior near Llorente’s coast difficult.
Fig.5-20. Measured maximum water levels in Eastern Samar (both surge and wave effects included).
Llorente Hernani General Macarthur Guiuan Quinapondan Salcedo
36
Fig.5-21. Surge water level and significant wave height near Guiuan.
Fig.5-22. Damage near Guiuan PAGASA station. Damaged foundation located 4 m above Mean Sea Level.
Fig.5-23. School building located about 1/2 km inland from Guiuan PAGASA. Flooded 2 m above floor level.
Guiuan
37
Fig.5-24. Damage in a coastal Barangay of Salcedo. Toilet vault (left) deposited on land at 9 m above Mean Sea
Level. (right) top story at 11.6 m above Mean Sea Level washed away.
Fig.5-25. Surge water level and significant wave height near Hernani.
Fig.5-26. Damage in Quinapondan fishing village.
38
Fig.5-27. Scour up to 1 m deep around foundation in Hernani.
Fig.5-28. Piles of house washed away by bore-like surge in Hernani.
39
5.7 Seawall damage
Seawall damage was observed in areas with significant wave activity, both in Leyte and Eastern Samar. Fig.5-30 shows one of the breaches on the eastern shoreline of Tacloban Airport. The seawall was pushed from its base a few meters inland. Fig.5-31 shows similar damage at the MacArthur Memorial on the east coast of Palo, just south of Tacloban Airport. Damage was similar, with the revetment parapet pushed landward. The Palo seawall was a rubble-fill concrete structure with a concrete parapet. Fig.5-3 and Fig.5-6 show the maximum storm surge height and significant wave height at each of these sites. Surface waves were 3-4 meters high, on top of a 3-4 meter sustained surge. Since each seawall crest was about 3 m above water level, the mean water level (surge) reached at least the top of the parapets. This allowed the waves striking the seawalls to impact the full frontal area of the seawalls, and exert a large horizontal force. In addition, buoyancy caused by submergence of the seawalls reduced their weight, making them easier to slide. Finally, as seen clearly in Fig.5-31, overtopping caused severe scour landward of the seawalls, allowing them to be more easily displaced landward.
Fig.5-32 shows the Hernani seawall in Eastern Samar. This seawall is a coral-fill embankment topped by a
concrete parapet and covered with grouted concrete armor on the landward and seaward faces. The Hernani seawall was breached in multiple locations. Coral-fill debris and pieces of the parapet and facing armor were scattered both landward and seaward of the wall’s original location. Fig.5-33 shows a steady surge of over 3 m near Hernani, indicating that water had risen to at least the crest of the seawall. Fig.5-33 also shows wave heights on the landward side of Hernani’s coral reef to also have been over 3 m. Since these waves were incident atop surge, they struck the seawall directly, and the impact force caused the destruction seen in Fig.5-32.
Fig.5-34 shows the seawall in Llorente, north of Hernani. This seawall consists of a concrete bulkhead wall held
in place by gravity to retain fill used to elevate the town’s coastline. The top section of the bulkhead wall is a recurved parapet. This seawall experienced no visible damage, indicating that the presence of fill behind the bulkhead wall prevented the wall from sliding under the wave forces to which it had been exposed. In addition to the strength imparted against sliding by fill, it’s likely this seawall contained rebar sufficient to prevent the parapet section of the wall from breaking off the bulkhead section; this is in contrast to Fig.5-31 and Fig.5-32, where the parapet section of each wall sheared off the revetment or bulkhead section. Another factor that likely prevented failure of the Llorente seawall is the concrete deck covering the fill on its landward side; this likely acted as armor to prevent scour of the fill behind the wall during wave overtopping of the parapet (wave overtopping of up to 2 m was reported by witnesses); this is in contrast to Fig.5-31, in which scour of the landside fill allowed waves to push the parapet section off the bulkhead section of the seawall.
40
Fig.5-30. Seawall breach on eastern coastline of Tacloban Airport. Crest height 3 m above Mean Sea Level.
Fig.5-31. Seawall damage at the MacArthur Memorial south of Tacloban Airport. Crest height 3 m above Mean Sea
Level.
41
Fig.5-33. Maximum storm surge (left) and significant wave height (right) near Hernani.
Fig.5-34. Seawall in Llorente.
Hernani Hernani
![Fig. 2-2. Track of Haiyan (left) and time series of the central pressure of Haiyan (right), UTC (National Institute of Informatics [NII], Digital Typhoon: Typhoon 201330 [Haiyan])](https://thumb-ap.123doks.com/thumbv2/123deta/5926701.1051751/15.892.85.793.121.363/haiyan-pressure-national-institute-informatics-digital-typhoon-typhoon.webp)


![Fig. 2-7. Population (left), number of deaths and missing people (middle) due to Haiyan and fatality ratio [%]](https://thumb-ap.123doks.com/thumbv2/123deta/5926701.1051751/18.892.173.724.114.528/population-number-deaths-missing-people-middle-haiyan-fatality.webp)