Hydrogenolysis of Hydrocarbons over Supported
Ru Catalysts
著者
YOSUKE NAKAJI
学位授与機関
Tohoku University
学位授与番号
11301甲第19260号
URL
http://hdl.handle.net/10097/00130543
博
士 学 位 論 文
論 文 題 目
担 持 Ru 触 媒 を用 いた炭 化 水 素 の水 素 化 分 解
Doctoral Thesis Title
Hydrogenolysis of Hydrocarbons
over Supported Ru Catalysts
提 出 者
東 北 大 学 大 学 院 工 学 研 究 科
応 用 化 学
専 攻
学 籍 番 号
B7TD4006
氏 名 中 路 洋 輔
指導教員 冨重 圭一 教授 研究指導教員 審 査 委 員 (○印は主査) ○ 冨重 圭一 教授 1 服部 徹太郎教授 2 笠井 均 教授 3 ○× ×○ 教授 4 △○ ×○ 教授 5 △○ ▽○ 教授(○×大学) 6 △▽ ×○ 准教授
Hydrogenolysis of Hydrocarbons over Supported Ru catalysts
ABSTRACT:As substation for petroleum resources, biomass is expected to replace the role. Especially, algal biomass can be alternative because the some oils are essentially same structure for petroleum resources. Representative oils are squalene and botryococcene which are multi-branched hydrocarbons. However, these hydrocarbons are heavy oil and therefore the direct use as transportation fuel are difficult. FT wax and waste plastics are also assumed as alternative resources but these compounds are also heavier compounds. Therefore, it is necessary for using as transportation fuel to cleave C-C bonds and produce lighter hydrocarbons. In previous works, Ru/CeO2 with highly dispersed Ru particles achieved regioselective hydrogenolysis of squalane
which is completely hydrogenated squalene. 1,2) Internal C-C bonds were cleaved regioselectively
and branched alkanes which could be used as transportation fuel were produced without significant formation of gaseous compounds produced by dissociation of methyl groups in side chain. This thesis discussed development of new Ru catalyst for regioselective hydrogenolysis for cleavage of internal C-C bonds, application of Ru/CeO2 for other hydrocarbons which were other alga-derived
hydrocarbon and polyolefins, and characterization of Ru/CeO2 during preparation and reduction.
[Regioselective hydrogenolysis of alga-derived squalane over Ru-VOx/SiO2 catalyst 3)] For the
purpose of development of new Ru catalyst, addition of 2nd metal to Ru catalysts was conducted in hydrogenolysis of squalane. V improved the regioselectivity with suppression of formation of methane although the activity was decreased. To determine the optimized V/Ru ratio, hydrogenolysis of squalane over Ru-VOx/SiO2 with several V amount was conducted. While the activity was
decreased with V amount, the orders of suppression of methane formation and regioselectivity were 0.5 (V/Ru) > 0.25 > 1.0 > 0 and 0.25 (V/Ru) 0.5 > 1.0 > 0, respectively. Above all results, the optimized V/Ru ratio was 0.25 with the balance of activity and selecticity. From H2 chemisorption,
XRD patterns, and XAFS analysis, Ru particle size in Ru-VOx/SiO2 catalysts was almost same
regardless of V amount. In contrast, disersion of Ru species was decreased with V amount. Therefore, V covered Ru surface and changed Ru ensemble size, which resulted in improvement of regioselectivity. Compared with regioselectivities between Ru-VOx/SiO2 and Ru/CeO2, suppression
of methane formation occurred more over Ru/CeO2 and the activity was higher than those of
Ru-VOx/SiO2. Therefore, the catalytic performace of Ru/CeO2 was higher.
[Production of gasoline fuel from alga-derived botryococcene by hydrogenolysis over Ru/CeO2
catalyst 4)] Hydrogenolysis of hydrogenated botryococcene (Hy-Bot) was conducted over Ru/CeO
2
to produce gasoline fuel. Hy-Bot has multi-branches in the structure and therefore it is expected that products which can be used as gasoline with high octane number are obtained when internal C-C bonds are cleaved. Ru/CeO2 gave the less number of products than that of previous work using
70 %-C at 513 K for 30 h at 6 MPa of H2. This value was the highest yield of gasoline derived from
alga-derived botryococcene and temperature was much lower than that of literature typically at 673 K. Products including 2,3-dimethylbutane had high octane number and stability.
[Catalytic transformation of polyethylene over Ru/CeO2 catalyst] As substitution of petroleum
resources in future, chemical recycle of waste plastics is paid attention. In this section, hydrogenolysis of low density polyethylene (LDPE) over Ru/CeO2 was conducted. Polyethylene is
converted to linear hydrocarbons when internal C-C bonds are cleaved. Carbon length was shortened with reaction time gradually. Highest liquid fuel (C5-C21) yield was achieved at 84 %-C at 513 K for 8 h at 6 MPa of H2 pressure. In order to compare with conventional hydrocracking catalyst,
Pt/H-USY was prepared and the same reaction was conducted. As a result, the activity, yield of liquid fuel, and suppression degree of gas formation was higher in Ru/CeO2 than those of Pt/H-USY.
In addition, Ru/CeO2 had higher catalytic performance in terms of resistance to coke deposition and
suppression of isomerization of products from TG-DTA and NMR, respectively. Therefore, Ru/CeO2
was also applicable for degradation of polyethylene.
[Formation mechanism of Ru/CeO2 catalyst during heating and reduction 5)] Ru/CeO2 was prepared
by heating in N2 flow instead of calcination in air. And then, in order to clarify the mechanism of
formation of highly dispersed Ru particles, several characterizations including in situ XAFS were conducted. After impregnation of Ru(NO)(NO3)3-x as Ru precursor, some nitrate ions were remained
on Ru species. After heating in N2 flow, non-crystalline Ru oxide was formed in contrast to the case
of calcination in air that crystalline RuO2 was formed. Especially in the case of Ru/SiO2,
non-crystalline Ru oxide were formed partially with crystalline RuO2 due to the low dispersion of
Ru species. Crystalline RuO2 in Ru/CeO2 calcined in air was partially and gradually reduced to
metallic Ru species without the change in the number of Ru atoms in one particle. On the other hand, non-crystalline Ru oxide in Ru/CeO2 and Ru/SiO2 heated in inert gas flow was reduced particle by
particle. After all, the dispersion of Ru catalysts was determined before the calcination in air or the heating in inert gas, and heating in inert gas prevented the formation of crystalline RuO2.
[Conclusion] Addition of V suggested change of Ru ensemble size and improved regioselectivity of Ru/SiO2. Ru/CeO2 also showed the regioselectivity for internal C-C bonds even in other substrates
which were alga-derived hydrogenated botryococcene and polyethylene. Therefore, Ru ensemble size on exposed Ru surface and dispersion of Ru particles were the important factor in the regioselectivity. On the other hand, dispersion of Ru particles was determined before calcination/heating and reduction, and therefore the select of support and Ru precursor are important to prepare the highly dispersed Ru particles in monometallic Ru catalyst.
[Reference] 1) S. Oya, D. Kanno, H. Watanabe, M. Tamura, Y. Nakagawa, K. Tomishige,
ChemSusChem 8 (2015) 2472-2475. 2) Y. Nakagawa, S. Oya, D. Kanno, Y. Nakaji, M. Tamura, K.
Fuel Process. Technol. 176 (2018) 249-257. 4) Y. Nakaji, S. Oya, H. Watanabe, M. M. Watanabe, Y.
Nakagawa, M. Tamura, K. Tomishige, ChemCatChem 9 (2017) 2701-2708. 5) Y. Nakaji, D. Kobayashi, Y. Nakagawa, M. Tamura, K. Okumura, K. Tomishige, J. Phys. Chem. C 123 (2019) 20817-20828.
Chapter 1. General Introduction
1.1. Utilization of petroleum resources ... 1
1.2. Alternative carbon resources in future ... 2
1.3. C-C bonds cleavage of hydrocarbons ... 3
1.4. Methods to improve noble metal catalysts... 7
1.5. Purpose of this thesis ... 8
1.6. Outline of thesis ...9
Reference ...10
Chapter 2. Regioselective hydrogenolysis of alga-derived squalane over
Ru-VO
x/SiO
2catalyst
2.1. Introduction ...202.2. Experimental ...21
2.3. Results and discussion ...23
2.4. Conclusions ...29
Reference ...29
Chapter 3. Production of gasoline fuel from alga-derived botryococcene by
hydrogenolysis over Ru/CeO
2catalyst
3.1. Introduction ...473.2. Experimental ...48
3.3. Results and discussion ...51
3.4. Conclusions ...55
Reference ...56
Chapter 4. Catalytic transformation of polyethylene over Ru/CeO
2catalyst
4.1. Introduction ...694.2. Experimental ...70
4.3. Results and discussion ...73
4.4. Conclusions ...77
Reference ...77
Chapter 5. Formation mechanism of Ru/CeO
2catalyst during heating
5.2. Experimental ...91
5.3. Results and discussion ...94
5.4. Conclusions ... 101
Reference ... 101
Chapter 6. Summary
... 125Acknowledgements ... 127
1
General Introduction
1.1. Utilization of petroleum resources
1.1.1. Petroleum resources as production of fuel and chemicals
Petroleum, which is one of fossil fuels, has overwhelming value for modern industry as a resource for production of fuel and chemicals, and our life keeps receiving the benefit. Before the use of petroleum resources, oil refinery is necessary for crude oil which is composed of alkane, naphthenes, aromatics, and asphaltic hydrocarbons. The process contains many treatments such as distillation, hydrogenation, desulfurization, and so on, and then produces gaseous hydrocarbons, gasoline, naphtha, kerosene, light oil, heavy oil, asphalt, and so on.
Global demand for oil products in 2017 is shown in Table 1-1 [1]. The main use of petroleum resources is transportation fuel including gasoline, jet/kerosene, diesel/gasoil, and others are used for petrochemical industry. Furthermore, as another utilization method, thermal power station consumes petroleum for production of electricity by combustion. On the other hand, naphtha is also important composition for chemical industry. Pyrolyzed naphtha is converted to olefinic compounds such as propylene, butadiene, and BTEX compounds which is composed of benzene, toluene, ethylbenzene, and xylene. Therefore, the potentiality to produce energy in several methods and the role of the source of chemicals in industry has made petroleum the most valuable resources among some fossil fuels for decades.
1.1.2. Depletion of petroleum resources
Many researches have been reported about investigation of the available amount of petroleum [2,3]. Table 1-2 shows each petroleum amounts of consumption, reserves, and production in the world. World oil reserves in 2018 were proven for sufficient amount as 50.0 years of global
2
production. Recently, Asia-Pacific region has consumed the large amount of petroleum remarkably and it was mainly derived from economic development of China and India. Actually, the consumption amount of petroleum in China and India was increased from 610.7 and 227.1 to 641.2 and 239.1 in single year, respectively, in contrast to the case of Japan where the amount was decreased from 187.8 to 182.4. Energy utilization using petroleum resources could not be removed from our life and therefore development of alternative technology or utilization of sustainable resources is necessary for the production of energy and chemicals in future.
1.2. Alternative carbon resources in future
1.2.1. Biomass-derived hydrocarbons
Biomass is one of promising resources as substitution for petroleum resources due to the sustainability, sufficient volume in the world, low environmental burden as carbon neutral, and so on. In United States, the US Department of Energy evaluated highly valuable chemicals by several criteria and listed 10 chemicals produced from carbohydrates named as the DOE Top 10 report [4]. A few years later, the list was modified with addition of several compounds and reported as Top 10 + 4.[5] Biohydrocarbons, especially derived from microalgae and bacterium, were listed in “Top 10 + 4” mainly evaluated by extensive recent literature and direct substitution. The other compounds are as follows: ethanol, furfural, 5-hydroxymethylfurfural, 2,5-furandicarboxylic acid, glycerol/derivatives, isoprene, lactic acid, succinic acid, 3-hydroxypropanoic acid, levulinic acid, sorbitol, and xylitol. These compounds except isoprene contain oxygen atoms in the structure, and the substitution for petroleum resources as source of hydrocarbon fuel is not favorable.
Algal biomass is expected to be alternative resource because of the algae’s high biomass productivity and no competition of algal cultivation with food production. [6] Among the components of algal biomass such as triglycerides, polysaccharides, and amino acids, hydrocarbons without a heteroatom, which are produced by some algae species, attract much attention because of their similarity to petroleum. [7] Representative hydrocarbons from algae are
3
squalene (2,6,10,14,18,22-hexaen-2,6,10,15,19,23-hexamethyltetracosane) from
Aurantiochytrium mangrovei [8] and botryococcene (polymethylated triterpenes CnH2n-10,
n=30-37) from Botryococcus braunii [9,10].
1.2.2. Waste plastics
Waste plastics can be substitution for petroleum because of the abundant production amount and low price as starting materials [11,12].Production amount of plastics reached 359 million tons in 2018 and has increased by 3% over 2017 [13]. Most of waste plastics are buried on the land and it is serious problem especially in Japan due to the narrow area of country. Furthermore, the structure of polyolefin is very similar to components of petroleum. Recycling waste plastics also connects to solution for environmental issues such as ocean pollution by microplastics. Therefore, it is highly and also environmentally valuable to reduce the amount of waste plastics.
1.3. C-C bonds cleavage of hydrocarbons
1.3.1. Comparison of hydrocarbon resources and hydrocarbons utilized in the society
Hydrocarbon resources are currently almost equal to fossil fuel resources which consist mainly of oil, coal, and natural gas. As shown in Table 1-3, huge amount of primary energy is used and the domestic supply is counted up to about 20000 PJ in 2018. [14] The ratio of fossil fuels are up to 85.5% and the dependency for energy production is very high. Among fuels, petroleum resources give the highest value of energy.
As shown in section 1.1.1, the use of petroleum resources mostly in modern society is transportation fuel, especially in use of gasoline and diesel fuel. General composition of gasoline are listed in Table 1-4. [15] The range of carbon number is C4-C12 and the components are paraffins, isoparaffins, aromatic compounds, naphthenes, and olefins. Representative components are isoparaffins and aromatic compounds, and these compounds have high octane number. In the case of diesel fuel, the range of carbon number is C8-C27 and the components are alkanes,
4
cycloalkanes, bicycloalkanes, alkylbenzenes, indanes, tetralines, and naphthalenes. [16] On the other hand, as chemicals from petrochemical industry, olefins, aromatic compounds, synthetic resins, raw materials for synthetic resins, synthetic rubbers, and others are produced as shown in Table 1-5. [17] Much of chemicals are polymeric materials or the raw materials for synthesizing those and the highest ratio of products is 28% for olefins. Above results, most of all hydrocarbons utilized in our society are small molecules with shorter carbon length than components of petroleum, and they are manufactured by cracking technology.
1.3.2. Non-catalytic reaction of C-C bonds cleavages
Pyrolysis is non-catalytic representative reaction of C-C bond cleavages. The reaction proceeds via free-radical mechanism without catalyst at 1073 K typically. Particularly in petroleum refinery, ethylene cracker, which is conversion process from hydrocarbon feedstocks such as ethane and naphtha to light olefin, is famous and important process [18]. The main use of light olefins are monomers for production of polymeric materials such as resins and fibers.
1.3.3. Catalytic C-C bond cleavages in hydrocarbons
Fluid catalytic cracking (FCC) is conversion process from heavy weight fraction in crude oil to gasoline and olefinic compounds in petroleum refinery using FCC catalyst as which Y-type zeolite (faujasite) is mainly used [19-21]. Long-chain hydrocarbons in crude oil are cracked into short-chain olefins with branches. Due to the production of branches and olefinic bonds, octane number is improved and then it can be used for gasoline fuel. BTEX compounds are also manufactured in this process.
Among other methods, C-C bond cleavage of heavy hydrocarbons using H2 is also highly useful
catalytic system. Hydrocracking using metal-acid bifunctional catalysts such as Pt/zeolite and Pt/SiO2-Al2O3 is one of the most typical methods of C-C bond cleavage of heavy hydrocarbons
5
for hydrogenation/dehydrogenation and protonation/deprotonation, respectively, and cracking occurs by-scission. This method involves isomerization and it is effective to refine the petroleum-based straight-chain hydrocarbons.
Scheme 1.1 Reaction mechanism for hydrocracking of hydrocarbons
Another method for C-C bond dissociation is hydrogenolysis over monofunctional metal catalysts. Representative metals are as follows: Ru, Ir, Rh, Pt, and Ni [30-33]. Although several hydrogenolysis mechanism have been suggested, the mechanism involving internal Csecondary
-Csecondary bonds dissociation by hydrogenolysis over Ru and Ir catalysts was considered as Scheme
1.2 [33,34]. In both cases, H atom of hydrocarbon molecule is removed during adsorption of hydrocarbon on metal surface and metal–carbon bond (single or triple bond) are formed. Then, addition of hydrogen species in metal surface to the adsorbed hydrocarbon species breaks metal-carbon bond, and cracked hydrometal-carbons are produced. Therefore, there is no opportunity that cracked hydrocarbons are isomerized, which is different from the case of hydrocracking over bifunctional catalyst. R1 R2 R1 R2 R1 R2 R1 R2 R2 R1 R2 -H2 +H2 Metal -H+ +H+ Acid -scission +H2 -H2 Metal -H2, +H+ -H+, +H 2 Acid R1
6
Scheme 1.2 Reaction mechanism for hydrogenolysis of hydrocarbons over (i) Ru and (ii) Ir catalysts. (Re-produced from Ref. [33,34]). (ii) Free energy changes are shown for lumped steps that dehydrogenate the alkane (GD), desorb hydrogen (GH), adsorb the dehydrogenated
hydrocarbon (GA), and rupture the C−C bond (GR). ( denotes groups of quasi-equilibrated
steps that are observed directly or implied by transition-state theory (TST); and the moles of gas-phase H2 indicated are cumulative along the reaction coordinate). Measured activation free
energies, G⧧, equal the sum of free energy changes for all preceding steps and depend, in part, on
the free energy of the transition state (G⧧) and the gaseous H2 (G
H2) that is produced in
quasi-equilibrated steps that form the transition state.
1.3.4. Regioselective hydrogenolysis of alga-derived squalane over Ru/CeO2
Recently, our group has reported regioselective hydrogenolysis of squalane, which is completely hydrogenated squalene, over Ru/CeO2 catalyst with highly dispersed Ru particles [34,35]. Internal
H C R1 C H R2 H H -H H C R1 C Ru R2 H H Ru Ru H* CH2 R1 Ru CH2 R2 Ru Ru hot intermidiates +H2 R2 CH3 R1 CH3+ Chemisorbed hydrogen (i) (ii) CR2 R1C H2C CH2 R1 R2 H H H H R1C CR2 2H2(g) * * R1C CR2 3H2(g) CR2 R1C 3H2(g) 3H2(g) ҂ C R1 C R2 3H2(g) GD GH GA GR G҂ Reaction coordinate F ree En er g y observed TST
7
Csecondary-Csecondary bonds were cleaved regioselectively without significant isomerization. Main
products had branches corresponding to squalane structure and C14-C16 products could be used for jet/diesel fuel. Ru/CeO2 had very small Ru particles under 1.5 nm by XRD patterns and the
dispersion was also high (H/Ru: about 0.9) by H2 chemisorption. In contrast to the case of Ru/CeO2,
the regioselectivity was lower over Ru/SiO2 with higher methane selectivity because Ru/SiO2 had
larger Ru particles (about 4 nm) in spite of same preparation method. Ru is known to be a structure-sensitive active metal in some catalytic reactions such as Fischer-Tropsch synthesis [36], ammonia synthesis/decomposition [37], and hydrogenolysis of C-O bonds [38], and then highly dispersed Ru particles are also considered to show the regioselectivity for hydrogenolysis.
1.3.5. Degradation of polyolefin
Degradation of polyolefin has been investigated to overcome environmental issues. Representative methods in degradation of polyethylene are pyrolysis [11], cross alkane metathesis [39], reverse Ziegler-Natta polymerization [40], and hydrocracking (hydrogenolysis) [41,42]. Pyrolysis gives olefins, paraffins, naphthenes, and aromatics with high yield typically at > 673 K with or without catalyst. Cross alkane metathesis is composed of dehydrogenation, olefin metathesis, and then hydrogenation and produces light alkane. Homogeneous Ir catalyst and heterogeneous Re catalysts are used for hydrogenation/dehydrogenation and olefin metathesis, respectively. Reverse Ziegler-Natta polymerization produces light alkanes with gaseous products over silica-supported zirconium monohydride at 423 K. Hydrocracking and hydrogenolysis are carried out over bifunctional catalysts [41] or Pt/SrTiO3 catalyst [42] typically at 573 K and
produce high liquid products.
1.4. Methods to improve noble metal catalysts
Addition of 2nd metal for development of catalyst is known to improve the catalytic performance. In particular, the uses of reducible metal oxides such as V, Mo, W, and Re as a 2nd metal can also
8
improve the catalytic performance [43-48]. In our laboratory, some works have been carried out reporting the improved performance by addition of 2nd metal such as hydrogenolysis of glycerol over Ir-ReOx/SiO2 [45], hydrodeoxygenation of cyclic vicinal diols over WOx-Pd/ZrO2 [46],
selective hydrogenolysis of 1,4-anhydroerythritol over Rh-MoOx/SiO2 [47], and so on. Therefore,
addition of 2nd metal is expected to improve the catalytic performance for regioselective hydrogenolysis for branched alkanes.
Dispersion and particle size is an important factor for catalytic performance of noble metal catalyst. Especially in supported Ru catalysts, correlation between Ru particle size and catalytic performance, which means activity and selectivity, is known as structure-sensitivity as described in section 1.3.4. Relation between coordination number of Ru-Ru bond and Ru particle size is as follows: 3.3 and 0.84 nm, 5.2 and 2.6 nm, 10 and 7.0 nm [37]. In our previous works, the structure of Ru/CeO2 with highly dispersed Ru particles after reduction has been characterized well. On the
other hand, the characterization before reduction, particularly in heating in N2 flow, was short to
demonstrate the formation mechanism of small Ru particles. X-ray absorption spectroscopy (XAS) is powerful characterization method for heterogeneous metal catalysts, giving information on oxidation state, particle size, structure of oxidized state, and so on. In addition, XAS enables us to grasp the catalyst state during the preparation or even reaction because it can be carried out under various temperatures and gas atmospheres. In our group, the formation mechanism for biomass conversion catalysts by using quick-scanning X-ray absorption fine structure (QXAFS) during temperature-programmed reduction with H2 (TPR-XAFS) for Rh-ReOx/SiO2 and Ir-ReOx/SiO2
catalysts were conducted [49,50]. Similar to these cases, structural change of Ru particles with high dispersion during heating in N2 and reduction with H2 can be suggested by TPR-XAFS.
1.5. Purpose of this thesis
Biohydrocarbons, which are produced by some microalgae and waste polyolefins, have similar structure to the components of petroleum and can be substitute for production of fuel from petroleum resources. However, the hydrocarbon molecules such as squalene, botryococcene, and
9
polyethylene are too large to use as transportation fuel such as gasoline, jet, and diesel fuel, and therefore cleavage of some C-C bonds is necessary. In addition, C-C bond cleavage needs high temperature and therefore it is favorable to make conditions milder.
1.6. Outline of thesis
This thesis represents the results of catalytic performance and characterization of Ru catalysts for hydrogenolysis of alga-derived hydrocarbons and polyolefin.
Chapter 1 (this chapter) is a general introduction of a review of the utilization of petroleum resources, alternative carbon resources in future, and C-C bonds cleavage of hydrocarbons. The purpose of this thesis is also described therein.
Chapter 2 presents regioselective hydrogenolysis of alga-derived squalane over Ru catalysts developed by addition of 2nd metal. Ru-VOx/SiO2 showed higher regioselectivity for the reaction
than Ru/SiO2, although the activity was decreased. Improvement of regioselectivity was
investigated by model reaction over Ru-VOx/SiO2 catalysts with several molar ratio of V/Ru and
the decrease of methane selectivity was found to be caused by suppression of terminal C-C bonds dissociation. V covered the surface of Ru particles and decrease of Ru ensemble size was suggested.
Chapter 3 shows production of gasoline-range fuel from alga-derived botryococcene by hydrogenolysis over Ru/CeO2 catalyst. 70 %-C yield of gasoline-range fuel was obtained by
hydrogenolysis of hydrogenated botryococcene (Hy-Bot) at lower temperature. Products are composed of multi-branched alkanes with high research octane number (RON) such as 2,3-dimethylbutane (103.5) [51]. This is the highest yield of gasoline-range fuel in conversion of botryococcene over supported metal catalysts. Although carbon balance was low during the production of heavy hydrocarbons, dehydrocyclization reaction of Hy-bot might produce cyclic compounds and make the product distribution complex indicated by hydrogenolysis of 2,5-dimethylhexane which is a substructure of Hy-Bot.
Chapter 4 presents catalytic transformation of polyethylene to liquid fuels over Ru/CeO2 in
10
suppression of gaseous products (C1-C4) under 10 %-C. Compared with Pt/H-USY which was a conventional hydrocracking catalyst, the catalytic performance of Ru/CeO2 was higher than that
of Pt/H-USY in terms of catalytic activity, yield of liquid fuel, suppression of isomerization, and resistance to coke deposition.
Chapter 5 demonstrates the formation mechanism of Ru/CeO2 catalyst during heating and
reduction. TPR-XAFS clarified that heating in inert gas flow during the preparation of Ru catalysts suppressed the formation of highly crystalline RuO2 in contrast to the case of calcination in air.
Dispersion of Ru particles was determined before reduction and the selection of support was also important for preparation of highly dispersed Ru particles.
Chapter 6 summarized all results of this thesis.
Reference
[1] Statista, statistical data (2017). Available from www.statista.com/statistics/282774/global-product-demand-outlook-worldwide/.
[2] International Energy Agency (IEA), World energy outlook (2019). Available from www. iea. org. /weo2019.
[3] BP statistical review of world energy 2019.
[4] T. Werpy, G. Petersen, Top Value Added Chemicals from Biomass. Volume I - Results of
Screening for Potential Candidates from Sugars and Synthesis Gas, U. S. D. o. Energy, USA, 2004.
[5] J.J. Bozell, G.R. Petersen, Green Chem. 12 (2010) 539-554.
[6] T. M. Mata, A. A. Martins, N. S. Caetano, Renewable Sustainable Energy Rev. 14 (2010) 217-232.
[7] B. Meeting, Enzyme Microb. Technol. 8 (1986) 386-394.
[8] K. Kaya, A. Nakazawa, H. Matsuura, D. Honda, I. Inouye, M. M. Watanabe, Biosci. Biotechnol.
Biochem. 75 (2011) 2246-2248.
[9] P. Metzger, C. Largeau, Appl. Microbiol. Biotechnol. 66 (2005) 486-496.
11
[11] S. D. A. Sharuddin, F. Abnisa, W. M. A. W. Daud, M. K. Aroua, Energy Convers. Manag. 115 (2016) 308-326.
[12] A. Rahimi, J. M. Garcia, Nat. Rev. 1 (2017) 1-11.
[13] Plastics – the Facts 2019 An analysis of European plastics production, demand and waste data, Belgium, 2018.
[14] Agency for Natural Resources and Energy, statistical data.
[15] E. W. de Menezes, R. Cataluna, D. Samios, R. da Silva, Fuel 85 (2006) 2567-2577.
[16] S. S. Sazhin, M. Al Qubeissi, R. Nasiri, V. M. Gun’ko, A. E. Elwardany, F. Lemoine, F. Grisch, M. R. Heikal, Fuel 129 (2014) 238-266.
[17] Japan Petrochemical Industry Association (JPCA), statistical data (2018). Available from www.jpca.or.jp/statistics/annual/seisan.html.
[18] T. Ren, M. Patel, K. Blok, Energy 31 (2006) 425-451.
[19] A. Trovarelli, C. de Leitenburg, M. Boaro, G. Dolcetti, Catal. Today 50 (1999) 353-367. [20] A. Corma, M. J. Diaz-Cabanas, J. Martinez-Triguero, F. Rey, J. Rius, Nature 418 (2002) 514-517.
[21] W. Vermeiren, J.-P. Gilson, Top. Catal. 52 (2009) 1131-1161.
[22] G. C. Bond, Metal-Catalysed Reactions of Hydrocarbons, Springer, New York, 2005.
[23] K. P. Jong, J. Zecevic, H. Friedrich, P. E. Jongh, M. Bulut, S. Donk, R. Kenmogne, A. Finiels, V. Hulea, F. Fajula, Angew. Chem. Int. Ed. 49 (2010) 10074-10078.
[24] D. Verma, R. Kumar, B. S. Rana, A. K. Sinha, Energy Environ. Sci. 4 (2011) 1667-1671. [25] J. Francis, E. Guillon, N. Bats, C. Pichon, A. Corma, L. J. Simon, Appl. Catal. A 409-410 (2011) 140-147.
[26] J. Weitkamp ChemCatChem 4 (2012) 292-306.
[27] H. J. Robata, J. C. Alger, L. Shafer, Energy Fuels 27 (2013) 985-996.
[28] K. Murata, Y. Liu, M. M. Watanabe, M. Inaba, I. Takahara, Energy Fuels 28 (2014) 6999-7006.
12
Chem. Eng. Sci. 107 (2014) 302-310.
[30] J. H. Sinfelt Catal. Rev. 3 (1970) 175-205.
[31] G. B. McVicker, M. Daage, M. S. Touvelle, C. W. Hudson, D. P. Klein, W. C. Baird, Jr., B. R. Cook, J. G. Chen, S. Hantzer, D. E. W. Vaughan, E. S. Ellis, O. C. Feeley, J. Catal. 210 (2002) 137-148.
[32] P. T. Do, W. E. Alvarez, D. E. Resasco, J. Catal. 238 (2006) 477-488.
[33] D. W. Flaherty, D. D. Hibbitts, E. Iglesia, J. Am. Chem. Soc. 136 (2014) 9664-9676.
[34] Y. Nakagawa, S. Oya, D. Kanno, Y. Nakaji, M. Tamura, K. Tomishige, ChemSusChem 10 (2017) 189-198.
[35] S. Oya, D. Kanno, H. Watanabe, M. Tamura, Y. Nakagawa, K. Tomishige, ChemSusChem 8 (2015) 2472-2475.
[36] J. M. G. Carballo, J. Yang, A. Holmen, S. Garcia-Rodriguez, S. Rojas, M. Ojeda, J. L. G. Fierro, J. Catal. 284 (2011) 102−108.
[37] A. M. Karim, V. Prasad, G. Mpourmpakis, W. W. Lonergan, A. I. Frenkel, J. G. Chen, D. G. Vlachos, J. Am. Chem. Soc. 131 (2009) 12230-12239.
[38] B. Balaraju, V. Rekha, B. L. A. Prabhavathi Devi, R. B.N. Prasad, P. S. Sai Prasad, N. Lingaiah,
Appl. Catal. A 384 (2010) 107-114.
[39] X. Jia, C. Qin, T. Friedberger, Z. Guan, Z. Huang, Sci. Adv. 2 (2016) e1501591. [40] V. Dufaud, J.-M. Basset, Angew. Chem. Int. Ed. 37 (1998) 806-810.
[41] D. Munir, M. F. Irfan, M. R. Usman, Renew. Sustainable Energy Rev. 90 (2018) 490-515. [42] G. Celik, R. M. Kennedy, R. A. Hackler, M. Ferrandon, A. Tennakoon, S. Patnaik, A. M. LaPointe, S. C. Ammal, A. Heyden, F. A. Perras, M. Pruski, S. L. Scott, K R. Poeppelmeier, A. D. Sadow, M. Delferro, ACS Cent. Sci. 5 (2019) 1795-1803.
[43] S. Ito, C. Chibana, K. Nagashima, S. Kameoka, K. Tomishige, K. Kunimori, Appl. Catal. A 236 (2002) 113-120.
[44] T. Yamagishi, I. Furikado, S. Ito, T. Miyao, S. Naito, K. Tomishige, K. Kunimori, J. Mol.
13
[45] Y. Nakagawa, Y. Shinmi, S. Koso, K. Tomishige, J. Catal. 272 (2010) 191-194.
[46] Y. Amada, N. Ota, M. Tamura, Y. Nakagawa, K. Tomishige, ChemSusChem 7 (2014) 2185-2192.
[47] T. Arai, M. Tamura, Y. Nakagawa, K. Tomishige, ChemSusChem 9 (2016) 1680-1688. [48] I. T. Ghampson, G. Pecchi, J. L. G. Fierro, A. Videla, N. Escalona, Appl. Catal. B 208 (2017) 60-74.
[49] S. Koso, H. Watanabe, K. Okumura, Y. Nakagawa, K. Tomishige, J. Phys. Chem. C 116 (2012) 3079-3090.
[50] Y. Amada, H. Watanabe, M .Tamura, Y. Nakagawa, K. Okumura, K. Tomishige, J. Phys.
Chem. C 116 (2012) 23508-23514.
14
Table 1-1. Global demand for oil products in 2017 [1]
Products Demand in million on barrels per day
Ethane/LPG 11.2 Naphtha 6.3 Gasoline 25.5 Jet/Kerosene 7.2 Diesel/Gasoil 28.6 Residual fuel 7.1 Other products 11.2
15
Table 1-2. Amounts of petroleum, reserve, and production worldwide in 2018 [3].
Region Consumption [106 tons] Reserves [109 tons] Production [106 tons] R/P ratio a North America 1112.5 35.4 1027.1 28.7
South and Central America 315.3 51.1 335.1 136.2
Europe 742.0 1.9 162.9 11.1
Commonwealth of Independent States (CIS) 193.5 19.6 709.1 27.4
Middle East 412.1 113.2 1489.7 72.1
Africa 191.3 16.6 388.7 41.9
Asia Pacific 1695.4 6.3 361.6 17.1
Total 4662.1 244.1 4474.3 50.0
a Reserves-to-production ratio. If the reserves remaining at the end of any year are divided by the
production in that year, the result is the length of time that those remaining reserves would last if production were to continue at that rate.
16
Table 1-3. Domestic supply of primary energy in 2018 [14]
Amount of energy [PJ] Share of total supply
Fossil fuels 16850 85.5
Petroleum 7413 37.6
Coal 4946 25.1
Natural gas 4491 22.8
Non fossil fuels 2859 14.5
17
Table 1-4. Gasoline composition per hydrocarbon group and by carbon number. [15] Sample A Identification C5 C6 C7 C8 C9 C10 C11+ Total Paraffins 6.7 1.3 0.4 2.5 - - 0.06 10.1 Isoparaffins 10.8 5.6 1.8 17.0 1.3 - 0.2 36.7 Aromatics - 0.3 36.7 0.3 0.3 0.6 0.3 38.5 Naphthenes 0.4 1.6 1.1 1.2 1.2 - - 4.3 Olefins 6.7 1.6 0.5 0.1 0.1 - - 9.1 Others 0.3 0.1 0.05 - - - 0.3 0.8 Sample B Identification C5 C6 C7 C8 C9 C10 C11+ Total Paraffins 9.3 1.3 0.5 2.6 - - 0.03 13.7 Isoparaffins 13.6 5.0 2.3 23.7 1.1 0.3 0.1 46.1 Aromatics - 0.2 26.1 0.2 0.2 0.1 0.1 26.9 Naphthenes 0.6 1.4 1.1 1.8 - - - 4.9 Olefins 4.9 1.2 0.5 0.1 0.5 - - 7.2 Others 0.2 0.1 0.4 - - 0.06 0.2 1.0
18
Table 1-5. Amount of products from petrochemical industry in 2018 [17]
Products Amount [tons] Olefins Ethylene 6,156,519 Propylene 5,170,305 Butadiene 858,406 Total 12,185,230 Aromatic compounds Benzene 4,012,491
Toluene 2,069,216 Xylene 6,771,322 Total 12,853,029
Synthetic resins LDPE 1,442,651
EVA 166,931 HDPE 857,038 PP 2,357,807 PS 1,236,915 Petroleum resin 108,109 Total 6,169,451 Raw materials for synthetic resins Ethylene oxide 905,526
Ethylene glycol 641,890 Acrylonitrile 476,765 Total 2,024,181 Synthetic rubbers Styrene-butadiene rubber 579,324
Butadiene rubber 306,900 Acrylonitrile-butadiene rubber 113,246 Polychloroprene 126,114 Ethylene-propylene rubber 231,035
19
Other rubbers 212,877 Total 1,569,496 Other chemicals 1,2-Dichloroethane 3,110,042 Styrene 2,007,463 Acetaldehyde 88,519 Isopropanol 203,499 Butanol 416,918 Octanol 198,449 Acetone 418,967 2-Butanone 223,882 Methyl isobutyl ketone 56,487
Propylene oxide 373,917 Polypropylene glycol 283,424 Acrylic ester 258,725 Phenol 587,446 Bisphenol A 441,779 Total 8,669,517 Total 43,470,904
20
Regioselective hydrogenolysis of alga-derived squalane over
Ru-VO
x/SiO
2catalyst.*
* Reproduced from Ref. “Yosuke Nakaji, Yoshinao Nakagawa, Masazumi Tamura, Keiichi Tomishige,
Fuel Process. Technol. 176 (2018) 249-257.” with permission from Elsevier.
2.1. Introduction
As shown in section 1.2.1, algal biomass is expected to substitute the petroleum resources due to the production of similar components to petroleum. In the regioselective hydrogenolysis of squalane, Ru/CeO2 showed the higher regioselectivity than that of Ru/SiO2. In the case of Ru/SiO2,
the selectivities to C14-C16 and C9-10 was lower than 32% in contrast to the case of Ru/CeO2 that
achieved those over 40%. [1] The high selectivity of Ru/CeO2 catalyst can be due to the small Ru
particle size and/or the electronic effect by CeO2 support. While controlling the particle size and
choosing appropriate support are frequently effective in improving the performance of noble metal catalysts, addition of 2nd metal can also improve the performance [2-4]. Typically, the added 2nd metal makes direct bond with the surface of noble metal particles, affecting the catalytic behavior by changing the ensemble size, changing the electronic state of the noble metal, or providing the added metal species as activating site of substrate. Ru-V catalysts have been already reported for
n-alkane hydrogenolysis in gas-phase reactions as catalysts with relatively good selectivity in
dissociation of internal bonds [5-9]: Ru-V catalyst cleaves the Csecondary-Csecondary bond of n-butane
to ethane or methane, the latter of which is the over-hydrogenolysis product. However, the reactivity patterns between Ctertiary-Csecondary and Ctertiary-Cprimary bonds which are present in
squalane and hydrogenated botryococcene have not been investigated. In this work, the effect of 2nd metal on Ru catalysts in hydrogenolysis of squalane was investigated. Addition of V gave increase of the selectivity to products by Csecondary-Csecondary bond dissociation and decrease of the
21
2.2. Experimental
Catalyst preparationRu/support catalysts (Ru: 5 wt%) were prepared by impregnating various supports with Ru(NO)(NO3)3-x(OH)x in diluted nitric acid (Sigma Aldrich, Ru: 1.5 wt%). Used supports were as
follows: SiO2 (Fuji Silysia Chemical Ltd., G-6), CeO2 (Daiichi Kigenso Kagaku Kogyo Co., Ltd.,
HS), Al2O3 (Nippon Aerosil Co., Ltd., AEROXIDE Alu C), MgO (Ube Industries Ltd., 500A),
TiO2 (Nippon Aerosil Co., Ltd., AEROXIDE P25), and ZrO2 (Daiichi Kigenso Kagaku Kogyo Co.,
Ltd., RC-100P). Ru-MOx/support (Ru: 5 wt%; M=V, Re, Mn, Mo, Ni, W) catalysts were prepared
by co-impregnation method with Ru(NO)(NO3)3-x(OH)x in diluted nitric acid and various metal
precursor. Used metal precursors were as follows: NH4VO3 (Wako Pure Chemicals Industries,
Ltd.), NH4ReO4 (Mitsuwa Chemicals Co., Ltd.), Mn(NO3)2・6H2O (Soekawa Chemical Co., Ltd.),
(NH4)6Mo7O24・ 4H2O (Wako Pure Chemicals Industries, Ltd.), Ni(NO3)2・ 6H2O (Wako Pure
Chemicals Industries, Ltd.), and (NH4)6H2W12O40・H2O (Wako Pure Chemicals Industries, Ltd.).
After evaporating the solvent, all the prepared catalysts were dried at 383 K for 12 h, and heated in the N2 flow at 573 K for 1 h as pretreatment.
Activity tests
Activity tests were performed in a 190 ml stainless steel autoclave with copper gasket. The pretreated catalyst was put into a reactor with squalane (Wako Pure Chemicals Industries, Ltd., > 95%) or n-hexadecane (Wako Pure Chemicals Industries, Ltd., > 97%) and a glass-coated magnetic spinner together. After sealing, the reactor was purged with hydrogen three times and filled with 3.5 MPa hydrogen. Then, the reactor was heated to 513 K. The heating took about 1 h, and the pressure became 6 MPa. Temperature was monitored using a thermocouple inserted in the reactor. Stirring rate was fixed at 450 rpm. After an appropriate time, the reactor was quickly cooled down to room temperature in water bath. Gas and liquid phases of the reaction mixture were transferred to a 10 L aluminum gas bag and a 30 mL glass vial, respectively. 20 mL of mesitylene (Wako Pure
22
Chemicals Industries, Ltd., > 97%) was used as washing solvent in the collection of the liquid phase. The products were analyzed with GC (Shimadzu GC-2014) equipped with flame ionization detector (FID). The Rtx®-1 PONA column (Restek) was used for separation. To the gas phase collected to the gas bag, 80 L of dichloromethane (Wako Pure Chemicals Industries, Ltd., > 99.5%) was added as internal standard. 200 L of gas sample was injected into GC. To the liquid phase, 50 mg of n-octacosane (Sigma Aldrich, > 99%) was added as internal standard, or 20 mg of n-octadecane (Wako Pure Chemicals Industries, Ltd., > 97%) was added as internal standard when n-hexadecane was the substrate. 1.0 L of liquid sample was injected into GC. Assignments of products were the same as those in previous work in our laboratory [1]. The conversion, selectivity, carbon balance, and TOF of products were calculated with the formulas shown below. The carbon balance was also confirmed in each result, and the difference in the carbon balance was always in the range of the experimental error (±10%).
Conversion (%)= ( ∑Amount of products [mol-C]
Amount of unreacted substrate [mol-C] + ∑ Amount of products [mol-C]) ×100
Selectivity (%)= (Amount of each product [mol-C]
∑Amount of products [mol-C] ) ×100
Carbon balance (%)= (Amount of unreacted substrate [mol-C]+∑ Amount of products [mol-C]
Amount of substrate input [mol-C] ) ×100
TOF (h-1) = (Amount of substrate input [mol] × Conversion vs time slope determined by initial two points [% h⁄ ]
Amount of Ru in catalyst [mol] × 100 )
Reuse experiment
The method of reuse experiment of Ru-VOx/SiO2 (V=0.25) for hydrogenolysis of squalane is as
follows. First, normal activity test with fresh catalyst was conducted. After collection of all the reaction mixture using mesitylene as washing solvent, the used catalyst was recovered by centrifugation. Four procedures were applied before next use: (a) washed with n-hexane and dried in air; (b) directly used in the next run without exposure to air by using glove bag; (c) washed with
n-hexane, dried in air, and heated in N2 flow at 573 K for 1 h; (d) washed with n-hexane, dried in
air, and calcined in air at 573 K for 1 h. For the cases (a), (c), and (d), the next run was conducted in the same scale, where small amount of fresh catalyst (about 10%) was added to compensate the loss in the recovery process.
23
Characterization
The amount of carbonaceous species was measured by thermogravimetry-differential thermal analysis (Rigaku Thermo Plus EVO-II; under air) as the exothermic weight loss around 550 K. Temperature programmed reduction with H2 (H2-TPR) was carried out in a fixed-bed reactor
equipped with a thermal conductivity detector (TCD) and frozen acetone trap using 5% H2/Ar (30
ml/min). X-ray diffraction (XRD) patterns were recorded by a diffractometer (Rigaku UltimaIV) with Cu K ( = 0.154 nm, 45 kV, 40 mA) radiation. X-ray Absorption Spectroscopy (XAS) was conducted at the BL01B1 station at SPring-8 with the approval of the Japan Synchrotron Radiation Research Institute, Proposal No.2017A1106. The catalysts was reduced in H2 flow at 573 K for 1
h before the measurement. After reduction, the catalyst powder was transferred to the measurement cell in a glove bag filled with N2. The data were collected in a transmission mode. The edge jumps
were from 0.2 to 0.3. The detailed analysis method of XAS is described in Supplementary Data. The amount of H2 chemisorption was measured in a high-vacuum system. Before adsorption
measurements, the catalysts were reduced in H2 at 573 K for 1 h. The adsorption was conducted
at room temperature and the final H2 pressure was about 1.1 kPa.
2.3. Results and Discussion
Conversion of squalane over Ru catalysts
The activity tests of Ru/SiO2 catalysts modified with various 2nd metals for hydrogenolysis of
squalane was conducted (Table 2-1), where the conversion was adjusted to similar level by changing the reaction time for the comparison of selectivity. Addition of Re increased the activity; however, the selectivity to methane was increased and that to C14-C16 was decreased. Addition of other group 5-7 metals or Ni had little effect on the selectivity. Nevertheless, addition of V slightly decreased methane selectivity (2.7% → 2.2%) and increased C14-C16 selectivity (28.9% → 35.2%), although the activity was significantly decreased. Next, the effect of supports for Ru and Ru-V catalysts in hydrogenolysis of squalane at the conversion range of 71.2-92.5% was
24
investigated (Table 2-2). The largest increase in C14-C16 selectivity by addition of V was observed on SiO2 support. On TiO2 and ZrO2 the selectivity to methane was also decreased by addition of
V, similarity to the case of SiO2 support; however, the selectivity to C14-C16 was almost
unchanged. On Al2O3 and MgO, the effect of V in selectivity was very small. In the case of CeO2
support where the highest regioselectivity was observed for monometallic Ru catalysts, the addition of V rather decreased the regioselectivity, indicating that the addition of V spoiled the support effect of CeO2. In terms of activity, the largest decrease of activity by the addition of V
was observed on SiO2 support. All the above results demonstrate that the both the positive and
negative modification effects of V most appear on SiO2 support. Larger modification effect over
SiO2 support of 2nd metal on noble metal catalysts than other oxide supports has been reported for
Rh and Ir catalysts for various reduction reactions [2,10]. The largest modification effect may be due to the weak interaction between SiO2 and supported metals, which is connected to the increase
in the amount of 2nd metal (V) interacted with Ru. Ru-VOx/SiO2 catalysts were selected in the
following studies.
The effect of V amount in Ru-VOx/SiO2 catalysts on the performance is shown in Figure 2-1. The
order of activity was Ru/SiO2 (V/Ru = 0) > Ru-VOx/SiO2 (V/Ru = 0.25) > Ru-VOx/SiO2 (V/Ru =
0.5) Ru-VOx/SiO2 (V/Ru = 1.0) from Figure 2-1(a). Compared to TOF over each Ru-VOx/SiO2
catalyst determined in the initial conversion, TOF of each Ru-VOx/SiO2 catalysts (V/Ru = 0, 0.25,
0.5, 1.0) are 13.1, 4.4, 1.4, 1.6 h-1, respectively. In view of selectivity, the order of methane selectivity was Ru/SiO2 (V/Ru = 0) > Ru-VOx/SiO2 (V/Ru = 1.0) > Ru-VOx/SiO2 (V/Ru = 0.25)
> Ru-VOx/SiO2 (V/Ru = 0.5) (Figure 2-1(b)) and C14-C16 selectivity was Ru-VOx/SiO2 (V/Ru =
0.5) Ru-VOx/SiO2 (V/Ru = 0.25) > Ru/SiO2 (V/Ru = 0) > Ru-VOx/SiO2 (V/Ru = 1.0) (Figure
2-1(c)). The methane selectivity was lower and the C14-C16 selectivity was higher over V/Ru = 0.25 or 0.5 catalysts than those over Ru/SiO2 (V/Ru = 0) when compared at similar conversion level.
The amount of carbonaceous species formed during the reaction was measured by TG-DTA (Figure 2-2). The amount of carbonaceous species at ~ 60% conversion was 0.004, 0.006, 0.012, and 0.015 g/gcatalyst over the catalysts with V/Ru = 0, 0.25, 0.5, and 1.0, respectively. The amounts
25
correspond to 0.06, 0.09, 0.17, and 0.20% selectivity to carbonaceous species, respectively, assuming that the carbonaceous species was pure carbon. It is concluded that the amount of carbonaceous species was small on all these catalysts.
From the balance of activity, selectivity, and the amount of carbonaceous species, the best V/Ru ratio was decided as 0.25 in Ru-VOx/SiO2 catalyst for hydrogenolysis of squalane.
Hydrogenolysis of n-hexadecane over Ru-VOx/SiO2 catalysts
The effect of addition of V to Ru/SiO2 catalyst was also investigated in hydrogenolysis of
n-hexadecane. The results are shown in Figure 2-3, where the conversion was kept 10% to discuss the molar-based selectivity at the initial stage. Since the molar-based selectivity difference was small, four runs for each catalyst were carried out to increase the accuracy. Similar to the cases of Ru, Rh, and Ir catalysts in the literature, almost all the products were n-alkanes and the molar amounts of produced alkanes were in the following order as shown in Figure 2-3(a): C1 C15 C2 C3 C4 C5 C6 C7 C8 C9 C10 C11 C12 C13 C14 [57,72,73]. The similar production amounts of C2-C14 in mol mean that all the Csecondary-Csecondary bonds have similar
reactivity: for example, when C-C bonds of 2-3 and 3-4 positions in n-hexadecane have the same reactivity, the molar yields of ethane (C2), tetradecane (C14), propane (C3), and tridecane (C13) will be the same. The larger production amount of C15 than C2-C14 means that Csecondary-Cprimary
bonds are more reactive than the Csecondary-Csecondary bonds, because C15 was produced only by
dissociation of terminal C-C bonds (Csecondary-Cprimary) and C2-C14 were produced by dissociation
of internal C-C bonds (Csecondary-Csecondary). This tendency gives larger methane formation which is
caused with C15 formation and this is an undesirable reaction. Figure 2-3(b) shows the difference in product distribution between C15 and average of C2-C14 over various Ru-VOx/SiO2 catalysts.
As noted earlier, production of C15 showed the reactivity of Csecondary-Cprimary (undesirable) and
production of C2-C14 showed the reactivity of Csecondary-Csecondary (desirable), and so smaller value
of C15 - average(C2~C14) was more preferable. This value was decreased until V/Ru = 0.5, and then increased when V/Ru = 1.0. The formation of methane from n-hexadecane has two routes:
26
Csecondary-Cprimary dissociation co-produced with C15 and fragmentation. The degree of
fragmentation can be estimated by the difference of C1 (produced by Csecondary-Cprimary dissociation
or fragmentation) and C15 (only produced by Csecondary-Cprimary dissociation), and its trend on V/Ru
ratio is shown in Figure 2-3(c). The fragmentation degree was similar for catalysts with V/Ru = 0, 0.25, and 0.5. In the case of V/Ru = 1.0, the fragmentation proceeded more significantly than other catalysts. These data show that addition of V does not suppress fragmentation. Therefore, addition of appropriate amount of V improves regioselectivity by decreasing the formation of methane via terminal bonds, while the formation via fragmentation is not suppressed.
Catalyst stability
The reuse experiments were conducted to evaluate the stability of the Ru-VOx/SiO2 (V/Ru=0.25)
(Figure 2-4). First, the recovered catalyst without regeneration was used, but the activity became lower and lower by reuses (Figure 2-4(a)). Next, the recovered catalyst was reused without exposure to air, in order to check the effect of oxidation during the recovery process (Figure 2-4(b)). The activity was decreased similarly to the case of air-contacted sample (Figure 2-4(a)). Therefore, the cause of deactivation was not the oxidation of catalyst. Next, heating in N2 flow at
573 K was tested as regeneration in order to remove poisonous molecules, but the activity was even more decreased (Figure 2-4(c)). As shown in the previous section, some amount of carbonaceous species was produced in hydrogenolysis of squalane, and the carbonaceous species may be responsible to the deactivation. The amount of carbonaceous species seemed low (e.g. 0.012 g/gcatalyst in Ru-VOx/SiO2 (V/Ru = 0.25)), but it was enough to cover Ru surface: 0.012
g/gcatalyst corresponds to about 5 times of the number of surface Ru atoms in Ru-VOx/SiO2 (V/Ru
= 0.25), which is estimated from H2 chemisorption (characterization is described below). Then,
calcination in air at 573 K was tested as regeneration (Figure 2-4(d)). In this case, the catalyst showed comparable activity to the fresh catalyst, however, methane selectivity was increased and C14-C16 selectivity was decreased. Based on these data, the deactivation of Ru-VOx/SiO2 was
27
of Ru/CeO2 where the catalyst can be reused by simple filtration and drying [1,14]. At present, it
is difficult to retain the selectivity of Ru-VOx/SiO2 catalyst without loss of activity during reuses.
Characterization
To determine the valences of Ru and V species during the reaction, H2-TPR of Ru-VOx/SiO2 was
carried out. The profiles and consumption amounts are shown in Figure 2-5 and Table 2-3, respectively. The Ru species in the catalysts before reduction were Ru3+ (the same valence as the
precursor) or RuO2, the latter of which was indeed detected by XRD (Figure 2-6). The formation
of RuO2 during heating under N2 can be due to the oxidation of Ru3+ by nitrate ion. For Ru/SiO2
and all Ru-VOx/SiO2 catalysts, the reduction was almost completed at 513 K (standard reaction
temperature) during H2-TPR. Considering the lower H2 pressure in H2-TPR than that in catalytic
reaction, the catalyst was likely to be totally reduced during heating for catalytic reaction. For Ru/SiO2 (Ru: 5.0 10-4 mol/g), the H2 consumption amount was 1.1 10-3 mol/g, which is
comparable to the amount to reduce RuO2 to the metallic state in the catalyst. The valence change
of V was calculated assuming that Ru4+ was first reduced to Ru0. When V/Ru ratio was 0.25 and 0.5, V oxide was reduced from +V to +III, and when V/Ru ratio was 1.0, V oxide was reduced to mixed valence of +III and +IV. However, Bond et al. concluded in their report that Ru was perfectly reduced and V valence after reduction was +III by H2-TPR analysis of Ru-VOx/SiO2 (V/Ru = 2.32)
calcined in air [7]. Developed Ru-VOx/SiO2 catalysts were prepared by heating in N2 flow after
impregnation, and the difference in preparation method may affect the state of V species.
The XRD patterns of reduced catalysts at 513 K are shown in Figure 2-7. Broad signals of hcp Ru metal were observed. By Sherrer’s equation and the (011) peak at 43.8, the Ru particle size was about 4 nm regardless of V/Ru ratio from 0 to 1.0. XRD peaks for V species were not observed.
The formation of Ru metal nanoparticles and the change during reuses was confirmed by Ru K-edge XAS analysis. XANES and EXAFS patterns are shown in Figures 2-8 and 2-9, respectively, and the curve fitting results are summarized in Table 2-4. All reduced and used catalysts (Entries c-j) had essentially the same XANES spectrum as that of Ru powder, supporting that Ru was totally
28
reduced to the metallic state. From EXAFS analysis, the coordination number of Ru-Ru bond (CNRu-Ru) was almost the same for Ru/SiO2 and all Ru-VOx/SiO2 after reduction (7.6-8.2), and the
value agreed with the formation of ~4 nm nanoparticles as demonstrated by XRD. The CNRu-Ru of
used Ru-VOx/SiO2 was larger than that of fresh reduced one when contacted with air during the
recovery process, especially when the recovered catalyst was calcined before next use. On the other hand, the CNRu-Ru of used Ru-VOx/SiO2 which was collected in glove bag was similar to that
of fresh one. These data indicate that reaction of Ru particles with air causes the aggregation of Ru metal especially when calcined at high temperature. The increase of Ru particle size by calcination during reuses was also observed by XRD (Figure 2-10).
As shown in Figure 2-4(d), the catalyst calcined after recovery showed comparable activity to the fresh one, although the regioselectivity was decreased. The increase of Ru particle size during the calcination means that the activity per Ru surface site was increased. Considering that V modification decreased the activity, the calcination after recovery rather breaks the modification of Ru with V, decreasing the regioselectivity and increasing the activity of surface site.
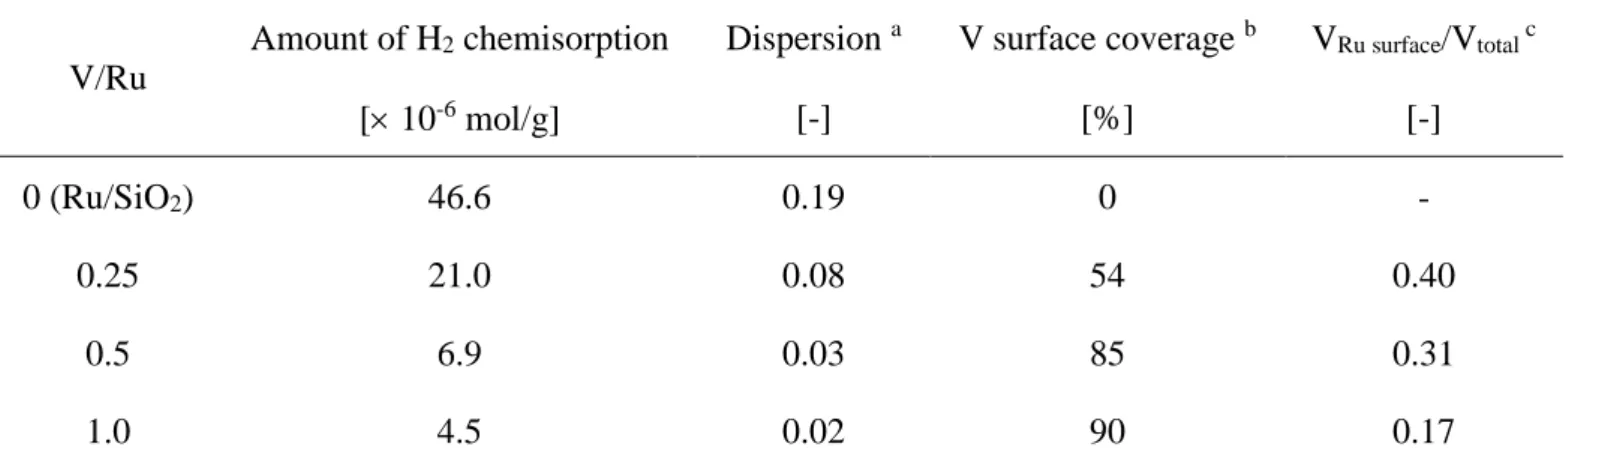
The amount of H2 chemisorption was measured to count the number of active surface metal atoms
(Table 2-5). In the literature, many noble metal catalysts modified with reducible metal oxide have smaller amount of H2 or CO chemisorption than the value expected from the particle size [15].
The decrease is due to the coverage of noble metal particles with reducible metal oxide. In this case, while the H2 chemisorption on Ru/SiO2 well accorded with the Ru particle size (dispersion
(H/Ru = 0.19)), the H2 chemisorption amount was decreased with increase of V amount. In
Ru-VOx/SiO2 (V/Ru = 0.25), about half of surface Ru was calculated to be covered by V species, and
in V/Ru = 1.0 catalyst the coverage became 90%. Assuming that one V atom blocks one active site, about half of V atoms in Ru-VOx/SiO2 (V/Ru = 0.25) can cover the surface of Ru particles.
In the catalysts with V/Ru = 0.5 and 1.0, the ratio of blocking V atoms to total V atoms became 0.31 and 0.17, respectively.
In the previous report, the regioselective hydrogenolysis of squalane by the high dispersion of Ru metal was implied [1]. Ru/CeO2 catalyst with lower CNRu-Ru (4.7) showed higher regioselectivity
29
while Ru/CeO2 catalyst with the same support and higher CNRu-Ru (10.0) showed lower
regioselectivity [1]. The difference of regioselectivity can be related to the ensemble size of Ru metal surface [13]. Addition of V atoms blocked the surface of Ru particles and might reduce the ensemble size of Ru metal surface. The reduced size of Ru ensemble may be related to the decrease of Ctertiary-C bond dissociations, leading to good regioselectivity.
2.4. Conclusions
Addition of V to Ru/SiO2 catalyst prepared by co-impregnation and heating under N2 improve
the regioselectivity in hydrogenolysis of squalane, although the activity is decreased. Ru-VOx/SiO2
(V/Ru = 0.25) gives lower methane selectivity and higher C14-C16 selectivity than Ru/SiO2. The
decrease of methane formation is mainly due to the suppression of terminal C-C bond dissociations, while the fragmentation is not so affected. Ru is totally reduced to ~ 4 nm metal particles in situ and V valence becomes +III ~ +IV. Much amount of V species are located on the surface of Ru particles, blocking the surface active sites. The blocking changes the selectivity patterns probably via reducing the ensemble size of Ru metal; however, it decreases the activity. Addition of V increases the carbonaceous species formation, and the produced carbonaceous species lowers the activity of catalyst during reuses.
References
[1] S. Oya, D. Kanno, H. Watanabe, M. Tamura, Y. Nakagawa, K. Tomishige, ChemSusChem 8 (2015) 2472-2475.
[2] Y. Nakagawa, Y. Shinmi, S, Koso, K. Tomishige, J. Catal. 272 (2010) 191-194.
[3] Y. Amada, N. Ota, M. Tamura, Y. Nakagawa, K. Tomishige, ChemSusChem 7 (2014) 2185-2192.
[4] T. Arai, M. Tamura, Y. Nakagawa, K. Tomishige, ChemSusChem 9 (2016) 1680-1688.
30
90 (1986) 5197-5201.
[6] A. J. D. Hartog, A. G. T. M. Bastein, V. Ponec, J. Mol. Catal. 52 (1989) 129-146. [7] G. C. Bond, S. Flamerz, J. Chem. Soc. Faraday Trans. 87 (1991) 767-774. [8] A. G. Ruiz, A. S. Escribano, I. R. Ramos, Appl. Catal. A 120 (1994) 71-83. [9] M. Pietrowski, M. Wojciechowska, Catal. Today 142 (2009) 211-214.
[10] S. Koso, H. Watanabe, K. Okumura, Y. Nakagawa, K. Tomishige, Appl. Catal. B 111-112 (2012) 27-37.
[11] A. Galadima, R. K. P. Wells, J. A. Anderson, Top. Catal. 55 (2012) 931-939. [12] D. W. Flaherty, E. Iglesia, J. Am. Chem. Soc. 135 (2013) 18586-18599.
[13] Y. Nakagawa, S. Oya, D. Kanno, Y. Nakaji, M. Tamura, K. Tomishige, ChemSusChem 10 (2017) 189-198.
[14] Y. Nakaji, S. Oya, H. Watanabe, M. M. Watanabe, Y. Nakagawa, M. Tamura, K. Tomishige,
ChemCatChem 9 (2017) 2701-2708.
31
Table 2-1. Hydrogenolysis of squalane over Ru/SiO2 catalysts modified with 2nd metal.
2nd Metal Time [h] Conv. a [%-C] Selectivity[%-C] C.B. b [%-C] C1 C2,C3 C4,C5 C6-C8 C9,C10 C11-C13 C14-C16 C17-C19 ≥C20 none 4 50.9 2.7 0.8 2.3 3.7 7.3 7.3 28.9 7.2 39.8 98.1 Re 1 51.5 5.1 1.3 3.3 5.2 8.6 7.9 24.8 6.6 37.3 101.0 Mn 4 60.1 2.2 0.7 2.6 4.1 8.6 7.8 30.6 7.2 36.0 98.8 Mo 9 56.2 2.1 0.7 2.3 4.5 7.7 8.2 27.7 7.5 39.1 106.7 Ni 9 41.7 2.0 0.6 2.5 3.0 7.7 5.4 33.1 5.0 40.7 97.3 W 15 63.0 2.8 0.5 2.5 5.1 8.4 8.7 29.3 7.4 35.4 103.6 V 15 50.2 2.2 0.6 2.4 3.2 7.8 5.8 35.2 5.2 37.5 104.7
a Conv. = Conversion, b C.B. = Carbon balance. Conditions: Ru-M/SiO
2 (Ru: 5 wt%, M/Ru= 0 or 0.25), 300 mg; squalane, 4.23 g (10 mmol); H2, 6 MPa;
32
Table 2-2. Hydrogenolysis of squalane over various Ru catalysts.
Catalyst Time [h] Conv. a [%-C] Selectivity [%-C] C.B. b [%-C] C1 C2,C3 C4,C5 C6-C8 C9,C10 C11-C13 C14-C16 C17-C19 ≥C20 Ru/SiO2 24 71.2 3.3 1.0 3.0 4.7 9.0 8.0 31.2 6.4 33.4 91.3 Ru-VOx/SiO2 96 72.7 2.8 0.9 3.0 4.8 10.2 7.9 37.3 5.1 28.1 99.8 Ru/CeO2 36 74.8 1.4 0.7 4.2 3.2 11.3 5.9 36.5 4.2 32.8 92.5 Ru-VOx/CeO2 24 81.4 2.2 1.1 4.0 4.2 11.3 7.8 34.8 5.4 29.3 92.2 Ru/Al2O3 12 77.8 3.9 1.9 2.7 5.7 7.0 11.3 22.2 10.4 35.0 93.8 Ru-VOx/Al2O3 12 76.9 3.7 1.9 2.7 6.3 7.2 11.8 21.4 10.6 34.3 95.3 Ru/MgO 18 78.7 4.7 2.0 2.7 5.7 6.9 11.7 21.5 10.2 34.6 100.7 Ru-VOx/MgO 36 82.4 4.5 1.9 3.0 6.9 8.2 12.4 22.6 9.6 30.9 98.8 Ru/TiO2 12 92.5 5.0 2.0 3.5 7.1 10.1 13.2 27.4 8.8 22.9 95.2 Ru-VOx/TiO2 12 91.0 4.2 1.6 3.3 7.0 10.7 12.5 28.8 8.2 23.6 100.9 Ru/ZrO2 12 86.6 3.0 1.4 3.6 6.7 10.8 11.8 27.8 8.5 26.5 103.2 Ru-VOx/ZrO2 18 83.0 2.5 1.2 3.1 5.4 9.9 10.6 29.3 8.4 29.5 100.0
a Conv. = Conversion, b C.B. = Carbon balance. Conditions: catalyst (Ru: 5 wt%, V/Ru = 0 or 0.25), 100 mg; squalane, 4.23 g (10 mmol); H
2, 6 MPa;
33
Table 2-3. Detailed data of Figure 2-5
Entry Catalyst Ru loading amount [ 10-4 mol/g] V loading amount [ 10-4 mol/g] H2 consumption a [10-3 mol/g] Reduction degree Ru b V c 1 VOx/SiO2 - 1.24 0.25 - 1.01
2 Ru-VOx/SiO2(V/Ru=1.0) 4.95 4.95 1.63 1.65 0.65
3 Ru-VOx/SiO2(V/Ru=0.5) 4.95 2.47 1.48 1.49 0.98
4 Ru-VOx/SiO2(V/Ru=0.25) 4.95 1.24 1.25 1.27 1.06
5 Ru/SiO2 4.95 - 1.08 1.09 -
Assumed reactions: RuO2 + 2H2 → Ru + 2H2O, V2O5 + 2H2 → V2O3 + 2H2O a H
2 consumption is calculated in the range from 650 to 1000 K (Entry 1) and 320 to 550 K (Entry 2-5). b Reduction degree of Ru = H
2 consumption / (Ru loading amount × 2) c Reduction degree of V = (H
34
Table 2-4. Curve fitting results of Ru K-edge EXAFS and average particle size of various Ru catalysts
Entry a Shells CN b R c [0.1 nm] E0d [eV] e [0.1 nm] Rff [%] Ru particle size (XRD) [nm] a Ru-Ru 12 2.68 0.00 0.06 - - b Ru-O 6 1.97 0.00 0.06 - - c Ru-Ru 7.6(±0.6) 2.63(±0.01) -1.9(±2.5) 0.086(±0.002) 0.73 4.8 d Ru-Ru 8.0(±0.5) 2.63(±0.01) -1.8(±2.5) 0.081(±0.002) 0.48 4.4 e Ru-Ru 8.2(±0.7) 2.61(±0.01) 0.1(±2.5) 0.088(±0.003) 0.77 4.8 f Ru-Ru 8.2(±0.5) 2.61(±0.01) -1.9(±1.5) 0.086(±0.002) 0.32 4.9 g Ru-Ru 9.7(±0.5) 2.62(±0.01) -0.6(±2.0) 0.083(±0.001) 0.21 6.7 h Ru-Ru 7.5(±0.6) 2.62(±0.01) -1.9(±2.5) 0.084(±0.002) 0.62 4.7 i Ru-Ru 9.5(±0.5) 2.62(±0.01) 0.1(±1.5) 0.083(±0.001) 0.25 6.1 j Ru-Ru 10.3(±0.5) 2.63(±0.01) -0.5(±1.5) 0.073(±0.001) 0.20 13.8
Fourier filtering range 0.1688-0.2884 nm. a Corresponding to Figures 2-8 and 2-9. b Coordination number; c Bond distance; d Difference in the origin of photoelectron energy between the reference and the sample; e Debye-Waller factor; f Residual factor.
35
Table 2-5. Summary of H2 chemisorption on Ru-VOx/SiO2 (Ru: 5.010-4 mol/g)
V/Ru
Amount of H2 chemisorption Dispersion a V surface coverage b VRu surface/Vtotal c
[ 10-6 mol/g] [-] [%] [-] 0 (Ru/SiO2) 46.6 0.19 0 - 0.25 21.0 0.08 54 0.40 0.5 6.9 0.03 85 0.31 1.0 4.5 0.02 90 0.17 a Dispersion = 2 (Amount of H
2 chemisorption) / (Ru amount in catalyst) b V surface coverage = {(Amount of H
2 chemisorption on Ru/SiO2) 2 – (Amount of H2 chemisorption on Ru-VOx/SiO2) 2} / {(Amount of H2
chemisorption on Ru/SiO2) 2} 100 [%] c V
36
Scheme 2-1. The two routes of production of methane: (a) dissociation of Ctertiary -Cprimary bonds,
(b) fragmentation.
CH4 CH4
(b) (a)
37
Figure 2-1. Results of hydrogenolysis of squalane over Ru-VOx/SiO2 catalysts with various V
amounts. (a) Squalane conversion vs reaction time, (b) Relation between methane selectivity and squalane conversion, (c) Relation between C14-C16 selectivity and squalane conversion. Conditions: catalyst (Ru: 5 wt%), 300 mg; squalane, 4.23 g (10 mmol); H2, 6 MPa; 513 K; 2-39 h.
(a) (b) 0.0 1.0 2.0 3.0 4.0 5.0 6.0 0 20 40 60 80 100 Methan e s el ec ti v ity [%] Conversion [%] 0 0.25 0.5 1 V/Ru=0 V/Ru=0.25 V/Ru=0.5 V/Ru=1.0 (c) 0 5 10 15 20 25 30 35 40 45 0 20 40 60 80 100 C14 -C16 s el ec ti v ity [%] Conversion [%] 0 0.25 0.5 1 V/Ru=0 V/Ru=0.25 V/Ru=0.5 V/Ru=1.0 0 10 20 30 40 50 60 70 80 90 100 0 10 20 30 40 Conv ersi on [%] Time [h] 0 0.25 0.5 1 V/Ru=0 V/Ru=0.25 V/Ru=0.5 V/Ru=1.0
38
Figure 2-2. TG-DTA profiles of Ru-VOx/SiO2 catalysts after hydrogenolysis of squalane. (a) V/Ru
= 0 (4 h) (b) V/Ru = 0.25 (15 h) (c) V/Ru = 0.5 (24 h) (d) V/Ru = 1.0 (24 h). Sample amount for TG 10 mg; under air. Conditions: Ru-VOx/SiO2, 300 mg; squalane, 4.23 g; V/Ru = 0-1.0; H2, 6
MPa; 513 K, 4-24 h. -100 0 100 200 300 400 500 600 700 -1 -0.8 -0.6 -0.4 -0.2 0 0.2 0.4 0 10 20 30 40 T emperature [K] or DT A [ V] W eight [mg] Time [min] -100 0 100 200 300 400 500 600 700 -1 -0.8 -0.6 -0.4 -0.2 0 0.2 0.4 0 10 20 30 40 T emperature [K] o r DT A [ V] W ei ght [ mg] Time [min] -100 0 100 200 300 400 500 600 700 0 10 20 30 40 -1 -0.8 -0.6 -0.4 -0.2 0 0.2 0.4 T emper atur e [K] or DT A [ V] Time [min] W ei ght [mg ] -100 0 100 200 300 400 500 600 700 -1 -0.8 -0.6 -0.4 -0.2 0 0.2 0.4 0 10 20 30 40 T emperature [K] o r DT A [ V] W ei ght [mg ] Time [min] (a) (b) (c) (d) TG TG TG TG DTA DTA DTA DTA Temperature Temperature Temperature Temperature
39
Figure 2-3. Hydrogenolysis of n-hexadecane over Ru-VOx/SiO2 (V/Ru = 0-1.0). Average of four
runs for each catalyst. (a) Conversion and molar-based product distribution, (b) [C15 - (average of (C2~C14))], (c) [C1 - C15]. Conditions: catalyst, 20 mg; n-hexadecane, 2.26 g (10 mmol); H2, 6
MPa; 513 K; 1 h (V/Ru = 0), 2 h (V/Ru = 0.25), 3 h (V/Ru = 0.5), 5 h (V/Ru = 1.0).
0 2 4 6 8 10 12 14 16 18 0 0.25 0.5 1.0 Produc t di s tributi on di fference of [ C1 -C15 ] [mol %] V/Ru ratio 0 2 4 6 8 10 12 14 16 0 0.25 0.5 1.0 Produc t di s tributi on di fference of [ C15 -av erage(C2~C14 )] [mol %] V/Ru ratio (a) (b) (c) 0 5 10 15 20 25 30 1 2 3 4 5 6 7 8 9 10 11 12 13 14 15 16 Product dis tribution [mol % ] Carbon number 0 0.25 0.5 1 V/Ru=0 (Conv. = 6.5%) V/Ru=0.25 (Conv. = 5.8%) V/Ru=0.5 (Conv. = 3.9%) V/Ru=1.0 (Conv. = 9.3%)
![Table 1-4. Gasoline composition per hydrocarbon group and by carbon number. [15]](https://thumb-ap.123doks.com/thumbv2/123deta/5898008.1049001/25.892.110.809.166.443/table-gasoline-composition-hydrocarbon-group-carbon-number.webp)
![Table 1-5. Amount of products from petrochemical industry in 2018 [17]](https://thumb-ap.123doks.com/thumbv2/123deta/5898008.1049001/26.892.85.665.139.1133/table-products-petrochemical-industry.webp)


![Table 2-3. Detailed data of Figure 2-5 Entry Catalyst Ru loading amount [ 10 -4 mol/g] V loading amount [ 10-4 mol/g] H 2 consumption a [10-3 mol/g] Reduction degree Ru b V c 1 VO x /SiO 2 - 1.24 0.25 - 1.01](https://thumb-ap.123doks.com/thumbv2/123deta/5898008.1049001/41.1262.88.1021.148.422/table-detailed-figure-catalyst-loading-loading-consumption-reduction.webp)
![Table 2-4. Curve fitting results of Ru K-edge EXAFS and average particle size of various Ru catalysts Entry a Shells CN b R c [0.1 nm] E 0 d [eV] e [0.1 nm] R f f [%] Ru particle size (XRD) [nm] a Ru-Ru 12 2.68 0.00 0.06 - - b Ru](https://thumb-ap.123doks.com/thumbv2/123deta/5898008.1049001/42.1262.85.962.149.611/fitting-results-average-particle-various-catalysts-shells-particle.webp)