1. Introduction
Inflation control was one of the remarkable achievements that Vietnam’s economic reform so called “Doi moi” has gained. From three-digit figures during 1986-1989 (average 318 percent annually), inflation fell to two-digit figures during 1990-1995 (except the year 1993) and down to below 10 percent since then. The average inflation rate during 1996-2003 was 3.9 percent, and deflation occurred in 2000 and 2001.
However, from 2004 to 2006, the inflation rate soared to reach the average level of 8.2
Current Inflation in Vietnam and Some Suggestions
for Monetary Policy
Nguyen Thu Kim
*, Junichi Hirata
**Abstract
This paper aims at explaining the current inflation phenomenon in Vietnam. Although food and oil price shocks have resulted in inflation in many countries, the inflation rate in Vietnam has been excessively high. This paper examines monetary policy in Vietnam, focusing in particular on the sterilization tools that the State Bank of Vietnam used to cope with inflation. It is found that in the context of surplus overall balance of payments, the attempt to maintain the fixed exchange rate, together with the inability to conduct sufficient sterilization, has worsened the inflation problem in Vietnam.
Key words :
Vietnam, inflation, monetary policy, open market operation, balance of payment, exchange rate policy.
* Correspondence to : Nguyen Thu Kim
Faculty of Economics, Ritsumeikan University/Graduate Student e-mail : [email protected]
**Correspondence to : Junichi Hirata
Faculty of Economics, Ritsumeikan University/Professor
percent per year, higher than the period’s average real Gross Domestic Product (GDP) growth rate (8.1 percent). In 2007, the inflation rate continued its upward trend to reach 12.6 percent.
So far little research has been done on inflation in Vietnam. Nguyen Tri Hung [1999] investigated the causes of the hyper inflation period 1986-1989. He concluded that the acute inflation was the result of the General Adjustment of Price, Wage and Money conducted in 1985, which monetized people’s income.1)
As the rationing system was removed, aggregate demand increased while aggregate supply was rigid due to weak domestic production capability. Government’s budget deficit was financed by money creation as the government’s revenue covered only 55 percent of its expenditure and the chance to borrow from abroad was limited.2)In the following period of 1989-1995, inflation fell considerably thanks to the government’s supply-side policies to promote aggregate supply and the use of non-inflationary financing of the budget deficit.3) In a research conducted by the International Monetary Fund (IMF) on Vietnam’s recent inflation phenomenon, the two main contributing factors to inflation are the increase in food and oil prices, and the overheating of the economy which has led to excessive demand. (IMF country report [2006])
It is undeniable that the food and oil price shocks since 2004 are important causes of the current inflation problem in Vietnam. However, while most of these shocks were common to the rest of the region, the inflation rate in Vietnam has been higher than other emerging economies in Asia.
The inflation phenomenon in Vietnam, therefore, reflects some problems inherent in the economy. This paper will focus on the ineffectiveness of the sterilization operation, given the government’s attempt to maintain the fixed exchange rate system when facing with increasing foreign capital inflows.
Following this introduction, this paper consists of five more sections. Section 2 provides an overview of important economic reforms and section 3 examines the current situation of the country’s balance of payments. Section 4 continues with the analysis of the exchange rate policy and section 5 discusses the monetary policy with a focus on the sterilization conduct. Section 6 concludes the paper with some recommendations.
2. Important economic reforms and the current situation
After the Vietnam war ended in 1975, and before the economic reform started in 1986, the Vietnamese government adopted a centrally-planned system in which every aspect of the economy was under the rigid control of the government. There were only two economic sectors dominating the economy, namely State owned enterprises (SOEs) and agricultural cooperatives. All production, distribution and even monetary policy operations, had to comply with the government’s plans. This mechanism hindered economic development, causing a continuous shortage of commodities and led to hyper-inflation.
In this context, the sixth Congress meeting of the Vietnam Communist Party held in December 1986 set forth a renovation policy known as “Doi moi.” Among many targets of the economic reform, opening the domestic market, and at the same time stabilizing the macroeconomic situation, were two major ones.
The Law on foreign investment passed in December 1987 marked the first step in the process of opening the Vietnamese market to foreign investors. Since then, several important events have demonstrated the increasing integration of the economy. Vietnam joined the Association of South East Asian Nations (ASEAN) in 1995 and the Asia Pacific Economic Cooperation (APEC) in 1998. In July 2000, Vietnam signed a Bilateral Trade Agreement with the USA, and in January 2007, Vietnam became a member of the World Trade Organization (WTO).
To stabilize the economy, curbing the hyperinflation rate was a key task. Reforms in both the supply side of the economy and the financial system successfully achieved this task. The inflation rate fell to two-digit figures during 1990-1995 and remained under control during 1995-2003 period. However, since 2004, the inflation rate has jumped to a much higher level than the previous period. The inflation rate in 2004 was 9.5 percent, dropped slightly during 2005-2006, but then soared to two digit figures during 2007.
Figure1 Inflation rate in Vietnam
Source : Vietnam’s General Statistic Office
3 N. T. Kim, J. Hirata, Current Inflation in Vietnam and Some Suggestions for Monetary Policy
As Table 1 shows, the average inflation rate in Vietnam during 2004-2006 was the highest compared with the average inflation rate of four ASEAN countries and four newly-industrialized economies.
Average inflation rate
ASEAN-4 5.85
Newly-industrialized economies (NIEs) 1.64
Vietnam 8.20
Table 1 Average inflation rate from2004to2006(Unit : Percentage)
Source: IMF country report [2006] ASEAN-4 includes: Indonesia, Malaysia, Philippines and Thailand
NIEs includes: HongKong, Korea, Singapore, Taiwan
Analyses in the following sections will show that the inflation during 2004-2006 was partly due to the fact that reforms in the financial system are insufficient and seem incompatible with the accelerating process of market opening. In particular, the increasing capital inflows, combined with an inflexible exchange rate and weak monetary operation, have contributed to the recent inflation problem in Vietnam.
3. The balance of payments
The country’s integration into the world market has led to increases in import and export activities (though import value still exceeds export value), and rising foreign capital inflow. As can be observed from Table 2, the foreign capital inflow has more than offset the current account deficit, leading to surplus overall balance.
A closer look at the balance of payments can help explain for the overall balance surplus. It is noticeable that the trade balance, though in deficit, seems to have been stable since 2003.4)The stable trade deficit has an important implication because it partly explains the sharp increase in the overall balance surplus, which, as will be shown later in the paper, has contributed to the high inflation rate in Vietnam. In order to account for this stability, the import and export structure is worth considering.
As for import structure, it can be seen from Figure 2 that production inputs (including machinery, equipment, fuel and non-fuel production materials) account for the main part of the total imports of Vietnam. In fact, the percentage of production inputs over total import stayed at approximately 60. 8 percent during 1986-2005, of which petroleum products, steel, iron and fertilizer accounted for approximately 20 percent of total imports (see Table 3).
Figure 2 Vietnam’s import structure
Source: Statistical Yearbook of Vietnam [2006]
2002 2003 2004 2005 2006 Petroleum products 10.2 9.7 11.2 13.7 13.3 Steel and iron 6.8 6.7 8 8.1 6.5 Fertilizer 2.4 2.5 2.4 1.8 1.5
Table 3 Share of important production inputs over total import value (Unit : Percentage)
Source: IMF country report [2007]
2002 2003 2004 2005 2006
Current account balance ")*) "$!,&( "$!()( "',* "$)'
Trade balance −1,054 −2,582 −2,287 −2,439 −2,776 Non-factor services (net) −749 −778 −871 −219 −8 Investment income (net) −794 −814 −891 −1,219 −1,429 Transfers (net) 1,921 2,239 2,485 3,380 4,049 Private 1,767 2,100 2,310 3,150 3,800 Official 154 139 175 230 249
Capital account balance $!#*$ '!#+) %!''* %!)%+ '!'+)
FDI inflows 2,023 1,894 1,878 1,954 2,400 FDI loan repayments 414 590 536 524 643 Medium and long-term loans (net) 458 974 1,396 1,360 1,139 Portfolio investment n.a n.a n.a 865 1,313 Short-term capital −996 1,808 −291 −1,027 277
Overall balance &,( %!$($ ++& %!$&$ '!&%%
Financing −464 −2,151 −883 −2,131 −4,322 Change in SBV’s NFA (−, increase) −464 −2,151 −883 −2,131 −4,322
Table 2 Vietnam’s balance of payments (Unit : million US dollars)
Source : IMF country report [2007]
5 N. T. Kim, J. Hirata, Current Inflation in Vietnam and Some Suggestions for Monetary Policy
On the other hand, as indicated by Table 4, main exports include crude oil and coal, agricultural and aquatic products, footwear and garments, and electronics and computer appliances. It should be noted here that besides crude oil, food and foodstuffs (which belong to agricultural and aquatic products) are the main exports of Vietnam, and the prices of those exports increased sharply in the period of study.
2001 2002 2003 2004 2005 2006 Crude oil and coal 21.6 20.5 19.9 22.7 24.8 23.1 Agricultural and aquatic products 24.3 23.9 22.4 20.3 17.5 17.9 Footwear and garments 23.6 27.6 29.6 26.6 24.1 23.6 Electronics and computer appliances 4.0 4.5 3.3 4.1 4.4 4.3
Table 4 Share of main exports over total export value (Unit : Percentage)
Sources: General Statistic Office [2005], IMF country report [2007]
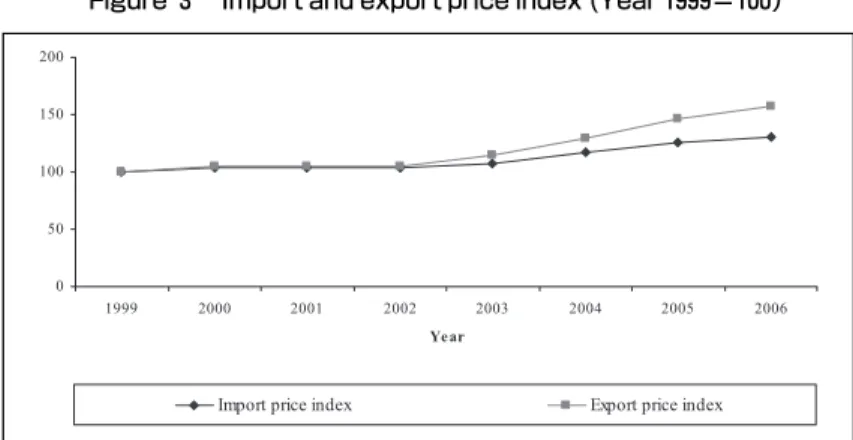
Given the import and export structure, the import and export price indexes are now examined. As Figure 3 demonstrates, the export price index increase more than offsets the increase in the import price index. In particular, as can be seen in Figure 4, the exported oil price index closely follows the imported oil price index and the correlation coefficient between the two price indexes is 0.998. As a result, the international oil price shock was not totally a disadvantage to Vietnam’s trade balance. In addition, in Table 5 which shows the export price index of consumer goods, the food and foodstuffs price index increase is the highest. In comparison with the price index of imported fuels and other production inputs, the price index of exported food and foodstuffs is higher (see Figure 5).
Figure 3 Import and export price index (Year1999=100)
Source: Statistical Yearbook of Vietnam [2006]
Figure 4 Imported oil price index and exported oil price index (Year2000=100)
Source: IMF country report [2007]
Year General consumer goods Food and foodstuffs Non-food and non-foodstuffs
2000 100 100 100 2001 101.1 103.1 99.3 2002 102.3 106.1 98.7 2003 107.7 115.5 99.9 2004 112.1 123.1 101.2 2005 116.7 133.8 101.1 2006 120.9 142.7 102.2
Table 5 Consumer goods’ export price index
Source: Statistical Yearbook of Vietnam [2006]
Figure 5 Import price index of fuels and non-fuel production materials and export price index of food and foodstuffs. (Year 2000=100)
Sources: Statistical Yearbook of Vietnam [2006] and calculation by author
7 N. T. Kim, J. Hirata, Current Inflation in Vietnam and Some Suggestions for Monetary Policy
The export price advantage over import price can help account for the stable trade deficit that is observed for the period 2003-2006. Besides the trade balance, there is another item on the current account balance that is worth considering. As can be seen from Table 2, the transfer item has continuously increased and the amount in 2006 was twice that of 2002. This is thanks to the soar in remittances reflected as private transfer, which has kept rising since 1995 (see Figure 6).
Figure 6 Net private transfers to Vietnam
Source: IMF country report [1998, 2007]
In fact, the private transfer increase has helped offset most of the trade deficit, leaving the current account nearly balanced in 2006. On the other hand, with increasing inflows of foreign direct investment (FDI), medium and long term loans, and portfolio investments, the overall balance surplus in 2006 was nearly eleven times the surplus in the year 2002. In fact, according to an IMF country report in 2003, the overall balance has turned into a surplus since 1999. However, the surpluses during 1999-2001 stood at an annual average of 385 million US dollars. Compared to that period, the annual overall balance surplus during 2003-2006 was six times higher, averaging at 2.37 billion US dollars.
The surplus overall balance has put upward pressure on Vietnamese Dong (VND). To keep the exchange rate stable, the State Bank of Vietnam (SBV) has intervened in the foreign exchange market by purchasing US dollar. Meanwhile, this foreign exchange intervention has been sterilized to reduce the amount of VND in circulation.
However the sterilization has not shown to be effective. While SBV’s foreign exchange reserve increases, monetary base (M0) also keeps increasing. In fact the correlation
Year 2001 2002 2003 2004 2005 2006 Mar-07 Jun-07 Official reserves 3,601 3,692 5,620 6,314 9,597 11,483 17,244 20,026
Table 6 SBV’s foreign exchange reserves (Unit : million US dollars)
Source: IMF country report [2007]
coefficient between foreign exchange reserves and M0 during 2002-2006 was 0.985. A simple regression of M0 on the annual foreign exchange reserve during 1995-2006 was performed and the result was a positive and statistically significant relationship between two variables. In particular, when M0 was regressed on the foreign exchange reserves (abbreviated as RESERVES in the regression), the result equation was:
M0=2397.193 + 19.38 × RESERVES, R2= 0.98, (25.4)
where R2is coefficient of determination.
Checking for the first difference, the result equation was:
M0−M0 (−1) = 5760.744 + 13.88 × [RESERVES − RESERVES (−1)], R2=0.63. (3.94)
As reflected in the regression results, the effectiveness of the sterilization needs to be thoroughly examined. However, before elaborating on the sterilization issue, section 4 will analyze the exchange rate management system that SBV has pursued.
4. The exchange rate policy
Before 1988, under the centrally-planned regime, a multi-exchange rate system determined solely by the SBV was in use. Though the SBV announced an official exchange rate, different percentages were added to, or subtracted from, the official exchange rate when applied to various transactions. In particular, the exchange rates were determined differently depending on whether the trading took place between Vietnam and a socialist country or a capitalist country. Also, different exchange rates were applied for traded goods versus non-traded goods. Non-traded goods were those exported or imported for diplomatic, training or conference purposes. The exchange rates applied to exporters and importers also varied, with those applied to exporters higher than those applied to importers. Besides, a different exchange rate was used for exchanging foreign remittances into VND.
The existence of the fixed exchange rate and multi-exchange rate system, determined solely by the SBV, had a consequence that the exchange rates did not reflect market supply and demand of foreign currencies. As a result, a black market for foreign exchanges was in existence together with the official market, and there was a big gap between the official exchange rates and the black market exchange rates during this time period (see Table 7).
In an effort to reduce the gap between the official and market exchange rates, SBV conducted several reforms on the exchange rate management system. In 1989, the
multi-9 N. T. Kim, J. Hirata, Current Inflation in Vietnam and Some Suggestions for Monetary Policy
exchange rate system was replaced by one official exchange rate system, to be determined solely by the SBV. In 1991, two foreign exchange trading centers were established in Hanoi and Hochiminh city so that banks and enterprises could negotiate exchange rates in their transactions. Participants in the trading centers included the SBV, commercial banks that were authorized to trade foreign currencies, and export and import companies. However, the exchange rates in the centers were not totally determined by supply and demand, but had to be subject to SBV’s regulations and intervention. For example, it was stipulated that the exchange rates realized in a day be within 5 percent of the average exchange rate determined on the previous trading day. Based on the exchange rate formed in the trading centers, SBV determined an official exchange rate.
Though the official exchange rate was based on the exchange rate formed in the trading centers, which was in turn subject to the SBV’s intervention, during 1991-1992, the official exchange rates depreciated sharply, and more closely approached the market exchange rates. In fact, the average official exchange rate in 1992 was VND11, 199/US dollar, while the average market exchange rate was VND11, 334/US dollar.
However, since the two foreign exchange trading centers were established in Hanoi and Hochiminh city only, and the members needed to be present at those trading centers to conduct transactions, it was very inconvenient for those located in other areas to participate. Besides, the technical infrastructure of the trading centers was so poor that it took long time for transactions to be clear (Nguyen Van Tien, [2001]). These were the main reasons for the establishment of the Interbank foreign exchange market in 1994.
In October 1994, the Interbank foreign exchange market was set up, replacing the two foreign currency trading centers. Participants in the Interbank market included the SBV and authorized commercial banks. The Interbank market was different from the previous two foreign currency trading centers in that it did not allow the participation of export and import companies. However, like the previous system, the exchange rate determined in this
Year Official exchange rate Market exchange rate
1985 15 115
1986 80 425
1987 368 1270
1988 3000 5000
1989 3900 4750
Table 7 Official exchange rate and market exchange rate (VND/US dollar)
Source: State Bank of Vietnam
Figure 7 Average official exchange rates
Source: State Bank of Vietnam
market was just a reference for the SBV in determining the official exchange rate.
The export and import companies had to conduct foreign currency transactions with the commercial banks. The exchange rates applied in transactions between commercial banks and companies had to lie within a band around the official exchange rate. As can be seen from Table 8, from July 1994 to February 1999, the bands around the official exchange rate varied, and especially widened during 1997-1999. According to SBV, the fluctuation band was increased during this period to provide an incentive to exports which were negatively affected by the Asian financial crisis.
Since February 1999, with Decision 64 QD/NHNN 7, the SBV has directly used the Interbank average exchange rate as the official exchange rate. Instead of determining the
Time period Exchange rate band
From Jul94to Oct94 Spot Rate Max = Official Rate+0.1% Spot Rate Min = Official Rate From Nov94to Nov96 Spot Rate = Official Rate±0.5% From Dec96to Feb97 Spot Rate = Official Rate±1% From Mar97to Oct97 Spot Rate = Official Rate±5% From Nov97to Aug98 Spot Rate = Official Rate±10% From Sept98to Feb99 Spot Rate = Official Rate±7%
From Mar99to Jul02 Spot Rate = Interbank average exchange rate±0.1% From Aug02to Dec06 Spot Rate = Interbank average exchange rate±0.25% From Jan07to Dec07 Spot rate = Interbank average exchange rate±0.5% From Jan08to Mar08 Spot rate = Interbank average exchange rate±0.75% From Apr08to present Spot rate = Interbank average exchange rate±1%
Table 8 Exchange rate bands for transactions between commercial banks and their clients
Source: State Bank of Vietnam
11 N. T. Kim, J. Hirata, Current Inflation in Vietnam and Some Suggestions for Monetary Policy
official exchange rate, SBV announces the Interbank average exchange rate and the fluctuation band is stipulated around the Interbank average exchange rate. Hence, in Table 8, for the period from February 1999 onward, the term “Official rate” was replaced by the term “Interbank average exchange rate”.
The Interbank average exchange rate, however, is not totally determined by supply and demand. Instead, the Interbank exchange rates realized in a day must be within 0.25 percent of the Interbank average exchange rate of the previous day. The SBV reserves the right to intervene in the Interbank market by buying or selling foreign exchanges.
As can be observed from Figure 7, except for the period 1990-1992 and 1998-1999, the exchange rate has been quite stable. Even after February 1999, when the Interbank average exchange rate was used as the official exchange rate, no dramatic changes in exchange rates can be observed. Though the exchange rate system from 1999 to the present was claimed by the SBV as the managed-floating exchange rate, the SBV intervention seems so heavy that it should rather be considered as a fixed exchange rate system.
During 2004-2007 period, the Interbank average exchange rate adjusted gradually upward, from approximately VND 15, 600/US dollar to the level of around VND 16, 100/US dollar. Under the pressure of surplus overall balance of payments, the gradual increase in the Interbank average exchange rate means that the SBV has extensively intervened in the foreign exchange market. The US dollar purchase by SBV must be accompanied with the sterilization operation to avoid the increase of VND in circulation. However, as indicated in section 5, the infant state of both the monetary market and monetary operation has led to ineffective sterilization.
5. Monetary policy and the open market operation
This section tackles the effectiveness of the sterilization operation. The analysis starts with a discussion about the general monetary policy of Vietnam, and then focuses on the open market operation (OMO).
5-1. Monetary policy
Prior to 1988, under the centrally-planned system, SBV provided nearly all banking services in accordance with the national plan. Since financial resources were scarce, bank lending was state directed and credit rationing was imposed. However, under SBV there were two specialized departments responsible for financing trade and infrastructure projects.
In March 1988, the mono-bank system was replaced by a two-tier banking system including the SBV and four state-owned commercial banks (SOCBs), two of which used to be the two specialized departments under SBV. Since 1991, the private sector was allowed to set up joint-stock commercial banks and since 1992 foreign banks could open local branches in the Vietnamese market. However, with another SOCB set up in 1997, the five SOCBs still dominate the banking system, accounting for around 80 percent of loans and deposits in Vietnam (World Bank [2006]).
On the other hand, according to the Law on State Bank [1997, 2003], the SBV belongs to the government and does not have the exclusive power to conduct monetary policy. The SBV just plays a role of a participating member in the establishment of the monetary policy. The government builds the annual plan of national monetary policy in which it determines the target rate of inflation and decides on the amount of money supply added to circulation. Then, the plan is submitted for the evaluation and final decision of the National Congress. The Congress will make decisions on monetary policy in relation to the government budget plan and the targeted economic growth rate.
The monetary policy has been targeted to “stabilize currency value, control inflation, promote socio-economic development, maintain national security, and improve people’s living standard” (Law on State Bank [1997]). According to this statement, the monetary policy seems to have multi targets with no clear priority.
Though the operating target was not explicitly stated, the de facto operating target is the reserve aggregate. Decision number 37/2000/QD-NHNN1 on 24thJanuary, 2000 guided the control of commercial banks’ reserves at SBV. M2 and the total credit balance are selected to be the intermediate targets.5)
The reform in monetary policy has been conducted gradually, replacing credit lines and liberalizing interest rates.6)In the 1990s, SBV relied mainly on credit line and interest rate framework (i.e, interest rate floor and ceiling) to intervene in the economy. Recently, OMO and basic rates as a reference for market interest rates have been introduced. Though the required reserve ratio was introduced in 1992, it has been used more frequently in the recent period.
It can be drawn from the above analysis that the monetary market of Vietnam is still in an early stage of development, with the dominance of SOCBs, the dependent position of the SBV and the new introduction of conventional tools like OMO in the conduct of monetary policy. This general situation may help explain the ineffectiveness of the open market operation conducted in the study period.
13 N. T. Kim, J. Hirata, Current Inflation in Vietnam and Some Suggestions for Monetary Policy
Time Monetary tools 1992-present Required reserve ratio. 1994-1998 Credit line
1997-present Refinancing loans (*) 1999-present Discount loans (*)
Jul2000-present Open market operation Aug2000-Jun2002 Basic interest rate with bands Jul2002-present Basic interest rate as a reference rate
Table 9 Tools of the monetary policy in Vietnam
Sources: Le Thi Tuan Nghia, PHD thesis [2004], SBV [2006]
(*) Refinancing loans are collateralized loans that SBV provides for commercial banks. Collaterals include SBV bills, government bonds, and other securities having the maximum of two years until the due date. Discount loans, on the other hand, are provided to commercial banks by rediscounting commercial drafts.
5-2. Open market operation
OMO is the operation in which SBV and commercial banks buy and sell short-term securities to change the monetary base and hence change the short-term interest rates. In Vietnam, the two main securities traded in OMO are Treasury bills and SBV bills. For Treasury bills, OMO is the secondary market trading where Treasury bills issued in the primary market can be traded between SBV and commercial banks. For SBV bills, OMO is both the primary market and secondary market transactions where SBV bills are issued and then traded between SBV and commercial banks. There are two forms of trading by OMO, including repurchase agreements (or repos) and outright transactions. A repurchase agreement is a form of transaction in which securities are sold (bought) by one party only to be bought (sold) back at a higher price by that party after a short time. Outright transaction is the purchase (sale) of securities without any agreement to sell (buy) back. However, the conduct of OMO has not attracted the participations of commercial banks. In fact, up to 90 percent of trading sessions have less than four commercial banks, and many sessions have only one commercial bank participating (Le Thi Tuan Nghia [2004]). Moreover, the frequency of OMO sessions is low.
There are several reasons for this situation. First is the underdevelopment of the primary market for Treasury bills due to low interest rates and shortage of various maturities. In fact, Treasury bill’s interest rates are low compared with the market interest rates. Given the high deposit interest rates that commercial banks have to pay for depositors, it is not profitable for them to invest in Treasury bills. So far, mainly state-owned commercial banks have bought Treasury bills. Joint-stock commercial banks often offer higher interest rates for their deposits, which force them to look for more profitable
investments and refrain from offering low interest rates competing against state-owned commercial banks in OMO trading sessions (Le Thi Tuan Nghia [2004]).
On the other hand, various maturities of Treasury bills are unavailable for OMO. In fact Treasury bills are mainly issued to finance government deficits. The issuance of Treasury bills to create commodities for OMO has not been emphasized. As a result, until now short-term Treasury bills only included the 364-day maturity. The unavailability of other shorter maturities means that commercial banks do not have many choices in their investment. In addition, the underdevelopment of the secondary market makes the liquidity of Treasury bills very low, further discouraging the purchase of commercial banks.
Second, OMO interest rates, which are the interest rates for repurchase agreements and outright trading are low. This is because the OMO interest rates are under the control of SBV, even when the trade is conducted through interest rate bids. According to SBV’s regulation on OMO, OMO is conducted through either quantity bid or interest rate bid. For the quantity bid, the OMO interest rates will be pre-determined by the SBV. For the interest rate bid, the bid-winning interest rates must lie in the interest rate range set by SBV (SBV’s regulation on OMO [2007]). Obviously the interest rate range was set at low
Time Frequency of sessions Jul2000- Jan2001 1session /10days Feb2001- Feb2002 1session / week Mar2002- Dec2004 2sessions / week 2005- present 3sessions / week
Table10 OMO schedule
Source: State Bank of Vietnam
Figure 8 Treasury bill’s interest rate and market interest rates
Source: State Bank of Vietnam
15 N. T. Kim, J. Hirata, Current Inflation in Vietnam and Some Suggestions for Monetary Policy
levels, resulting in low OMO interest rates compared with market interest rates (see Figure 9 and Figure 10).
It can be inferred that low OMO interest rates would be beneficial for commercial banks in borrowing money from SBV, but would discourage them from lending money to SBV. In particular, commercial banks are willing to sell Treasury bills to SBV, but will not be willing to buy SBV bills and Treasury bills from SBV. In other words, the money withdrawal of SBV will be more difficult.
It is not clear whether the SBV is fully aware of the importance of the sterilization operation to offset their intervention in the foreign exchange market. However, even if they were, it would be difficult for them to conduct sterilization, given the infant state of the monetary market and lack of monetary tools.
Figure 9 OMO interest rate and Vietnam Interbank Offer Rate (VNIBOR)
Source: State Bank of Vietnam
Figure10 OMO interest rate and market interest rates
Source: Vietnam Economic Times [2001-2007]
To test the effect of ineffective sterilization on inflation in Vietnam, using quarterly data for the period 1995-2006, a simple regression was conducted with the Consumer Price Index (CPI) as the dependent variable. Independent variables include the real exchange rate (REX), the real industrial production (RIP), the monetary base (M0) and the import price index (IMPORT). The import price index is calculated based on the quarterly international price of gasoline, diesel, steel and fertilizer, which are the most important imports of Vietnam. All variables are in log form, so LCPI is the dependent variable, and independent variables are LREX, LRIP, LM0 and LIMPORT.
The result equation was:
LCPI=4.71−0.53×LREX+0.029×LRIP+0.24×LM0−0.04×LIMPORT, R2=0.9.
(−4.65) (1.35) (4.6) (−0.9)
As the equation shows, LM0 has a positive and statistically significant relation with LCPI, while LREX has a negative and statistically significant relation with LCPI. In fact a 1 percent increase in M0 pushes up CPI by 0.24 percent, while a1 percent increase in real exchange rate reduces CPI by 0.53 percent. Since the regression has the problem of endogenous variables, however, we just include it as a reference in this paper.
6. Recommendations
Based on the above analysis, the following recommendations concerning the exchange rate policy and the conduct of OMO are made.
6-1. Exchange rate policy:
Given the difficulties of the sterilization operation, it is recommended that Vietnam be more flexible in its exchange rate management. It means that the fluctuation band of the Interbank average exchange rate should be widened, say from 5 percent to 10 percent, instead of just 0.25 percent. A more flexible exchange rate system will increase the independence of the monetary policy, and therefore, improve the effectiveness of the inflation control.
6-2. Conduct of OMO
To increase the number of securities available for OMO, the government should issue government securities more frequently, increase the Treasury bill’s interest rate, and diversify the term of maturities of those securities. Treasury bills and bonds should be issued not only to finance budget deficits, but also to create the commodities for the
17 N. T. Kim, J. Hirata, Current Inflation in Vietnam and Some Suggestions for Monetary Policy
Interbank market. On the other hand, the issuance of SBV bills should also be conducted more frequently to add commodities to the market.
To improve OMO transaction, it is recommended that SBV relax its control on bidding interest rates in OMO so that the OMO interest rates more closely follow market interest rates. More attractive interest rates will encourage more participants, and hence increase the effectiveness of OMO.
Notes
1)Before the 1985 reform, besides money, coupons were distributed to people and they could only buy certain quantities of different goods stated on the coupons. The 1985 reform then eliminated the coupon system entirely (Le Quoc Ly [2005]).
2)Tax covered from 20% to 28% of the budget’s total revenue. The remaining revenues were fees.
The total amount of money created over total budget deficit was 19.1%, 59.2%, 61.6%, 65.7% and 65.8% in 1984, 1985, 1986, 1987 and 1988, respectively. (Le Quoc Ly [2005]) 3)The budget deficit was covered by foreign loans and government bonds.
4)It should be noted that data on trade balance produced by the General Statistic Office are different from those of the IMF. However, the data from both sources show that the trade deficit stabilized during 2003-2006 period.
5)Total credit balance is the amount of loans made by commercial banks. From 1994 to 1998, the SBV used credit limit to control the amount of loans made by commercial banks. M2 includes money in circulation, demand deposits in commercial banks, time deposits and bonds issued by commercial banks. Deposits included in M2 cover deposits in VND and in foreign currency.
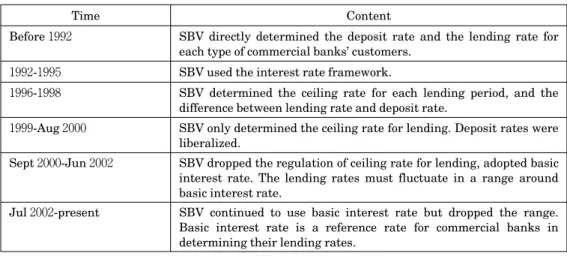
6)See Table A-1 in the Appendix
Appendix
Time Content
Before1992 SBV directly determined the deposit rate and the lending rate for each type of commercial banks’ customers.
1992-1995 SBV used the interest rate framework.
1996-1998 SBV determined the ceiling rate for each lending period, and the difference between lending rate and deposit rate.
1999-Aug2000 SBV only determined the ceiling rate for lending. Deposit rates were liberalized.
Sept2000-Jun2002 SBV dropped the regulation of ceiling rate for lending, adopted basic interest rate. The lending rates must fluctuate in a range around basic interest rate.
Jul2002-present SBV continued to use basic interest rate but dropped the range. Basic interest rate is a reference rate for commercial banks in determining their lending rates.
Table A-1 Interest rate liberalization process in Vietnam. (Deposit and lending interest rate regulation for VND)
Source: Le Thi Tuan Nghia [2004], PHD thesis
References
IMF [1998], Country report No.98/30, April 1998 IMF [2006], Country report No.06/422, November 2006 IMF [2007], Country report No.07/386, December 2007
Le Thi Tuan Nghia [2004], Hoan thien co che dieu hanh ty gia nham nang cao hieu qua
chinh sach tien te o Vietnam (Reforming the exchange rate management to improve the monetary policy’s effectiveness in Vietnam), Ph.D thesis.
Le Quoc Ly [2005], Lam phat : Hanh trinh va giai phap chong lam phat o Vietnam
(Inflation and solutions to curb inflation in Vietnam), Nha Xuat Ban Tai chinh
(Financial Publishing Company).
Le Anh Tu [2007], Monetary policy in Vietnam : Alternatives to inflation targeting, Paper prepared for the Political Economy Research Institute at the University of Massachusetts, Amherst.
M. Ayhan Kose, Eswar Prasad, Kenneth Rogoff, Shang-Jin Wei [2006], Financial globalization:
A reappraisal, IMF working paper.
Nguyen Van Lich [2006], Can can thuong mai trong su nghiep cong nghiep hoa, hien dai
hoa o Viet Nam (The trade balance in the industrialization and modernization process of Vietnam), Nha Xuat Ban Lao dong-Xa hoi (Labor-Social Publishing House).
19 N. T. Kim, J. Hirata, Current Inflation in Vietnam and Some Suggestions for Monetary Policy
Nguyen Van Tien [2001], Danh gia chinh sach ty gia cua Vietnam sau 20 nam doi moi
(Evaluation of the exchange rate policy of Vietnam since Doimoi), Nha Xuat Ban Thong
Ke (General Statistic Office’s Publishing House).
Nguyen Tri Hung [1999], The inflation of Vietnam in transition, CAS discussion paper No22. Ulrich Camen [2006], Monetary policy in Vietnam : the case of a transition country, BIS
paper No31.
Vo Tri Thanh et al [2000], Exchange rate arrangement in Vietnam : Information content
and policy options, East Asian Development Network, Individual research project.
World Bank [2006], Overview of the capital markets in Vietnam and directions for
development.