BUⅡ Fish 工ab
Population genetics and otolith strontium/calcium ratios analysis of marble goby oxyele0ιZ'1谷n2arむ20ratusin southeastAsia for aquaculture application
東南アジアにおけるマーブノレゴビー0xyeleotN谷marmoratuS 養殖のための
集団遺伝およびストロンチウム/カルシウム解析K血M univ., NO.14,25 75 (2014)
Genera11ntroduction
Chapter l Population structure ofmarble gobyin southeastAsia
inferred from mitochondrialDNA
1.1 1ntroduction . . . . 1.2 MaterialsandMethods . . . .
Fin samples . . . .
DNAextraction, amplification, and sequencing Dataanalysis ... . . . . 1.3 Results . . . .
Sequencevariation ... . . .
Population structure and genetic diversity Geographic differentiation . . . . .
Phylogenetic relationship . . . . . 1.4 Discussion . . . .
Geneticdiversityandstl'ucture .. .. . .
Phylogeneticrelationship ... . . . . .
Population divetgence oflandlocked and river marble goby in west and East Malaysia inferred from mitochondrial
DNA
2.1 1ntroduction . . . . 2.2 MaterialsandMethods .. . . .
Finsamples .... . . .
DNAextraction, ampli丘Cation, and sequencing Data analysis . . . . HaHou chew . . . Contents . . . . . . . . . . Chapter 2 . . . . . . . . . . . . . . . . . . . ... . . . ... . . . . 43 27 . . . . . . . . . . .... . . . . . . . 31 . . . . . . . . . . . . . . . . . . . . . ... ... . .
ーーー23555799913333333333334
33345
44444
14% (2014)
2.3 Results
· · · · · · · · · · · · · · · · · · · · · · · · ·
45Population structure and genetic diversity · · · · · · · 45 Geographic differentiation · · · · · · · · · 46 Phylogenetic relationship · · · · · · · · · 49
2.4 Discussion · · · · · · · · · · · · 49 Genetic diversity and structure · · · · · · · · · 49 Phylogenetic relationship · · · · · · · · · · 51
Chapter 3 Otolith strontium/calcium ratios analysis of landlocked · · · · · · 55 and river marble goby in West and East Malaysia
3.1 Introduction · · · · · · · · · · · · · · · · 55 3.2 Materials and Methods · · · · · · · · · · · · · · · 56
Otolith samples 56 Otolith microanalysis · · · · · · · · · Spectral analysis · · · · 3.3 Results · · · · · Sr/Ca ratios Spectral analysis 3.4 Discussion · · · ·
Shift in water salinity · · · · · · · Growth patterns · · · · · · · · · ·
· · · ·
57 57 58 58 59 · · · · · 61 · · · · 61· · · ·
62 Acknowledgements · · · · · · · 64 66 72 References· · · · · · · · · · · · · · · · · · · · · · · · · · ·
summary 26-General Introduction
The marble goby Oxyeleotris marmoratus (Fig.I) belongs to the suborder Gobioidei in the order Perciformes which is comprised of about 268 genera and approximately 2121 species (Nelson 1994). The taxonomic classification of marble goby is summarized as followings, Class: Actinopterygii; Order: Perciformes; Family: Eleotridae; Genus: Oxyeleotris; Species:
marmoratus.
10cm
Fig. I A female marble goby Oxyeleotris marmoratus with 640 g body weight and 26 cm total length.
This species has partial flattened body with snake-like head, symmetrical patterning on the dorsal surface and rounded, outstretched round pectoral fin, two dorsal fins, rounded caudal fin and separated pelvic fins (Lim and Ng 1990). In the wild, it feeds on small fish, shrimp, molluscs and crustaceans. It can grow to a maximum size of approximately 65 cm standard length (Kotte lat 2001 ).
The marble goby is a popular freshwater fish in Southeast Asia (SEA), prized for its fine texture and delicious taste, especially in Malaysia, Singapore, Thailand, and Indonesia (Roberts 1989; Senoo et al. 1993; Cheah et al. 1994; Amomsakun et al. 2002). Market demand has regularly exceeded supply, and it is considered to be one of the most expensive freshwater fish (Senoo et al. 1993). According to Amomsakun et al. (2002) and Luong et al. (2005), the fish can cost 18 to 20
-14% (2014)
USD/kg. In Sabah of East Malaysia, the price of a live marble goby in seafood restaurant is 40 USD/kg.
Although many fish farmers have started to culture the marble goby, the seed supply is still mainly dependent on natural sources (Ikenoue 1991; Senoo et al. 1992, 2008). Natural marble goby stocks have decreased significantly because of overfishing (Senoo et al. 2008). Therefore, development of mass production technology is necessary, not only to increase the yield, but also to conserve the wild marble goby resource.
Studies on artificial seed production for the marble goby have been ongoing since the 1970's (Senoo et al. 1992; Cheah et al. 1994). However, mass production of marble goby has not been widely established because of the high mortality at the early larval to juvenile stages (Tan and Lam 1973; Tavarutmaneegul and Lin 1988; Cheah et al. 1991; Senoo et al. 1994a, 1994b, 2008).
In 2008, seed production has been succeeded in Sabah of East Malaysia. Interestingly, the larval survival is the best in 10 psu diluted seawater. It shows the possible existence of different population in Sabah, because originally the marble goby is a freshwater fish (Kottelat 1985; Roberts 1989). The marble goby is widely distributed in SEA, and it can be found in freshwater rivers, ponds, lakes and brackish water near estuaries. There is insufficient information about the population structure of marble goby in SEA. Thus, a better understanding of its population structure would aid more effective and sustainable fisheries management.
Genetic variation has been widely used in population genetic studies. Measurement of genetic diversity through DNA markers is relevant to the assessment of ecological condition, as it provides an estimation of important population parameters such as characterization of the geographical distribution or connectivity among populations (Sivasundar et al.2001; Barroso et al. 2005).
Mitochondrial DNA (mtDNA) is widely used as DNA markers to assess variability in stock identification studies of fishes. mtDNA is contained in the mitochondria of the cell and is maternally inherited. The mitochondria are organelles, which located outside the nucleus in the cytoplasm of the cell. These organelles are responsible for energy synthesis and transfer for the cells. The major advantage of mtDNA analysis over many other molecular techniques is that its higher level of
-東南アジアにおけるマーブルゴビー養殖のための集団遺伝およびストロンチウム/カルシウム角鞠〒 HaHouchew
resolution provides a reliable method of exarnining relationships among populations. population
diversiw ca11 be assessed statisticaⅡy by examining the variation in mtDNA sequence among
Populations. mtDNA sequence differences could be directly measured through sequence analysis. The
direct sequencing methods provide complete data of the mtDNA molecule. Direct sequencing of
Selected regions of genes without an intennediate cloning step a110ws rapid assessment of numerous
individuals in population genetic studieS σnniS 1988).
Ahhough populations of marble goby can be investigated using genetic study, the ash
Iife history 丘'om larval sta8e until adult in water 訟liniw cannot be clearly understood,
individual
Otolith analysis is conducted to investigate the water saHniり,, where the 丘Sh individual was survived
in the wild (Tsukamoto et al.1998; secor 釦d Rooker 2000; Kotake et al.2003). otolith is
Commenced to form from the larvalstage, and it grows as ash growth.1t composed ofa combination
Ofa gelatinous matrix and calcium carbonate (cac03) in the viscous auid ofthe saccule 釦d uh'icle of
the inner ear. Besides functions as sensors of 8ravity and balance, movement and directional
indicators forthe fish,it also functions in sound detection. The source ofcac03to form the otolith is
mainly 丘om the water surroundings. Asthe otolith gows, elements from the water wi11 bind with the
Otolith. By analyzing the elemental composition inside a fish ot01北h, it wi11 give insight ofthe 、刃ater,
Where the fish have previously suNived since its laNal stage untilthe sampHng date (Tzeng 1996;
Secor 1998; Tsukamoto and Arai 20OD. S廿ontium iS 廿le most studied element due to the same charge
and similar ionic radius to calcium. strontium/calcium (sr/ca) variabiHty in fish otoliths have been
Used to infer Hfe history periods spent in 丘'eshwater, brackishwater and seawater,圦lith the assumption
that low salini切,工入,ater correspond t0 10wer level of sr/ca ratios (Kraus and secor 2004). Electron
Probe micr0釦alyzer(EPN仏) was been used in this study to measure t11e sr/ca ratio in otolith. EPNIA
analysis has been sho、Nn to provide reliable measurements of sr/ca ratio compare to particle lnduced
X・ray Emission (PIXE) and lnductively coupled plasma Mass spectrometry (1CPMS)(campana et al.
1997).
In this study, population structure of the marble goby was investigated using two methods;
Population genetics and otolith analysis.1n the chapter l, samples were c011ected ftom fourteen 10cations in sEA to investigate the population structure using mtDNA analysis. chapter 2, wild
14% (2014)
samples were collected from pond and river in both of West Malaysia and East Malaysia to investigate the population divergence using mtDNA analysis. After the population genetic study, Chapter 3 was conducted to investigate fish individual life history in water salinity during larval stage in pond and river.
The information obtained from this population study of marble goby based on mtDNA markers and otolith analysis would allow us to gain insight into the population structure in SEA, and to better understanding of the fish individual life history in water salinity during larval stage. This population study can enhance the establishment of finfish aquaculture industries in SEA, and benefit the fish farmers to organize an adequate broodstock management and an efficient culture programme, such as different population of marble goby in SEA may need different water salinity for larval rearing in the hatchery.
-Chapter 1
Population structure of marble goby in Southeast Asia inferred from mitochondrial DNA
1.1 Introduction
Molecular genetics has become a powerful tool to determine the levels of differentiation among populations. Examination of mitochondrial DNA (mtDNA) markers is now an established technique for elucidating population genetic structure (Harrison R. G. 1989; Gold et al. 1993; Iguchi 1999; Jones and Quattrao 1999). The genetic diversity present in a species is hierarchically structured. In addition to differences among individuals within any one population, there may be differences among populations within a given geographical region and from different geographical regions, and differences among entire geographical regions.
The goal of this study was to determine the population structure of the marble goby in Southeast Asia (SEA) using partial sequence analysis of the control region of the mtDNA. Study of the marble goby population structure will enhance the broodstock management for aquaculture seed production. Marble goby fins were sampled from three regions: the mainland (Thailand and Vietnam), the peninsula (West Malaysia), and the islands (Sabah and Sarawak in East Malaysia, and Indonesia). Partial mtDNA control regions were amplified, sequenced, and analyzed to determine the population structures among the regions.
1.2 Materials and Methods
Fin samples
In this study, the term of "population" is used to indicate a pool of close sampling locations of marble goby, according to their geographical distribution. Due to the difficulties of collecting samples, the small sample numbers from sampling locations where geographically close were pooled and treated as a single population for the comparison between populations.
-14% (2014)
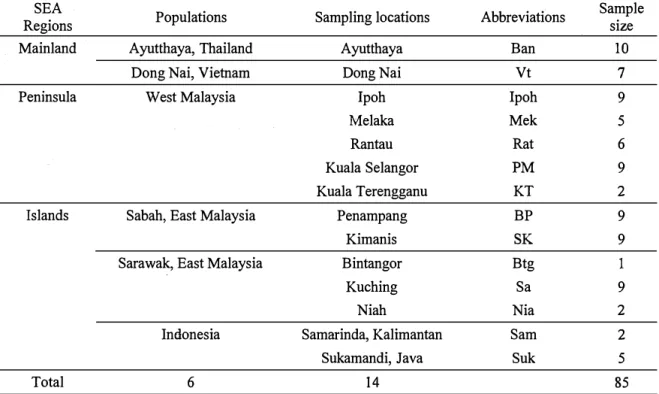
Eighty-five samples were collected from six populations from August 2009 until February 2010, among which two were from the mainland, one was from the peninsula, and three were from the islands (Table 1 ). A small portion of the pectoral fin was cut from each individual and preserved in 90% ethanol for DNA examination.
Table 1. List of sample sizes and sample abbreviations for mtDNA analysis according to the regions,
populations and sam:eling locations
SEA Populations Sampling locations Abbreviations Sample
Regions size
Mainland Ayutthaya, Thailand Ayutthaya Ban 10
Dong Nai, Vietnam Dong Nai Vt 7
Peninsula West Malaysia lpoh Ipoh 9
Melaka Mek 5
Rantau Rat 6
Kuala Selangor PM 9 Kuala Terengganu KT 2
Islands Sabah, East Malaysia Penampang BP 9
Kimanis SK 9
Sarawak, East Malaysia Bintangor Btg 1
Kuching Sa 9
Niah Nia 2
Indonesia Samarinda, Kalimantan Sam 2
Sukamandi, Java Suk 5
Total 6 14 85
In total eighty-five samples were collected from fourteen sampling locations in six populations.
DNA extraction, amplification, and sequencing
Fin samples were digested using proteinase K, followed by standard phenol-chloroform extraction. After 3M sodium acetate (pHS.2) was added, the DNA was precipitated with 70% ethanol. The DNA samples were resuspended in 200 µl of TE buffer (10 mM Tris-HCl, 1 mM EDTA, pH 8.0) and stored in a freezer at -20°C.
A pair of primers (forward primer 5'-CGGAGGTTAAAATCCTCCCT-3', reverse primers 5'-TAGGAACCAAATGCCAGGAATA-3') was designed to amplify the partial mtDNA control region using polymerase chain reaction (PCR). The forward primer is located inside the threonine tRNA gene, and the reverse primer is located inside the control region. PCR was performed using a thermal cycler, GENEAMP PCR SYSTEM9700 (Applied Biosystems, CA, USA) in 20 µl reaction volumes containing approximately 20 ng of DNA, with 0.5 unit Ex Taq (TaKaRa Bio Inc, Otsu,
-HaHouchew:東南アジアにおけるマーブルゴビー養殖のための集団遺伝およびストロンチウム/カルシウム角羣析
Japan),1X EX Taq BU丘er,200 μM each dNTP, and o.5 μM ofprimers. The pcR cycling conditions Were 94゜c for 5 min; 35 Cycles at 94゜c for 30 S,52゜c for 30 S, and 72゜c for 90 S; f0110wed by a flnal extension for lo min at 72゜C.
Ihe pcR products were electrophoresed on a l.596 agarose gelin lx TAE bufferto check the
yield. The amplified DNA was excised 負'om the gel under inadiation 〔}v rays, and extracted using a
Q1ιヘQUICK Gel Extraction Kit (QIAGEN, Hilden, Germany), f0110wing the manufacturer'S
instructions. The same pcR primers 、刃ere also used for sequencing reactions using the DTCS Quick
Start Kit (Bech11an coulter, CA, USA) according to the manufacturer's instructions. The nucleotide
Sequences were determined for both ends of the pcR products using a BECKN仏N COULTER
CEQ800O Genetic Analysis system (Beckman coulter).
Datααπα1γSis
(Tamura et al.2007). The aligned sequences 、刃ere used to analyze the population structure and genetic
Variation using ARLEQUIN version 3.5 (CNIPG, universiw ofBeme; Excoaier et al.2005). Genetic
diversity in each population was measured as haplowpic diversity (Nei1987) and nucleotide diversity
(T@jima 1983). Heter0筍,,gous nucleotjde sites can be estimated sufficiently wi杜l a sample size often
(or even five)(1ajima 1983). T@jima'S D (Tajima 1989) and FU'S FS (FU 1997)tests, as implemented
in ARLEQUIN version 3.5, were used to evaluate the neutraHty of the invest電ated sequences. TO
Perform the test, hom010gous DNA sequences from atleastthree individuals were used for T@iima'S D Nucleotide composition and number of variable sites were assessed using MEGA version 4
test to compute a standardized measure of the total number of segregating sites and the average
number ofmutations between pairs. FU'S Fstest detects an excess ofmutation and itis more powerful
in cases of population expansion. The level of genetic population differentiation was tested using
analysis ofmolecular variance (AMOVA) as implemented in ARLEQUIN version 3.5 (Excof丘er et al
2005), using the genetic distance matrix to estimate the components ofvariance that are at丘'ibutable to
di丘'erences among populations and among individuals within populations. populations were comb加ed
into t11ree regions, as defined by geographical features (Fig.2). significance ofvariance components
14% (2014)
was tested by a nonparametric permutation procedure with 1,000 permutations (Excoffier et al. 1992). The pairwise fixation index (Fsr) was employed to check the genetic differentiation between
populations. The correlation of genes of different individuals in the same population and the genetic differences among populations were also tested by the Fsr- For between population differences, if all
haplotypes were identical, then Fsr equaled O; if they were all different, then Fsr equaled 1. Thus,
pairwise comparisons of Fsr values among populations can be considered as standardized distances
between populations (Excoffier et al. 2005). A neighbor-joining tree of the haplotypes was constructed under the model of the Kimura 2-parameter using MEGA version 4, and evaluated with
1,000 bootstrap replicates.
South China Sea
Sulu Sea
Kalimantan
500km
Java Sea
Fig. 2. Fourteen sampling locations of the marble goby in three regions of Southeast Asia; mainland, peninsula, and islands, which are represented by circles, triangles, and square dots, respectively. Abbreviations of the sampling locations are given in Table 1.
-1.3 Results
Sequence variation
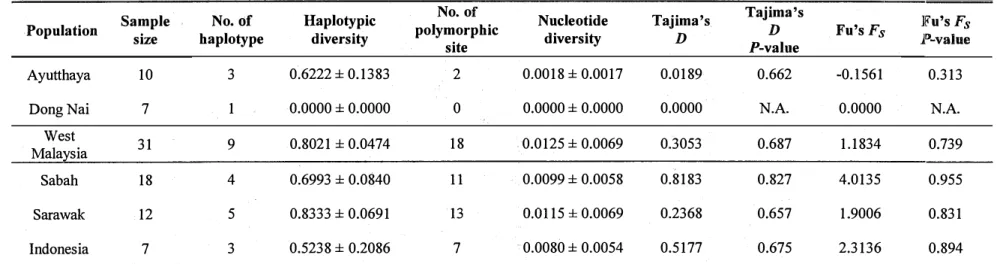
A total of eighty-five 394 hp fragments were sequenced successfully from the six populations (Table 2). Among the examined sequences, the A/T base contents were significantly higher than the C/G base content (mean: A=35.4%, T=27.7%, C=21.3%, G=l5.6%), which is consistent with the
results of Brown et al. (1986), who found that the control region is an A-T rich region of the mtDNA. The sequences from Ayutthaya contained two variable sites, eighteen variable sites were found in West Malaysia, eleven variable sites were found in Sabah, thirteen variable sites were found in Sarawak, and seven variable sites were found in Indonesia. No variable sites were found in the samples from Dong Nai (Table 2).
Population structure and genetic diversity
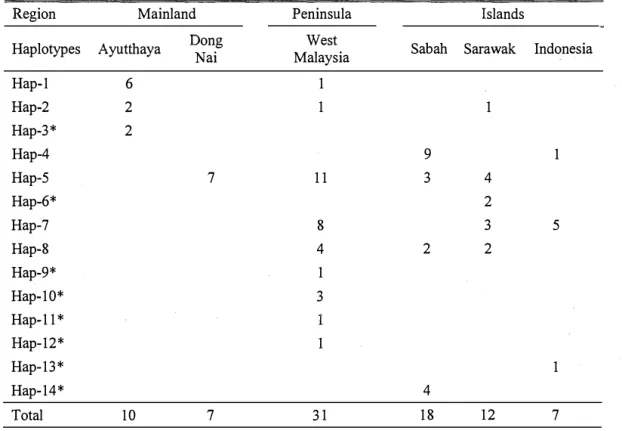
Among all the samples, fourteen haplotypes were detected (GenBank accession numbers JF300363-JF300376); four haplotypes were found in the mainland, nine haplotypes in the peninsula, and eight haplotypes in the islands (Table 3). Six haplotypes were shared between more than one population. Among the shared haplotypes, only Hap-5 was shared in four populations. Hap-5 comprised 29.4% of all samples. It was clear that Hap-5 was the most widespread haplotype among the populations and the most common among the control region sequences. Eight distinct haplotypes were found in one single population only. Ayutthaya, Sarawak, Sabah, and Indonesia each contained a distinct haplotype, while West Malaysia population had four distinct haplotypes.
The genetic diversity of all populations' sequences is shown in Table 2. West Malaysia had the highest nucleotide diversity (0.0125). The highest haplotype diversity, 0.8333, was found in Sarawak. The zero values for haplotype and nucleotide diversity in Dong Nai resulted from no variable sites being detected in the sequences.
Tajima's D and Fu's Fs neutrality tests were performed to determine departures from
neutrality in the sequence data. No significant deviations from neutrality were detected in any of the populations using both of neutrality tests (.P>O.l) (Table 2).
-Table 2. Nucleotide sequence data of six populations based on partial fragments of mtDNA control region, haplotype and nucleotide
diversity (mean± SD), and neutrality tests
Sample No. of Haplotypic No. of Nucleotide Tajima's Tajima's ]l?u's Fs
Population size haplotype diversity polymorphic diversity D D Fu's Fs P-value /::ii
site P-value >t
Ayutthaya 10 3 0.6222 ± 0.1383 2 0.0018 ± 0.0017 0.0189 0.662 -0.1561 0.313
DongNai 7 1 0.0000 ± 0.0000 0 0.0000 ± 0.0000 0.0000 N.A. 0.0000 N.A.
West >-' w Malaysia 31 9 0.8021 ± 0.0474 18 0.0125 ± 0.0069 0.3053 0.687 1.1834 0.739
"'"
0\ <l(u Sabah 18 4 0.6993 ± 0.0840 11 0.0099 ± 0.0058 0.8183 0.827 4.0135 0.955 Sarawak 12 5 0.8333 ± 0.0691 13 O.Ql 15 ± 0.0069 0.2368 0.657 1.9006 0.831 tv 0 >-' Indonesia 7 3 0.5238 ± 0.2086 7 0.0080 ± 0.0054 0.5177 0.675 2.3136 0.894"'"
N.A., not available.
Table 3. Number of fish from six populations of marble goby according to the haplotype
distribution
Region Mainland Peninsula Islands
Haplotypes Ayutthaya Dong Nai Malaysia West Sabah Sarawak Indonesia
Hap-1 6 1 Hap-2 2 1 1 Hap-3* 2 Hap-4 9 1 Hap-5 7 11 3 4 Hap-6* 2 Hap-7 8 3 5 Hap-8 4 2 2 Hap-9* 1 Hap-10* 3 Hap-11 * 1 Hap-12* 1 Hap-13* 1 Hap-14* 4 Total 10 7 31 18 12 7 * Distinct haplotype.
Sample sizes of each population are shown at the bottom of the table.
Geographic differentiation
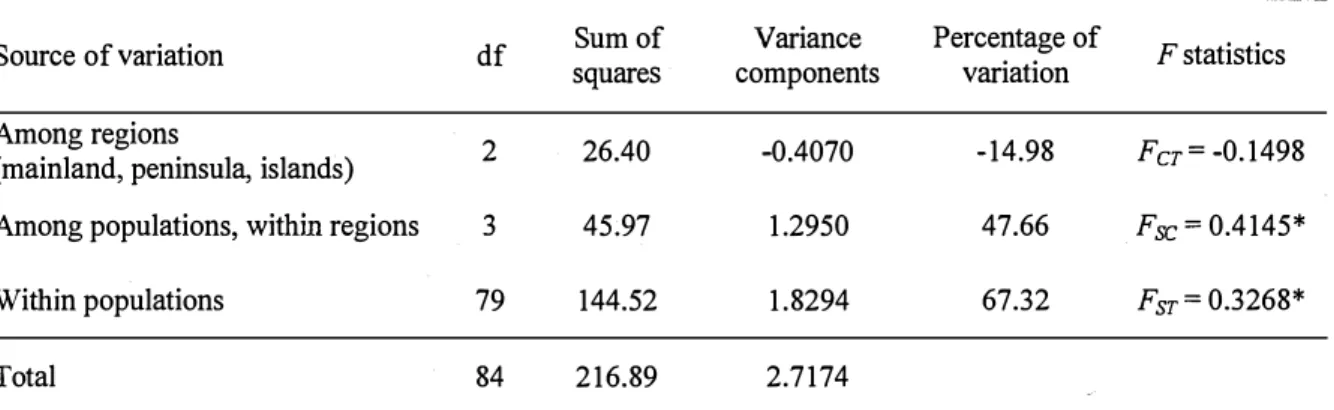
AMOV A produces estimates of variance components reflecting the correlation of haplotypic diversity at different levels of hierarchical divisions. AMOVA assessment of the difference among the regions generated a negative variance component (- 0.4070) indicating that genetic structure was absent at this level (Table 4). F statistics from AMOVA also revealed significant differences among and within populations. 67.32% of the variance was attributable to individual variation (Fst=0.3268, P<0.01), 47.66% was attributable to populations (Fsc=0.4145, P<0.01), and no variance was due to regional site (Fct= - 0.1498).
-14% (2014)
Table 4. AMOV A of mtDNA control region nucleotide sequence data in six marble goby populations from
three regions
Source of variation df squares Sum of components Variance Percentage of variation F statistics
Among regions 2 26.40 -0.4070 -14.98 F
er= -0.1498
(mainland, peninsula, islands)
Among populations, within regions 3 45.97 1.2950 47.66 Fsc = 0.4145*
Within populations 79 144.52 1.8294 67.32 Fsr = 0.3268*
Total 84 216.89 2.7174
* The significant level (P<0.05) of the F statistics, with 1,023 permutations.
AMOV A results showing the most molecular variance were observed among and within populations, but no variance was observed among the regions.
The genetic differentiation among the six populations was significant, except for the pairwise
Fsr values between Sarawak-Indonesia (- 0.0322), Sarawak-West Malaysia (- 0.0204), and Indonesia
West Malaysia (- 0.0227) (Table 5). The negative values of pairwise Fsr showed that the average
number of pairwise difference within a population was more than between populations. Thus, Sarawak, Indonesia and West Malaysia are less genetically different. The significant Fsr values
between populations showed Ayutthaya, Dong Nai and Sabah were genetically differentiated from the other populations (Table 5).
Table 5. Pairwise comparison Fsr value of population differentiation (below diagonal), genetic distance
within population ( diagonal) and between eoeulations ( above diagonal)
Ayutthaya DongNai Malaysia West Sabah Sarawak Indonesia
Ayutthaya 0.0018 0.0207 0.0186 0.0174 0.0179 0.0177 DongNai 0.9470* 0.0000 0.0089 0.0157 0.0082 0.0074 West Malaysia 0.5168* 0.1495* 0.0127 0.0151 0.0120 0.0104 Sabah 0.6071 * 0.5753* 0.2390* 0.0101 0.0139 0.0121 Sarawak 0.6023* 0.2033* -0.0204 0.2178* 0.0117 0.0097 Indonesia 0.7475* 0.4500* -0.0227 0.2352* -0.0322 0.0081
* Significant level ( P<0.05) of Fsrvalue, with the sequential Bonferroni correction (Rice 1989).
The genetic distances in Table 5 show that the highest value between populations was between Ayutthaya and Dong Nai (0.0207), and lowest value was between Indonesia and Dong Nai (0.0074). Within populations, the genetic distances of more than 0.0100 occurred within West Malaysia, Sabah, and Sarawak.
-HaHouchew:東南アジアにおけるマーブルゴビー養殖のための集団遺伝およびストロンチウム/カノレシウム.郡「
1)hylogeπehc relah0πSh々フ
A nei8hbor,oining tree was constructed using the Kimura 2・parameter model. The tree indicated no obvious genealogy among the marble goby (Fig 3). The top010gy of the neighbor・ joining 訂'ee of marble goby haplowpes was sha110W, and there were no si即途Cant genealogical
branches or clusters of salnples conesponding to sampling locations. Typica11y, haplowpes in a
Population 圦,ere scattered 壮lroughoutthe tree, except 血rthe Dong Naipopulation.
ε2
船
50
Hap、7 σPOIV7, PWI, S釦'3, SUW5)
54
Hap、5 (VV7, Meld5, Ravl, PM5, BP/3, sal'2, Niが2)
Hap、13 (sanvD
HaP4 (BP/6, sa11VI, SK/3) Hap、14(SK/4)
田
Fig.3. The evolutionary history ofmarble goby hapl0ぢ,pes was infened using the Neighbor・Joining method a,ooo bootstraps). Numbers at nodes indicate the bootS訂'ap values, and only values >509/0
are shown nextto the brarlches. The tree is drawn to scale, with bra11Ch lengths in the same units as
those of the evolutionary distances used to infer the phylogenetic tree. The evolutionary distances Were computed using the Kimura 2・paralneter method, and the un北S are 仕le number of base Substitutions per site. The abbreviations (refer to Table D arld numbers in the brackets show the
Sampling locationS 即d the number ofsamples, respectively.
Hap"8 σPOIV2, KT/2, sal'2, SK/2) Hap、9 (PWD 52 トーーーーー^ 0'n〔12 HヨP6 (Btgl'1, sa,'D Hap,10 (Ra仇, PW2) Hap.3 (BaW2) Hap・12 (Rat/D Hap、1 (BalV6,RavD 1.4 Discussion
Hap.2 (BalV2, Ravl, sa/D Hap、11 (RaVり
Geπetic diversiりノα11dstlucture
In this study, the genetic diversiり,, as expressed by haplotype and nucleotide diversities, is
higher in the w'est 入lalaysia, sara、Nak, and sabah populations compared to other populations (Table
14% (2014)
2). This might be explained by the smaller sample size in the other populations (Tajima 1983; Nei 1987): the seven samples from Dong Nai (Vietnam) consisted of one haplotype only with no polymorphic sites in the sequences. To further elucidate the genetic diversities of the marble goby, more samples per site should be collected from different populations (Rand et al. 1994).
mtDNA is maternally inherited; samples with distinct haplotypes in Ayutthaya, West Malaysia, Sarawak, Sabah and Indonesia probably represent the indigenous populations in those regions (Table 3). These distinct haplotypes have no introgression stemming from other populations, which could be explained by the natural geographic boundaries and different maternal ancestors (Weiss et al. 2001). These distinct haplotypes can be used as indicators or DNA markers to identify the indigenous populations of those regions. Genetic diversity should be higher in the ancestral population compared to a derived population (Savolainen et al. 2002). West Malaysia has the highest number of haplotypes (nine) and the highest nucleotide diversity (0.0125) among the six populations, indicating that the West Malaysia population probably represents ancestral population in SEA. Hap-5 is the most common haplotype among the fourteen haplotypes, and was present in 29.4% of the samples. Even though Hap-5 can be found in four different populations, it might derive from a single ancestor according to the theory of maternal inheritance of mtDNA.
Tajima's D neutrality test for all the populations indicated that the populations are in genetic equilibrium (Kimura 1983). Fu's Fs test, which is proposed to detect population growth, also did not
show significant values for any of the populations. In fact, smaller sample sizes were used in this
study, and a reduction in the number of significant deviations :from neutrality are expected (Simonsen
et al. 1995; Wayne and Simonsen 1998). Small sample sizes preclude a reasonable argument for neutrality if neutrality tests fail to be significant. On the other hand, when neutrality is significantly
rejected, the small sample sizes may provide cogent evidence of strong evolutionary forces at work (Reinaldo et al. 2002). In future studies, the demography of marble goby population may be revealed by increasing the sample number in each population, and sampling from smaller scale regions.
In this study, we obtained negative variance components in AMOV A at the region hierarchical level. The AMOV A methodology relies on estimates of relationships between haplotypes in the same populations relative to haplotypes of different populations (Weir 1996). Negative variance
-HaHouchew.東南アジアにおけるマーブルゴビー養殖のための集団遺伝およびストロンチウム/カルシウム"¥析
Components C飢 result from very sma11, but positive estimates of genetic structure indices from data
(訊7eir 1996).1his implies that hapl0ぢ,pes are more related among than W北hin regions, and most of
the variabiliw occurs among and within populations(W'eir and cockerham 1984; weir 1996).1)hylogeπeガC re1αti0πShu)
The neighbor,oining tree revealed that haplotypes ofmarble goby were widespread in sEA,
except for the eight distinct hapl0勺1,pes (Fig 2)(1able 3). The complete Hfe cycle ofthe marble goby
in the 圦lild has not been clearly defined. HO、刃ever, according to Akihito et al.(2000), there is aPossibiliりノ that the worldwide distribution of the gobioid fishes occurs by the passive migations of
IaNae via currents. Akihito et al.(1984) repoHed that some freshwater gobioid species could havePositively advanced into continentalinland areas, consequently changing their life style from
amphidromous to a auvia1 切,pe.1t is genera11y assumed that gobioids arose in freshwater,丑'om a
marine a11Cestor, and then retumed to marine habitats once or many times (A11en 1989; AⅡen et al2002). These could be the reasons forthe widespread occurrence ofHap・5 in sEA. However, further
Study on the life cycle of marble goby in the wild is necessary to understand their habitat and
Physi010部,to improve adi6Cialseed production ofmarble goby in hatcheries.Ihere is a probable explanation for the occunence of the same haplowpes in different
Populations. During the last glacial period, the sea level was lower and much of the archipelago of
SEA was tenestrial(sundaland)(Harold 2000; Marwick 2009). During this period, freshwater fish,including marble goby, would have dispersed t11roughout 壮le sundaland via 丘eshwater currents.1n the
H010cene, the sunda shelf, which includes southem Thailand, peninsU1釘 Malaysia, sumatra, Java, and Bomeo, was aooded when thawing occurred, thus fomling the cunent geographical features (Harold 2000; Marwick 2009). Thus, the marble goby had been separated and isolated on thearchゆelago, peninsula, and mainland respectively. This could explain the widespread distribution of
the same haplotypes in these regions. The genetic similarity be加een west Malaysia, sarawak, and
Indonesia also suppodsthis hypothesis(Table 5). Fauna 丘om vietnam and cambodia include species
th飢 are widely distributed across the lndochina and sunda provinces, sug今esting thattaxa from these assemblages would be affected by common paleo・geographical events (Nlarwick 2009)14% (2014)
The results of this study have important implications for the fisheries management of marble goby. This study revealed highly significant differences in the mtDNA control region of Ayutthaya, Dong Nai, and Sabah compared to other populations (by Fsr values and genetic distances). This could
be because these populations are geographically much farther from the other populations, and no gene flow existed among them. The data showed that the populations of West Malaysia, Sarawak, and Indonesia were closely related.
Although this study results showed the different population of marble goby is existed in Sabah of East Malaysia, the relationship between population and water salinity is still unclear. Thus, more detailed and sample collecting from the West Malaysia and the East Malaysia was conducted in Chapter 2 to investigate the population divergence between landlocked and river marble goby.
-Chapter2
Population divergence of landlocked and river marble goby in West and East Malaysia inferred from mitochondrial DNA
2.1 Introduction
Malaysia is separated by the South China Sea into two Peninsular Malaysia and Malaysian Borneo, which are also known as West Malaysia (WM) and East Malaysia (EM), respectively. Even though marble goby in Sabah of EM has been identified as differentiated population based on the results in Chapter 1, the relationship between populations and water salinity where they inhabited is still unclear. If there is marble goby population differentiation between in freshwater and brackishwater sources in the wild, it will benefit the fish farmers to keep fish broodstock, and to use different water salinity for larval rearing in the hatchery according to the marble goby populations.
The term of "landlocked" is used to indicate the marble goby from pond, where entirely isolated and surrounding by land. In this study, fins of wild marble goby were collected from freshwater ponds and along rivers. Marble goby fins were sampled from four places: Ipoh pond and Kundang river in WM; Kuching pond and Kimanis river in EM. Partial mtDNA control regions were amplified, sequenced, and analyzed to determine the population divergence among the pond and river.
2.2 Materials and Methods
Fin samples
In this study, the term of "location" is used to indicate the sampling place of the marble goby. According to their geographical features, locations were combined into two regions, as pond and river. A total of one hundred-twenty samples were collected from four locations in July 2011, with thirty samples from each location (Fig. 4) (Table 6). Samples of Ipoh (WM) and Kuching (EM) were collected from several ponds in each location due to small number of samples in each pond; samples of Kundang (WM) and Kimanis (EM) were collected from a river in each location. A small portion of the pectoral fin was cut from each individual for mtDNA examination.
-1 4-% (2014)
DNA extraction, amplification, and sequencing
Followed the same DNA extraction methods in Chapter 1, fin samples were extracted, precipitated and resuspended in 200 µl of TE buffer (10 mM Tris-HCl, 1 mM EDTA, pH 8.0).
South China Sea
Sulu Sea
Kalimantan
Fig. 4. Four sampling locations of the marble goby from pond and river in Malaysia, which are represented by triangles, and square dots, respectively. Abbreviations of the sampling locations are given in Table 6.
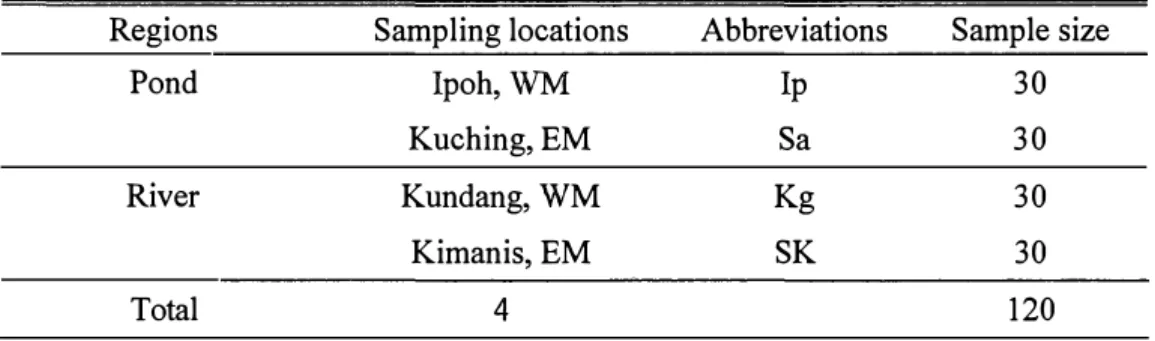
Table 6. List of sample sizes and sample abbreviations for mtDNA analysis according to the sampling locations
Regions Sampling locations Abbreviations Sample size
Pond Ipoh, WM Ip 30
Kuching, EM Sa 30
River Kundang, WM Kg 30
Kimanis,EM SK 30
Total 4 120
A partial mtDNA control region was amplified using the same primers set, which cited in Chapter 1, as well as the reaction volumes and the PCR cycling conditions. The PCR products were electrophoresed on a 1.5% agarose gel in 1 x TAE buffer to check the yield. The amplified DNA was
-excised from the gel under irradiation UV rays, followed by gel extraction. The same PCR primers were also used for sequencing reactions, and the nucleotide sequences were determined for both ends of the PCR products using the BECKMAN COULTER CEQ8000 Genetic Analysis System (Beckman Coulter, CA, USA).
Data analysis
Numbers of variable sites on sequences were assessed using MEGA version 4 (Tamura et al. 2007). The aligned sequences were used to analyze the population structure and genetic variation
using ARLEQUIN version 3.5 (CMPG, University of Berne; Excoffier et al. 2005). Genetic diversity in each population was measured as haplotypic diversity (Nei 1987) and nucleotide diversity (Tajima 1983). Tajima's D (Tajima 1989) and Fu's Fs (Fu 1997) tests, as implemented in ARLEQUIN version
3.5, were used to evaluate the neutrality of the investigated sequences. The level of genetic population differentiation was tested using analysis of molecular variance (AMOV A) as implemented in ARLEQUIN version 3.5 (Excoffier et al. 2005), using the genetic distance matrix to estimate the components of variance that are attributable to differences among locations and among individuals within locations. Sampling locations were combined into two regions, pond and river (Fig. 4). Significance of variance components was tested by a nonparametric permutation procedure with 1,000 permutations (Excoffier et al. 1992). The pairwise fixation index (Fsr) was employed to check the
genetic differentiation between populations. The correlation of genes of different individuals in the same population and the genetic differences among populations were also tested by the Fsr- A
neighbor-joining tree of the haplotypes was constructed under the model of the Kimura 2-parameter using MEGA version 4, and evaluated with 1,000 bootstrap replicates.
2.3 Results
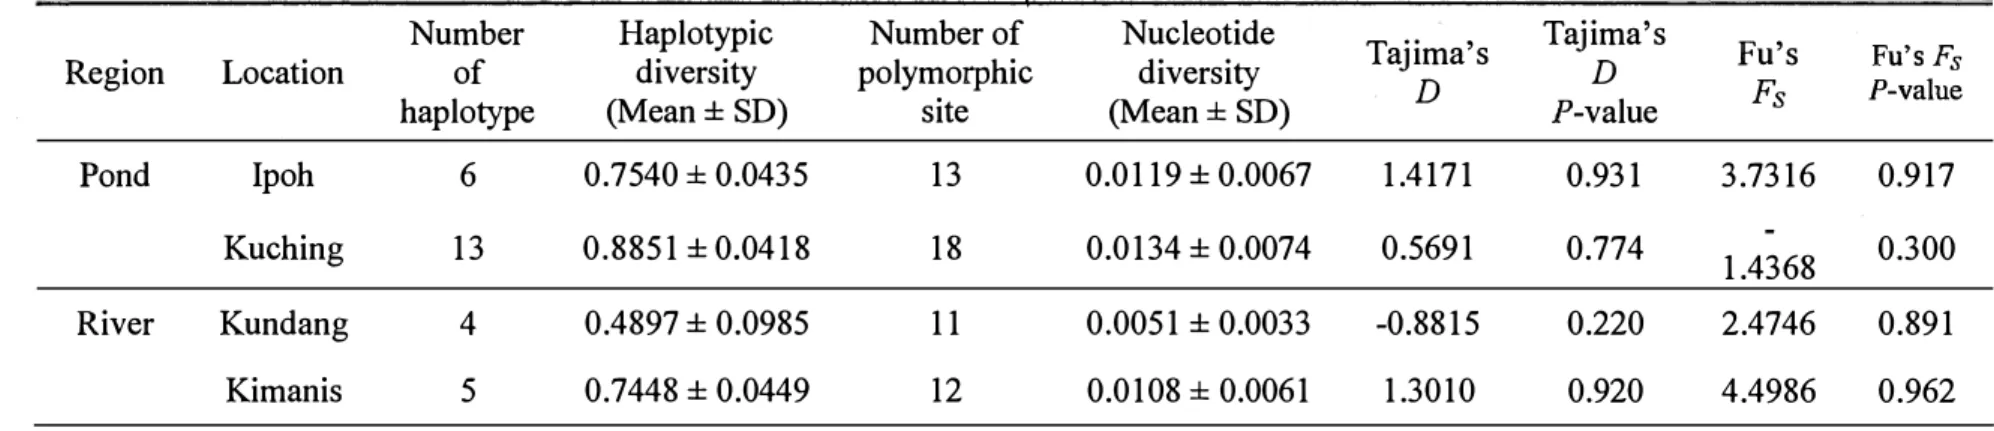
Population structure and genetic diversity
A total of one hundred-twenty 394 bp fragments were sequenced successfully from the four locations (Table 7). The sequences from Kuching pond contained the most number of polymorphic
-14% (2014)
sites among all the locations, which also had the highest haplotypic diversity and nucleotide diversity, 0.8851 and 0.0134 respectively (Table 7). Tajima's D and Fu's Fs neutrality tests were performed to determine departures from neutrality in the sequence data. No significant deviations from neutrality were detected in any of the locations using both of neutrality tests (P>O.l) (Table 7).
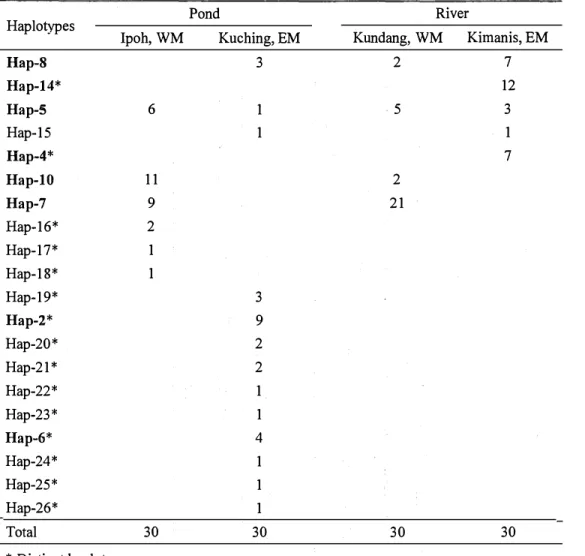
Among all the samples, twenty haplotypes were detected; eighteen haplotypes were found in the pond, and seven haplotypes in the river (Table 8). Among the twenty haplotypes, eight were same with the results in the Chapter 1, which had the bold label in Table 8; the twelve newly detected haplotypes were labelled from Hap-15 to Hap-26. Among the haplotypes, five haplotypes were shared between more than one location. Only Hap-5 was shared in four locations, and it comprised 12.5% of all samples. It is same results in Chapter 1 that Hap-5 is the most widespread haplotype among the locations and the most common among the control region sequences. Fifteen distinct haplotypes were found in one single population only. Kuching pond contained the most number of distinct haplotypes (ten haplotypes) among the four locations, while Ipoh pond had three distinct haplotypes, and Kundang river had none distinct haplotypes. There were two distinct haplotypes detected in Kimanis river, Hap-4 and Hap-14. Interestingly, the Hap-14 was the distinct haplotype, which detected in Sabah marble goby population too in Chapter 1.
Geographic differentiation
AMOV A assessment of the difference among the regions generated a negative variance component (- 0.5108) indicating that genetic structure was absent at this level (Table 9). F statistics from AMOV A also revealed significant differences among and within populations. 68.94% of the variance was attributable to individual variation (Fst=0.3106, P<O.O 1 ), 48.41 % was attributable to populations (Fsc=0.4126, P<0.01), and no variance was due to regional site (Fer=- 0.1735, P>0.05).
Table 7. Nucleotide sequence data of four locations based on partial fragments of mtDNA control region, haplotype and nucleotide
diversity (mean± SD), and neutrality tests
Number Haplotypic Number of Nucleotide Tajima's Tajima's Fu's
Region Location of diversity polymorphic diversity D Fu's Fs
haplotype (Mean± SD) site (Mean± SD) D P-value Fs P-value
I Pond Ipoh 6 0.7540 ± 0.0435 13 0.0119 ± 0.0067 1.4171 0.931 3.7316 0.917
Kuching 13 0.8851 ± 0.0418 18 0.0134 ± 0.0074 0.5691 0.774 1.4368 0.300
River Kundang 4 0.4897 ± 0.0985 11 0.0051 ± 0.0033 -0.8815 0.220 2.4746 0.891
14% (2014)
Table 8. Number offish from four locations according to the twenty haplotype distribution
Pond River
Haplotypes
Ipoh, WM Kuching, EM Kundang, WM Kimanis, EM
Hap-8 3 2 7 Hap-14* 12 Hap-5 6 1 5 3 Hap-15 1 1 Hap-4* 7 Hap-10 11 2 Hap-7 9 21 Hap-16* 2 Hap-17* 1 Hap-18* 1 Hap-19* 3 Hap-2* 9 Hap-20* 2 Hap-21 * 2 Hap-22* 1 Hap-23* 1 Hap-6* 4 Hap-24* 1 Hap-25* 1 Hap-26* 1 Total 30 30 30 30 * Distinct haplotype.
The bold haplotypes are the same haplotypes, which are observed in Chapter 1. Sample sizes of each population are shown at the bottom of the table.
Table 9. AMOV A of mtDNA control region nucleotide sequence data in four locations
Source of variation df Sum of Variance Percentage F statistics squares components of variation
Among regions (pond, river) 1 14.14 -0.5108 -17.35 Fer= -0.1735 Among locations, within regions 2 89;58 1.4254 48.41 Fsc = 0.4126*
Within locations 116 235.43 2.0296 68.94 Fsr = 0.3106*
Total 119 339.15 2.9442
* The significant level (P<0.01) of the F statistics, with 1,023 permutations.
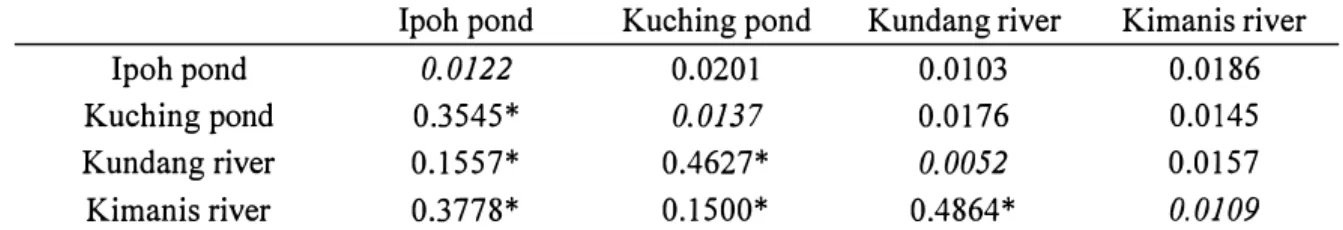
-The genetic differentiation among all the four locations was significant (P<0.05) (Table 10). The significant Fsr values showed that Ipoh pond, Kuching pond, Kundang river and Kimanis river
with each other were genetically differentiated populations.
Table 10. Pairwise comparison Fsr value of population differentiation (below diagonal), genetic
distance within population (diagonal) and between populations (above diagonal)
Ipoh pond Kuching pond Kundang river Kimanis river Ipoh pond 0.0122 0.0201 0.0103 0.0186 Kuching pond Kundang river Kimanis river 0.3545* 0.1557* 0.3778* 0.0137 0.4627* 0.1500* 0.0176 0.0052 0.4864* 0.0145 0.0157 0.0109
* Significant level ( P<0.05) of Fsrvalue, with the sequential Bonferroni correction (Rice 1989). Table 10 shows the highest value of genetic distance between Ipoh pond and Kuching pond (0.0201), and lowest value was between Ipoh pond and Kundang river (0.0103). Within populations, the genetic distances of more than 0.0100 occurred within Ipoh pond, Kuching pond and Kimanis river, but Kundang river had the lowest genetic distance within population, 0.0052 only.
Phylogenetic relationship
A neighbor-joining tree was constructed using the Kimura 2-parameter model. The tree indicated no obvious genealogy among the marble goby (Fig. 5). There were no significant genealogical branches or clusters of samples corresponding to sampling locations. Typically, haplotypes in a population were scattered throughout the tree.
2.4 Discussion
Genetic diversity and structure
Tajima's D neutrality test for all the populations indicated that the populations are in genetic
equilibrium (Kimura 1983). Fu's Fs test, which is proposed to detect population growth, also did not
show significant values for any of the populations. In other words, the populations were at constant size, and the DNA sequences were evolving randomly. The population will reach equilibrium of gene
14% (2014)
frequencies if there were no genetic introgression from exotic populations and demographic expansion or contraction. noos Hap25 (Sa/1) 59 Ha p24 (Sall) Hap15 (Sa/1, SK/1) Hap23 (Sa/1) ,____ Hap21 (Sa/2) Hap20 (Sa/2) 80 Hap7 (Ip/9, Kg/21) 68 Hap 18 (lp/1) Hap2 (Sa/9)
Haps (Ip/6, Sa/1, Kg/5, SK/3)
61 .__ __ Hapl6 (Ip/2) Haps (Sa/3, Kg/2, SK/7) Hap22 (Sa/1) Hap4 (SK/7) 83 �---Hap10 (Ip/11, Kg/2) Hap17 (Ip/1) Hap26 (Sa/1)
Fig. 5. The evolutionary history of marble goby haplotypes was inferred using the Neighbor-Joining method (1,000 bootstraps). Numbers at nodes indicate the bootstrap values, and only values >50% are shown next to the branches. The tree is drawn to scale, with branch lengths in the same units as those of the evolutionary distances used to infer the phylogenetic tree. The evolutionary distances were computed using the Kimura 2-parameter method, and the units are the number of base substitutions per site. The abbreviations (refer to Table 6) and numbers in the brackets show the sampling locations and the number of samples, respectively.
The genetic diversity, as expressed by haplotype and nucleotide diversities, is higher in the ponds compared to the rivers (Table 7). This might be due to the samples of Ipoh and Kuching were collected from several ponds, which consisted of various maternal ancestors. Compared to the Kundang and Kimanis, the samples were collected from a single river at each location. This could be explained by the more haplotypes and higher genetic diversities were observed in the ponds than the rivers (Table 7).
50-mtDNA is maternally inherited; samples with distinct haplotypes in Ipoh pond, Kuching pond, and Kimanis river probably represent the indigenous populations in those locations (Table 8). These distinct haplotypes have no introgression stemming from other populations, which could be explained by the natural geographic boundaries (Fig. 4) and different maternal ancestors (Weiss et al. 2001). These distinct haplotypes can be used as indicators or DNA markers to identify the indigenous populations of those locations. Hap-6 and Hap-14 were the only distinct haplotypes, which detected in this study and in the Chapter 1. This is further proven that the Hap-6 and the Hap-14 can be used as DNA marker to identify the indigenous marble goby population in Sarawak and Sabah respectively.
In this study, negative variance component was obtained in AMOV A at the region hierarchical level. The AMOV A methodology relies on estimates of relationships between haplotypes in the same populations relative to haplotypes of different populations (Weir 1996). Negative variance components can result from very small, but positive estimates of genetic structure indices from data (Weir 1996). This implies that haplotypes are more related among regions than within regions, and most of the variability occurs among and within populations (Weir and Cockerham 1984; Weir 1996). In other words, the variance among regions (pond and river) is less than the variance within region, which consisted of marble goby from WM and EM, consequently resulted the negative variance component at region hierarchical level. It shows the population differentiations are mainly due to the geographical distributions on WM and EM, than the regional features (pond and river). The main variance was observed within population with the significant value, indicates that in the same population, the different fish individuals can be distinguished. The significant value of the variance among populations indicates that the different locations within the same region represent different marble goby populations. It is further proven and supported by the pairwise comparison of Fsr value,
where the Ipoh pond, the Kuching pond, the Kundang river and the Kimanis river are genetically differentiated populations (Table 10).
Phylogenetic relationship
The neighbor-joining tree revealed that haplotypes of marble goby were widespread in WM and EM (Fig. 5) (Table 8). A neighbour-joining tree was constructed in Fig. 6 using the samples from
-14% (2014)
Chapter 1 and this study. The results were still the same, where there was no obvious genealogy among the marble goby with no significant genealogical branches or clusters of samples corresponding to sampling locations (Fig. 6). However, genetic analyses of AMOV A and pairwise comparison Fsr in the both studies succeeded to differentiate the populations significantly (refer to
Results in Chapter 1 ).
Hap-5 is the most common haplotype among the twenty haplotypes, which can be found in all four locations in this study (Table 8). The same result was observed in Chapter 1 (Fig. 3). Akihito et al. (1984, 2000) had reported the possibility of the worldwide distribution of the gobioid fishes due to the passive migrations of larvae via currents, and some freshwater gobioid species could have positively advanced into continental inland areas, consequently changing their life style from amphidromous to a fluvial type. These could be the reasons for the widespread occurrence of Hap-5 in WM and EM. In addition, the common haplotypes, which are widespread in the populations, could be under molecular evolution through genetic drift to form different haplotypes within the populations (Kimura 1968). However, the absolute rate of mtDNA evolution may vary among various species (Bargelloni et al., 1994; Cantatore et al. 1994); and it is still unclear and never been reported for marble goby.
Even though Hap-5 can be found in all four locations, it might derive from a single ancestor according to the theory of maternal inheritance of mtDNA. There is a probable explanation for the occurrence of the same haplotypes in ponds and river. During the last glacial period, the sea level was lower and much of the archipelago of Southeast Asia .was terrestrial (Sundaland) (Harold 2000; Marwick 2009). During this period, freshwater fish, including marble goby, would have dispersed throughout the Sundaland via freshwater currents. In the Holocene, the Sunda Shelf, which includes Peninsular Malaysia, Sumatra, Java, and Borneo, was flooded when thawing occurred, thus forming the current geographical features (Harold 2000; Marwick 2009). Thus, the marble goby had been separated and isolated in pond and river of the WM and EM. This could explain the reasons of the lower significant value of Fsr between Ipoh pond and Kundang river, 0.1557; Kuching pond and
Kimanis river, 0.1500 (Table 10).
-H叩6(SW4)ι五独1^ι1 HヨP21(Sヨノ2) 瓢且P15 (sa心, SIOD 69 53 HヨP24 (S日ノD Π叩14(SN12)ムΣ4包1 HaP19(SW3) 輩叩25 (S狂11) HgP23 (S訊11) HヨP4(SK/フ)ι亟丑丘^ H日P13ι篁g旦Ξgι 82 HaP3^
Fig.6. The evolutionary history of marble goby haplowpes was infened uSⅡlg the Neighbor・Joining method (1,000 bootstraps). Numbers at nodes indicate the bootstrap values, and only values >50% are sh0圦ln nextto the branches.1he
tree is dra工刃n to scale,、vith branch lengths in the same units as those of the evolutionaty distances used to infer the
Phylogenetic tree. The evolutionary distances were computed using the Kimura 2・parameter method, and the units are the
number ofbase substi加tions per site. The abbreviations (referto lable l and Table 6) and nU111bers in the brackets show
the sampling locations and the number ofsamples, respectively. samples from chapter l are 、Nritten inltalic fonts.
H丑P20 (Sヨノ2) 10IVフ r,0I S4,3 S"bs H"P7 (1P/9,1電121) 69 H9P1ι旦g竺^g四1 HヨP12伍g4ι1 H叩2{Sヨの1室旦竺4^ H9P8(S乳13,KE12, SK17) 1011々κ1ン'2 SW2 Sκ2 ⅡヨP944空ι1 0005 Ⅱ叩18 (1P/1) HaP5 σP16, Sヨn,1(容15, Sκノ3) 62 79 H8P22 (Sヨ11) HヨPU伍4堕1 H叩16 σP/2) H叩10σP/U,K冨1ユ)ι室旦4ι^ 輩3P17 (1P11)
V7 πfeb$ ROV1 四305 丑P/3 S'b2 Niψ2
輩叩26 (sa11)
冊恐↓又↓π菴ぶA1ゞや乢﹁︹1淋逢S汁38舳留餅兪計"咲メプロY゛ロト\ーぐ口L竃
工N工0仁9窒
14% (2014)
The results of this study revealed significant differences in the mtDNA control region oflpoh pond, Kuching pond, Kundang river and Kimanis river populations (by Fsr values and genetic
distances) in Malaysia. This could be due to the geographical boundaries between these populations, and no gene flow existed among them. This study succeeded to differentiate the landlocked and the river marble goby populations in both WM and EM using mtDNA analysis.
However, early life of the marble goby in pond and river is not been clearly defined. Furthermore, there is no proof to show that the larval surviving of wild marble goby in brackishwater. Thus, further study on the fish individual life history in pond and river is necessary to understand their habitat in freshwater or brackishwater during larval stage.
-Chapter 3
Otolith strontium/calcium ratios analysis oflandlocked and river marble goby in West and East Malaysia
3.1 Introduction
The results shown in Chapter 2 succeeded to differentiate the landlocked and the river marble goby populations genetically in West Malaysia (WM) and East Malaysia (EM). To better understanding the life history of fish individual in freshwater or brackishwater during larval stage, otoliths were sampled from wild landlocked and river marble goby in West and East Malaysia for strontium/calcium (Sr/Ca) ratios analysis.
Otoliths can be found in the membranous labyrinth of the inner ear of teleost fish, which function in hearing and balance (Lowenstein 1971). They are composed of calcium carbonate, and deposited rhythmically as aragonite crystals within a protein matrix (Degens et al. 1969; Gauldie and Nelson 1988). Strontium has the same ionic charge and an ionic radius similar to calcium. Strontium can substitute for calcium in the process of otolith deposition during fish growth (Amiel et al. 1973). The strontium concentration in seawater is approximately 100 fold higher than in freshwater environments, and otolith Sr/Ca ratios are positively correlated to those concentrations in the ambient water (Campana 1999; Secor and Rooker 2000). Thus, habitat salinity can be inferred by measuring the Sr/Ca ratios along transect from the otolith core to its edge (Tzeng 1996).
Sr/Ca ratios in otoliths have been widely used for studying habitat use and migratory behavior of fish between freshwater and seawater (Tzeng et al. 1997, 2002, 2003, Secor and Rooker 2000, Jessop et al. 2002). By analyzing the growth patterns and the elemental composition of otoliths, it may reflect fish individual chronologies of habitat salinity (Radtke and Shafer 1992; Campana, 1999; Milton and Chenery, 2001; Campana and Thorrold 2001). These applications are widely used on studies about migrations between freshwater and seawater in eels (Anguilla japonica, Tsukamoto and Arai 2001), shad (Alosa sapidissima, Limburg 1995), sea trout (Salmo trutta, Limburg et al., 2001), and striped bass (Marone saxatilis, Secor et al. 2001).
-14% (2014)
3.2 Materials and Methods
Otolith samples
In July 2011, a total of forty fish otoliths were collected from the same four locations in Chapter 2, with ten fish from each location (Fig. 4). The samples were labeled and abbreviated as shown in Table 11. The otolith samples were cleaned, dried and then embedded in epoxy resin. The embedded otoliths were ground transversely on 300, 600, 1000, and 2000 grain sandpapers by hand; followed by polishing on 4000 and 15000 grain ultra-fine films until core of the otolith was exposed (Fig. 7).
Table 11. List of sample sizes and sample abbreviations for otolith Sr/Ca ratios analysis according to the sampling locations
Pond River Total Sampling locations Ipoh, WM Kuching, EM Kundang, WM Kimanis, EM 4 Transverse grinding (a} Top view
Abbreviations Sample size
p 10 Sa 10 Se 10 Kim 10 40
l
Fig. 7. Transverse grinding of a marble goby otolith. (a) Top view of the otolith after ground, and coated with 30 nm film thickness of carbon.
-Otolith microanalysis
Analyses were conducted at the Kinki University of Joint Research Center with a wavelength dispersive X-ray electron probe microanalyzer (EPMA), JEOL JXA-8530F (JEOL, Tokyo, Japan). Prior to analysis, otoliths were ultrasonically cleaned and carbon coated under a high vacuum evaporator. Strontium and calcium concentrations were measured at 5 µm intervals from the core to the edge of each otolith. Quantitative analyses were conducted using beam operating conditions of 15kV for the acceleration voltage, 10 nA for the current, and a 5 µm round scanning beam under vacuum condition. Calcium silicate (CaSi03) and strontium titanate (SrTi03) were used as standard
for calibrating the calcium and strontium contents of the otoliths. Graphs of Sr/Ca ratio over the distance from core were plotted for each fish individual. Mean and standard deviation of each graph were compared and discussed.
Spectral analysis
After the Sr/Ca ratios analysis, the otolith growth patterns from different the sampling locations were investigated using spectral analysis of Fast Fourier Transform (FFT) as implemented in IGOR Pro version 6.23 (Wavemetrics, Lake Oswego, OR). FFT produced the average frequency contents of the Sr/Ca ratios over the entire transect from the otolith core to its edge (example shown in Fig. 8). The FFT results were represented in the form of a magnitude plot for each sample (Fig. 8b ). Two highest magnitude signals represent high Sr/Ca ratios detection at an interval along transect from core to edge of otolith (Fig. 8b). The intervals were group into ranges in table, and then the otolith growth patterns among the sampling locations were compared and discussed.
-(a) 40 · 1 - 35 'l' � 30 -;; 250 ':ij 20 ni 15 u � 10 II) 5 14% (b) 160 140 120 ! _g: 100
.E
so faO 60 ::J: 40 20 0 (2014) 0 ··---·-,--·-�--- .---0 200 400 600 800Distance from core (µm) 1000
0 0.1 0.2 0.3
Frequency ((1/x]*Sµm)
0.4 0.5
Fig. 8. Spectral analysis of FFT. (a) Raw data otolith Sr/Ca ratios of Kimanis river sample, KimlO; (b) Magnitude-frequency plot of KimlO after the analysis, and two highest magnitudes are shown in dashed circle.
3.3 Results
Sr/Ca ratios
Mean and standard deviation (mean± SD) of Sr/Ca ratios for each sample were shown in Fig. 9 according to the sampling locations. All Ipoh pond and Kundang river samples showed similar mean ± SD within the sampling locations; but the individuals SalO in Kuching pond, Kim8 and Kim 10 in Kimanis river were exceptional.
25 lpoh pond, WM 25 Kuching pond, EM
20 20
-
15 15t
10 10f
0f
f
'l"'ff
f
f
l
f
t
f
f
f
t
f
f
f
f
f
><
5 5f
-
l II) 0 ' ·-... ,--·--·,···--··""':'' ... , ... T ... T ... -... , ... l ... , 0',i:i Pl P2 P3 P4 PS PG P7 P8 pg PlO Sal Sa2 Sa3 Sa4 Sas Sa6 Sa7 Sa8 Sa9 Salo
�
ns
Kundang river, WM Kimanis river, EMu
25 25 20 20t
V>f
15 15 10f
!
10f
f
t
f
f
f f
f
f
!
f
f f
f
f
5 5f
0 -·--, -.-,--,----r----,·----r----r----r----: 0Sel Se2 Se3 Se4 Se5 Se6 Se7 Se8 Se9 SelO Kiml KimZ Klm3 Klm4 KimS Kim6 Kim7 KimB Kim9 KimlO
Samples
Fig. 9. Mean and standard deviation of Sr/Ca ratios for all otolith samples according to four sampling locations.
The Sr/Ca ratios of Sal 0, Kim8 and Kim IO were shown in Fig. 10 for comparisons. Sample Sal 0, which was collected from freshwater pond in Kuching, showed constant fluctuations from the core to edge, with below value of 28 (Fig. 10).
Compared to Kim8 and KimlO, the results showed the clear evidence of decreasing Sr/Ca ratios from the core to edge (Fig. 10). It indicated the both fish individuals had shift of water salinity from the water containing seawater enter into freshwater in the river. They might have been hatched out and survived in brackishwater during larval stage and entering freshwater while growing up.
Compared to the other marble goby individuals in four locations, these two marble goby, Kim8 and Kim IO in Kimanis river indicated two types of habitat salinity (Fig. I lb); brackishwater and then shift into freshwater. Other marble goby indicated one type of habitat salinity, in freshwater.
40 , Kuching pond, EM (SalO)
0 200 400 600 800 1000
40 _! Kimanis river, EM (KimlO)
35 .: 20 15 10 0 ---�-�--���--0 200 400 600 800 1000
Distance from core (µm)
40 , Kimanis river, EM (Kim8) ;
o�--�--�---.
···.--·-·-o 200 400 600 800 1000
Fig. 10. Otolith Sr/Ca ratios from core to edge for three samples; Sal 0, Kimi O and Kim8. Spectral analysis
Otolith Sr/Ca ratios detection at variant intervals along transect from core to edge for all samples. The total fluctuation intervals in otoliths of Kuching pond is only 19 compared to other locations, because of a single magnitude signal was detected in Sa2. The ranges of intervals were shown in Table 12 for comparison.
Ipoh pond and Kundang river in WM showed the same results of fluctuation intervals ranges in otoliths (Table 12), which means the marble goby in these two locations had same growth patterns. Among the four locations, a unique growth pattern was observed in Kimanis river marble goby because the otoliths of Kimanis river showed highest fluctuation intervals in range of 21-40 µm
-1 4% (2014)
and >101 µm, but none in range of 61-100 µm (Table 12). However, Kuching pond showed erratically growth pattern based on the results of fluctuation intervals, which means the Kuching pond marble goby grew randomly, and caused the erratically fluctuation intervals on otoliths. Therefore, Kimanis river and Kuching pond marble goby had their own growth patterns respectively compared to another two locations in WM, which had the same pattern.
lpoh pond, WM 40 .., 30 � - 20 � ( a) n=lO m ; ' 0 10 � � �!M4"��""""..._,..,..,.il,,/'f,�h""-'\-,N�II\W� Kuching pond, EM 40, 30 j 20 J 10
..::S., 0 ·-f-· ... , ... -.. , ... , ... r ... -... , ... _.
o ... ; ... ,--···-.. , .... -... , ... , ... , .... ---··
II) 0 ·-m I..m
u
0 200 400 600 800 1000 Kundang river, WM 40 i 30 ..!l
20 'i lO j ( a), n=lO ��� 0! --- '
,.·.,
-0 200 400 600 800 1000 0 200 400 600 800 1000 Kimanis river, EM 40 .., ! (b) ,n=Z 20 100
0 200 400 600 800 1000Distance from core (µm)
Fig. 11. Mean of otolith Sr/Ca ratios from core to edge in four locations show all marble goby individuals' survived in freshwater (a), but Kimanis river has marble goby, which early life in brackishwater then shift into freshwater (b). The number of samples, n.
Table 12. Fluctuation intervals in otolith of marble goby from four locations
Locations Fluctuation Intervals (.um)
21-40 41-60 61-100 > 101
Ipoh pond (WM) 9 4 4 3
Kundang river (WM) 9 4 4 3
Kuching pond (EM) 6 4 7 2
Kimanis river (EM) 11 2 0 7
-3.4 Discussion
Shift in water salinity
This study is the first report of marble goby otolith Sr/Ca ratios analysis to investigate the fish individual's habitat salinity in WM and EM. Although SalO showed exceptional otolith Sr/Ca ratios in Kuching pond, the Sr/Ca ratios showed its life history in constant salinity habitat, where might be no changes in water salinity and no shift in water salinity during growth. As mentioned in Chapter 2, the samples from Kuching and Ipoh were collected from several freshwater ponds in both locations due to the small number of samples in each pond. Thus, there is a possibility that this SalO is from different pond with other samples in Kuching pond. Besides of salinity, the growth patterns might influence the Sr/Ca ratios as well. The random growth of marble goby in Kuching pond, which revealed by the results of spectral analysis, could explain the erratically otolith Sr/Ca ratios in Sal 0.
Marble goby is regarded as a freshwater fish; however, this study reveals two marble goby individuals in Kimanis river of EM, Kim8 and KimlO were probably survived in brackishwater at early life, and then shift into freshwater. This inference is based on the results of Senoo et al. (2008) that the marble goby larvae in Sabah (EM) cannot survive in high salinity water, but the best survival in the optimum salinity, 10 psu. In addition, there is no scientific report of the salinity level corresponding to the otolith Sr/Ca ratios for marble goby. Thus, the exact salinity level in the wild cannot be identified in this study.
The other marble goby of Kimanis river lived their whole lives in freshwater only. It shows a possibility that two types of marble goby are existed, first type is surviving in freshwater only; second type is surviving in brackishwater at early life and then shift into freshwater. This could be one of the reasons to explain the marble goby larval survival in Sabah of EM was the best in 10 psu water, which has been reported by Senoo et al. (2008). Probably the broodstock, which was used for seed production, was the second type. Therefore, it is advised that the seed production of marble goby in
Sabah should be carried out carefully if the broodstock are collected from the wild.
Although succeeded to discover some marble goby shift in water salinity in the Kimanis river, the exact and absolute time of shifting is still unknown. Fish otoliths accrete layers of calcium
-14% (2014)
carbonate and gelatinous matrix throughout their lives (Degens et al. 1969; Gauldie and Nelson 1988). The accretion rate varies with growth of the fish, usually less growth in winter and more in summer in temperate zone, which results in the appearance of opaque and translucent rings respectively. Thus, it is possible to determine the age of the fish in years by counting the rings (Campana and Thorrold 2001 ). However, for the tropical fish such as marble goby, there are no obvious opaque and transparent rings in otolith as fishes in temperate zone. In future, more rigorous studies are recommended to estimate the age of marble goby based on the otolith rings counting, and to investigate the larval otolith on which daily rings can be detected. It will reveal the exact age of the marble goby during the shift of water salinity in the wild. Consequently contribute to the timing of salinity change, if the 10 psu water is used initially for the marble goby larval rearing in the hatchery.
Besides, mtDNA results in Chapter 2 revealed both Kim8 and KimlO in Kimanis river, which showed shift in salinity from brackishwater enter into freshwater, had the same distinct haplotype of Hap-14, and this distinct haplotype can be found in Sabah indigenous population only. However in this study, Hap-14 was detected as well in Kim2 and Kim5, which showed life history in freshwater habitat only. According to the theory of maternal inheritance of mtDNA, Kim2, Kim5, Kim8 and KimlO were from the same maternal ancestor. Thus, the maternal ancestor with Hap-14 might have the genetic factor of possibility to survive in both freshwater and brackishwater at early life in the wild (Taylor 1990). However, Senoo et al. (2008) reported that all Sabah marble goby larvae only survived in 10 psu water. This can be explained by the paternal genetic contribution mating with the female. The way to determine the genotype, which affects to the salinity tolerance, is unknown, however, the mating might has a possibility to produce three types of offspring, which could survive in freshwater only, survive in brackishwater only, and able to survive in both. This inference could explain the survival in different salinity even the fish have the same haplotype.
Growth patterns
As mentioned before, the accretion rate of otolith varies with fish growth, and then results different fluctuation rate in otolith. These relative widths and intervals results the pattern of periodical growth marks, which differ between species and populations and so does the ease of their