Current Status of Arsenic Contamination and its
Countermeasures in the Terai Lowland, Nepal
Research findings report
July 2016
Representative of the research team Keizo Nakamura
(Keiai University Professor)
Current Status of Arsenic Contamination and
its Countermeasures in the Terai Lowland, Nepal
Research findings report
Representative Publisher : Keizo NAKAMURA
Address: 370-32, Dainichi, Yotsukaido-shi, Chiba-ken, 284-0001, Japan E-mail: nepalkenkyu@gmail.com
All rights reserved. No part of this publication may not be reproduced or distributed in any form or by any means, without the prior written permission of the publisher.
Editors
Hiroshi, MATSUO Faculty of International Studies, Keiai University Kenzo, OOKA Japan Environmental Management Association for Industry and a part time lecturer at Hosei University Keizo, NAKAMURA Faculty of International Studies, Keiai University
Contributors
Bhanu B., KANDEL Birendra Multiple College (Tribhuvan University) Takeshi, KOMAI Graduate School of Environmental Studies Tohoku University
Futoshi, MATSUMOTO Faculty of International Studies, Keiai University Hiroshi, MATSUO Faculty of International Studies, Keiai University Keizo, NAKAMURA Faculty of International Studies, Keiai University
Kenzo, OOKA Japan Environmental Management Association for Industry and a part time lecturer at Hosei University
1. A tube-well of Khokharpuruwa recorded the highest value of the arsenic concentration, 1,048ppb (Photo: September 2009)
2. People with drinking water of their home said that "Please test the water quality."
(Photo: September 2007)
3. Residents gathered at the investigation site (Photo: September 2009)
4. Hands of arsenic victims (Arseniosis) (Photo: March 2012)
5. Digging wells by manual (Photo: March 2012)
6. Bowling core samples (Photo: August 2012)
7. Weather observation station (Photo: March 2012)
8. Interview by questionnaires (Photo: March 2014)
9. Survey presentation at Khokharpurwa (Photo: September 2009)
10. The first meeting with local people at Manari (Photo: August 2012)
11. The 2nd meeting with local people at Manari (Photo: March 2014)
12. High school teachers at Khokharpuruwa
Contents
1. Introduction ……… Keizo NAKAMURA 1
2. Meteorological and Climatological Studies
……… Futoshi MATSUMOTO and Keizo NAKAMURA 4
3. Hydrogeological studies of arsenic contamination ……… … Takeshi KOMAI 10
4. The Geomorphology and Geological Settings
……… Kenzo OOKA, Takeshi KOMAI and Noboru NARISAWA 15
5. Field Study on the Inhabitants and their Life
……….. Hiroshi MATSUO and Bhanu B. KANDEL 21
6. Countermeasures of Arsenic Contamination
……….Takeshi KOMAI ,Hiroshi MATSUO and Kenzo OOKA 28
7. Summary ……… Keizo NAKAMURA 32
1
1. Introduction
1.1 Previous Studies
The elongated Terai lowland extends from east to west in the southern part of Nepal along the Nepal-India boundary. Approximately 11,000,000 people live in the Terai, which is equivalent to 47 % of Nepal’s total population. In 1999, arsenic contamination of the groundwater in the Terai was first reported in Nepal and more comprehensive investigation and arsenic research have been conducted since then.
Nearly 90% of the Terai population depends on groundwater for its drinking water supply (Roshan, R.S. 2003). Nepal standard for drinking water is 50 ppb however the WHO guideline value is 10 ppb. According to the national survey which analyzed 737,009 groundwater samples, 7.9% of the samples showed 10 ~ 50 ppb of arsenic concentration, and 2.3% more than 50ppb, with some instances of more than several hundred ppb (Ishwar, C.Y. et al., 2012, Thakur, J.K. et al., 2011).
The health problems caused by arsenic contamination are very serious. Among the inhabitants drinking arsenic contaminated water everyday exceeding 50 ppb, chronic arsenic poisoning was confirmed by clinical observations of patients (Pokhrel,D. et al., 2009). Arsenic intake causes melanin pigmentation and cornification in the skin, and accumulation of arsenic into hair and nails is also reported. Arsenic poisoning has some connection with diet and nutritional status. Poor people have higher arsenic exposure. Males are more susceptible to chronic arsenic poisoning than females (Ahmad, SA. et al., 2004, Maharjan M. et al., 2005, 2006a,b, 2007 ).
Many kinds of filters have been developed in order to get rid of arsenic in Nepal. Among other things, Kanchan Arsenic Filter (KAF) has got a good evaluation, which can remove 85~95% of arsenic, 90~95% of iron, 80~95% of other pollutants and 85~99% of E.coli (Ngai, T.K.K. et al., 2006, 2007, Pokhrel, D. et al., 2009).
Water containing arsenic is being supplied for cultivated lands as irrigation water. According to the past survey, 5~1.014 ppb in the water, and 6.1~16.7 mg/kg of arsenic in the soil was detected (Dahal,B.M. et al., 2008a,b).
Since September 2007 we have been conducting the investigation in the study area that measures about 10 km long from north to south and 6 km wide from east to west, which located in the east of Parasi, Nawarparasi district in the Terai (Nakamura K. et al., 2007, 2008a,b, 2010). Our previous survey revealed that the localization and spatial variation such as extremely high concentration of arsenic at some sites, where its concentration increases in the dry season. During dry season it occasionally increased three times higher than rainy season.
It was also confirmed that stratums between 13m to 23 m deep are highly reduced conditions (negative redox potential) in most cases, and that the stronger the reduction is, the higher the arsenic density is. This may be caused by complicated parameters including the mechanism of aquifers and confining layers, and geological features such as clay, silt, sand and gravels. Such detailed analysis basically requires investigation of geological condition of the aquifers (Tamrakar et al., 2002, 2007).
The indirect impacts such as tectonic uplift, fold-and-thrusts mountain development by orogeny made this issue very complicated. Especially, underground traces of meandering rivers make the
2
mechanism of aquifers all the more complex. Moreover, concerning the elution of arsenic into groundwater and its mobilization in the aquifers, there will be widely spread arsenic pollution sources, arsenic containing rocks, clastic, marine sediments, influences of rivers and weathering, chemicals in groundwater (Fe-oxides, Fe-hydroxides, other metal compounds, and sulfide, among others), pH and oxidation-reduction potential (Mirecki, 2005).
1.2 Purpose of Research
In this research, considering the study results of the previous research, while trying to grasp the movement of groundwater and its actual groundwater utilization in the arsenic contaminated area, we conducted sampling, monitoring, drilling and other field survey in order to clarify the mechanism of the elevated arsenic concentration. And the specific purposes and contents are as follows.
1.2.1 Climatological observations and the actual situation of arsenic contamination (1) Observations on meteorological and climatological conditions
In the subtropical monsoon climate areas where few observation data exist, we comprehensively observe fundamental meteorological elements such as relative humidity, wind direction and solar radiation, to say nothing of temperature and rainfall.
(2) Surveys on groundwater dynamics, water quality and geological structure
While grasping the actual situation of arsenic contamination in the study area horizontally and vertically, with the help of drilling survey, groundwater quality and water level observation, we try to investigate the causes of the contamination hydrologically and geologically.
(3) Surveys of the local residents who utilize the arsenic-contaminated groundwater
Regarding the people of the study area who drink the arsenic-contaminated groundwater, we interview them and analyze their attitudes to the groundwater and arsenic issues, making clear their attitude towards the domestic water and the actual use of wells.
1.2.2 Measures against the arsenic contamination
We consider and suggest appropriate measures to get the arsenic-free, safest drinking water
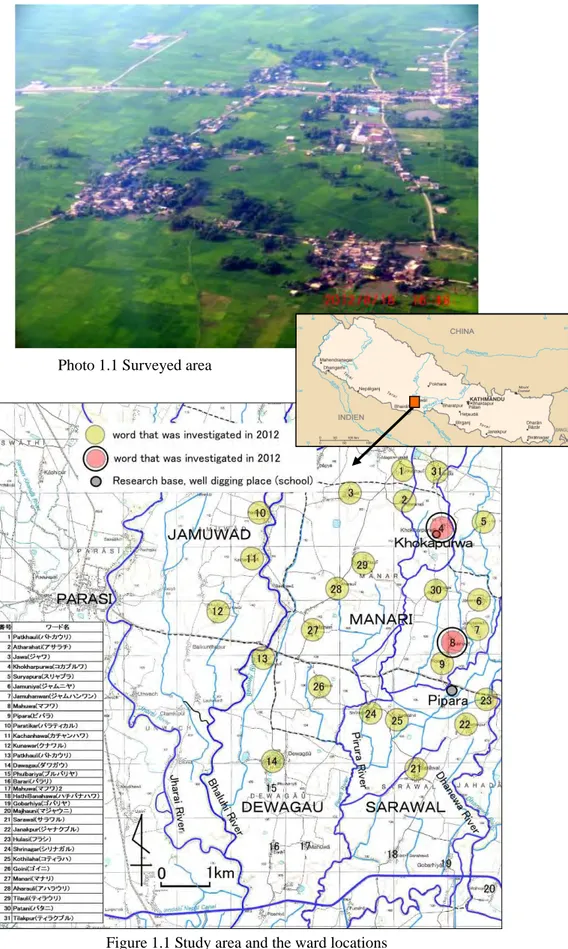
1.3 Surveyed area
The surveyed area is situated about 7 km east of Parasi, Nawalparasi district in the central part of the Terai lowland, Nepal. The study area is mainly covered with rice paddies (Photo 1.1), and about 10 km on the north side the Siwalik Hills lies, which have altitudes of 150m to 1500m. The surveyed area ranges about 10km from north to south and 6km from east to west, including 30 villages (an equivalent of “wards” or communities). We surveyed water quality and their way of life of all wards. Comprehensive observation of the weather and meteorological condition was conducted at the schoolyard of Balpuri Primary School (N27°31′03″, E83°44′06″)in Pipara, Nawalparasi district.
3 Photo 1.1 Surveyed area
4
2. Meteorological and Climatological Studies
2.1 Climatic Environment of the Terai lowlands
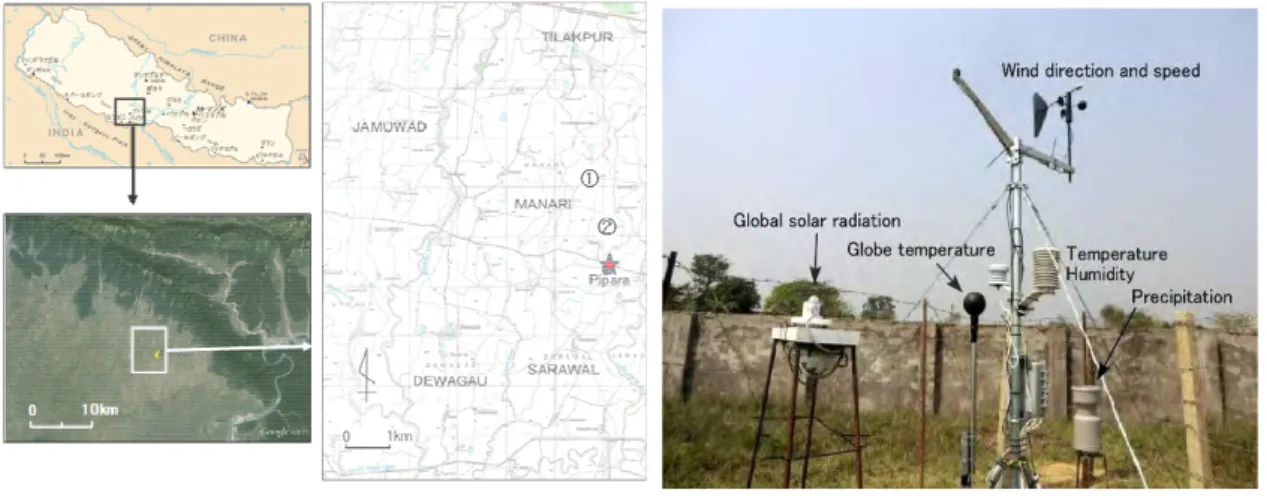
In conducting our survey in the Terai lowlands in the southern part of Nepal, it is very important to make clear weather conditions and water balance in the study area. For this reason, we established weather observatory in the area, and conducted comprehensive weather observation from March 2012 to August 2014. The observation area is located about 7km east of Parasi, Nawalparasi District in the central part of the Terai lowland, and the observation point was set at the schoolyard of Balpuri Primary School (Figure 2.1, L/L N27°31′03″,E83°44′06″). The observation equipment was installed in the northwestern part of the schoolyard, and we observed atmospheric pressure, global solar radiation, wind direction, wind speed, air temperature, relative humidity and precipitation every 15 minutes (Photo 2.1).
Figure 2.1 Location of the study area Photo 2.1 Weather station installed at ① Patani ② Mahuwa Balpuri primary school
Annual changes of daily maximum temperature, daily mean temperature and daily minimum temperature, from March 2012 to February 2013 are shown in Figure 2.2. The air temperature kept rising after March 2012, and daily maximum temperature during the latter half of April exceeded 40℃ almost every day.
Figure 2.2 Variations of daily minimum, mean, maximum air temperature observed at Balpuri primary school during the period from Mar.1, 2013 to Feb.28, 2014
5
But the daily maximum temperature suddenly fell in the middle of June, and made transition within the vicinity of daily maximum temperature of 35℃, daily mean temperature of 30℃ and daily minimum temperature of 25℃ until the end of September. In October and afterwards, the temperature kept falling and reached the lowest temperature in January, and then rose gradually.
Based on the annual changes of each meteorological element, we classified the seasons of the study area in 2012 as follows.
z Pre-monsoon season until June 16
z Monsoon season from June 17 until September 18 z Post-monsoon season from September 19 until December 15 z Winter season from December 16
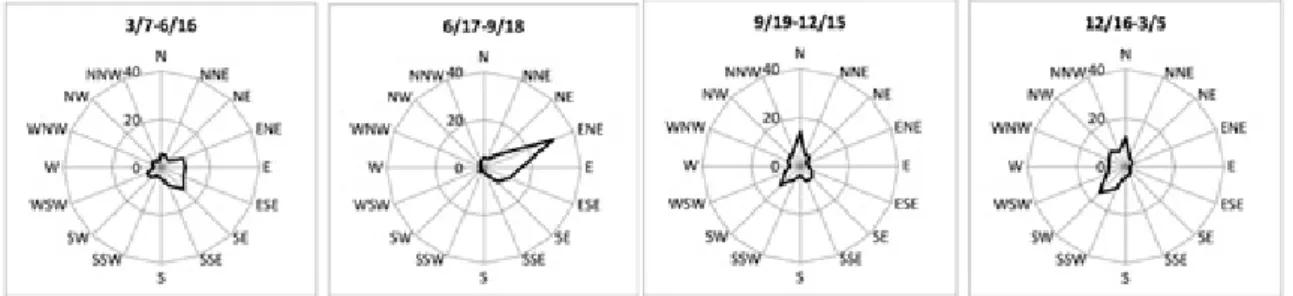
Based on this seasonal classification, we calculated wind direction frequencies in each season of 2012 (Figure 2.3). In Pre-monsoon season, ENE to SSE wind flow prevailed, and the most frequent wind direction was SE. In the Monsoon season, ENE wind flow prevailed, occupying more than 30% of all the wind directions. N and SW showed the bimodality on the wind direction in Post-monsoon and winter seasons.
Figure 2.3 Frequency of wind direction in each season observed at Balpuri primary school during the period from Mar.7, 2013 to Mar.5, 2014(Vertical axis : Frequency(%),From left : Pre monsoon, Monsoon, Post monsoon and Winter)
Also, in Pre-monsoon and Post-monsoon seasons, mountain and valley wind appeared to be blowing. That is, it was confirmed that the northerly wind was descending the mountain slope during the night under clear weather condition, and the southern wind was climbing the slope during the day, so to speak, the valley wind prevailed respectively. The high frequency of ENE wind during the Monsoon season is due to the influence of seasonal macro-scale airflow, but somewhat higher frequency of easterly wind during the day is probably due to the influence of valley wind developing on a fine day.
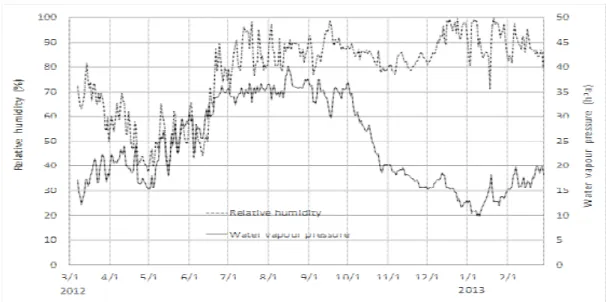
The relation of relative humidity and daily average water vapor pressure is shown in Figure 2.4. As for the annual changes, the water vapor pressure is higher during the Monsoon season and it is lower during the winter season, but the relative humidity fluctuates from 80% to 100% from the Monsoon to winter season. That the difference between water vapor pressure and relative humidity becomes larger after October is probably caused by the drop in air temperature and the decrease of the amount of water vapor in the atmosphere after Post-monsoon season sets in.
6
Figure 2.4 Variations of daily mean relative humidity and water vapor pressure observed at Balpuri primary school outdoor during Mar.1, 2013 to Feb.28, 2014
2.2 Global solar radiation and evaporation in the Terai lowland
The surveyed area is located in the flat terrain continuing from the alluvial fan on the south side of the Siwalik Hills. In determining the cause of groundwater arsenic contamination in the area, it is extremely important to grasp water balance of the area. For the purpose of analyzing it, we made observation of global solar radiation and precipitation using high-precision measuring instrument at the Balpuri Primary School. And in Patani, about 2km north of the school, we observed the amount of evaporation using the hand-made evaporimeter (Photo 2.2). Comparing the results with the Penman estimating equation (1948), we examined their validity. On the relation of the amount of extraterrestrial solar radiation with the amount of global solar radiation in 2013, daily annual change is shown in Figure 2.5.
Photo 2.2 Original instru Figure 2.5 Variations of global solar radiation -ment of evaporation observed during Mar.1, 2013- Feb.28, 2014
7
The amount of global solar radiation from January to the end of March tends to increase in parallel with the amount of extraterrestrial solar radiation, but it turns into flat from April to September. The increase in the amplitude from June to September is caused by the fact that the time falls on the Monsoon season. Monsoon brings rain and often heavy storms, thus, rainy and cloudy days are likely to prevail. In Post-monsoon season in October and later, the amount of global solar radiation once again began to show the changes in parallel with the amount of extraterrestrial solar radiation.
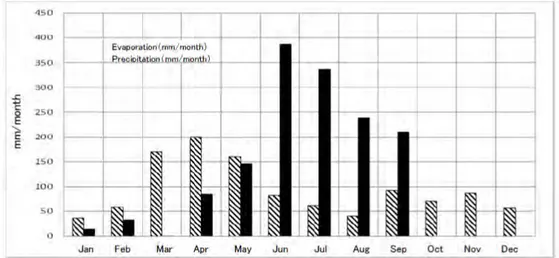
Annual change of monthly precipitation and monthly evaporation in 2013 is shown in Figure 2.6. This Figure indicates that higher incidence of precipitation takes place during the 6 months from April to September, and especially during the 4 months from June to September, which falls on the Monsoon season, the precipitation is 1173mm, which occupies 80.8% of the annual precipitation. On the other hand, the amount of evaporation becomes larger during the Monsoon season from March to May. This is probably caused by the increase in the amount of global solar radiation, the rise of temperature and the decline of relative humidity.
Figure 2.6 Variations of monthly precipitation and evaporation in 2013
We also calculated the amount of evaporation (E0) using the Penman equation (1948) below, and
compared the calculation results with each daily values of the measured values.
Ea = 0.26 (1+0.537u) (eTa-ea)
Where E0 is the amount of evaporation (mm/day), R0 is the term representing radiation, Ea is the term representing evaporation with aerodynamic effects, u is the wind speed (m/s), T is the temperature (℃), eTa is the saturated vapor pressure (hPa)at the temperature Ta (℃), e is the saturated vapor pressure in the atmosphere (hPa), Δ=de/dT is the change rate of saturated vapor pressure against the temperature (hPa/℃), γ is the psychrometer constant (CpP/0.622 L), Cp is the specific heat of air at constant pressure (1005 J/kg/K), P is the atmospheric pressure (1013hPa), L is the latent heat of evaporation (J/kg)
γ a
⊿ γ
⊿+ ⊿ +γ
8
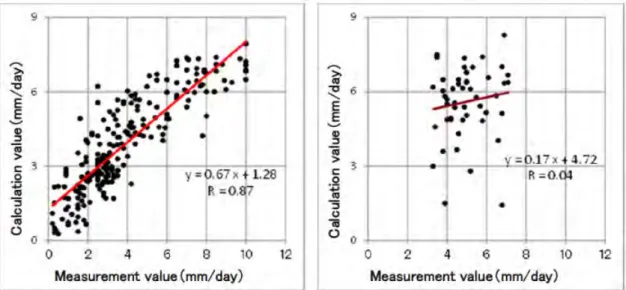
The tendency of both annual changes showed rather good correlation between the measured values and the calculated values, except for the duration of the Monsoon season from the middle of May to the beginning of September. Examining the relation of the two values more in detail, there is a high correlation (r=0.87)between them with the exception of the Monsoon season (Figure 2.7).
Figure 2.7 Measurement and calculation value of evaporation
(Left:Except Monsoon, Right:Monsoon)On the other hand, there was almost no correlation (r=0.04) between the two during the Monsoon season. Thus there is high correlation (r=0.87)between the values calculated with the Penman equation (1948) and the measured values except for the Monsoon season. Thus we confirmed the validity of evaporation amount observation in our research.
2.3 Indoor thermal environment in the Terai lowland
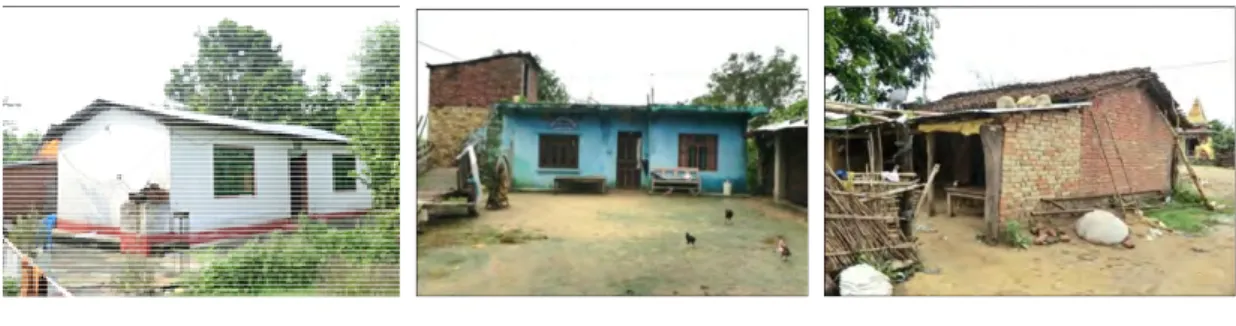
In order to characterize seasonal indoor thermal environment in the southern part of Nepal we conducted meteorological observation at three residential houses whose roof materials are different. The investigation object is in the villages of Mahuwa (No.8) and in Patani (No.30) shown in Figure 1.1 and Fig 2.1, the same as in Chapter 2.1 and 2.2. The appearance of the houses and the rooms as the investigation objects are shown in Photo 2.3. In order to examine the indoor thermal environment of the dwelling houses with zinc-coated steel roof, concrete roof and tile roof, we measured the temperature, relative humidity and black-bulb temperature every 30 minutes from March 1, 2012 until March 6, 2014.
9
Zinc-coated steel roof Concrete roof Tiled roof Photo 2.3 Outside appearance of each house at the observation sites
The temperature changes over time on fine days of November 2013 is shown in Figure 2.8. As Figure 2.8 shows, the temperature rises steeply after the sunrise in the dry season, and the diurnal range is larger than the Monsoon season. During the daytime on a fine day, the roof surface temperature is clearly different according to the types of roof materials, and we confirmed that this is the main cause of the indoor temperature difference. The indoor temperature is highest in the room with zinc-coated steel roof during the day and also highest in the room with concrete roof during the night. With the results, it was verified that the indoor temperature has something to do with the thermal characteristics of the roof materials.
Figure 2.8 Change of mean air temperature and global solar radiation on fine days in November, 2013
Figure 2.9 Change of mean air and global solar radiation on fine days in July, 2013
The temperature fluctuation over time on a fine day of July 2013 is shown in Figure 2.9. In the Monsoon season, the diurnal range of the temperature is small under the influence of the seasonal rainfall and high humidity. The indoor temperature of zinc-coated steel roof was high, while that of tile roof was low. It was because of the temperature difference between the two material types. Tile roof is porous and retains water inside and its heating suppression effects are stronger than
zinc-coated steel due to water and moisture retention. Zinc-coated steel roof is thin and cannot retain water inside. These results are more clearly shown after rain. It also became apparent that rainfall has a strong influence on indoor temperature.
10
3. Hydrogeological studies of arsenic contamination
The field survey and investigation were conducted to make clear the situations of arsenic contamination in groundwater and its effects to inhabitants in the Nawalparasi district, Terai Lowland, Nepal. It was found from the investigation that the distribution and the mechanism to accumulate arsenic compounds correlate to the geological structure and the conditions of seasonal variations of groundwater.
We carried out five series of field surveys, from March 2012 to August 2014, in order to complete monitoring and sampling of arsenic contaminated groundwater at more than 30 wards in the rural area of 6kmx10km dimension (Figure.3.1). The study area is located about 7 km east of Parasi, in the Nawarlarasi District.
Figure.3.1 Points of onsite measurement at Parasi district, Nepal.
Data of temperature, pH, EC (Electric Conductivity), ORP (Oxidation Reduction Potential) and DO (Dissolved Oxygen) were obtained by onsite measurement, and trace constituent, elements and ions in groundwater samples were analyzed by ICP-MS in laboratory. Figure.3.2 shows the measured values of arsenic in groundwater sampled in wet and dry seasons. Relatively higher concentrations were measured in dry season. These figures illustrated that the very high concentrations of arsenic appeared in the whole district, particular at the central part of the study
List of surveyed wards
11
area, there were some points over 300 to 500 ppb. Because the environmental criteria of arsenic in Japan and WHO standard are 10 ppb, the measured values are extremely higher level with potential cancer risk. The results of risk assessment showed that more than 3,000 persons per million habitants have been exposed by much amount of arsenic and take risks from skin cancer. The estimation of risk assessment is well consonant with the data by epidemiological investigation at the site.
12
Figure.3.3 shows the hexa-diagram of groundwater compositions in the dry season. At the central part of the study area, the shapes of hexa-diagram were relatively large which means the amount of dissolved components was larger than in the south area. This data showed that the potential of groundwater flow was significantly low in the central area, where the concentration of arsenic was higher than other part because of the anaerobic groundwater condition with low DO and ORP. There are no man-made point sources of arsenic compounds at the site.
Thus it was considered that the source of arsenic came from the sediments around aquifers at the district. Much amount of arsenic was eluted into the aquifers from the adjacent sediments by the reason of natural processes of geo-chemistry and micro-biology.
Figure.3.3 Hexa-diagram of groundwater compositions at positions of measurement. On the basis of the observed data, it was concluded that the high concentrations of arsenic were caused by the accumulation due to the dynamism of oxidation and reduction (redox potential) changes in geological formation. The maximum concentration of arsenic was 1,048 ppb as shown in Figure.3.2, and a lot of wells showed higher concentrations more than 300 to 500 ppm. On
13
the other hand, there were not contaminations in open dug wells. This is due to the high DO and ORP which represented the precipitation of arsenic in the groundwater.
The horizontal distribution of arsenic contamination was observed in this district as shown in Figure. 3.4. Heavy arsenic contaminations were widely observed in whole district, particularly in the central part of our study area. As a result of measurements of arsenic in the different depth of wells, it was found that the heavy contaminations were mainly occurred at the depth of 10 to 20 m. Figure.3.5 illustrates the correlation between the well depth and the concentration of arsenic. Highest arsenic was observed at the well depth of 16 m at screening position. The correlation between ORP and the depth of wells was also illustrated in Figure.3.6. This figure shows that lower ORP solely appears around at the depths of 15 to 25m. The relations of arsenic contamination and some parameters of ORP, DO and well depth are very important to understand the elution of arsenic into groundwater aquifer.
The mass balance of surface water was analyzed by the onsite measurement of rainfall, evaporation and runoff of water. By the comprehensive evaluation, it was found that there was very little infiltration in groundwater at the area as shown in Figure.3.7. This means that most groundwater came from the upstream recharge areas, not from the surface rainfall in this district.
14
Figure. 3.5 Correlation between arsenic concentrations and well depth
.
Figure. 3.6 Correlation between ORP and well depths.
15
4.The Geomorphology and Geological Settings
4.1. River System
The Kaligandaki River flows north to south by crossing the Himalayan ranges but the Siwalik Hills, a thrusted range by tectonic or orogenic uplift, changed its flow to the westward direction near Butwal as shown in the Figure 4.1. Then, the Kaligandaki River merges with the Narayani River and flows to the Ganges confluence. The catchment basin covers the central area of Nepal. Our study area near Parasi in Nawalparasi District, lies between the alluvial fan in Butwal and the Narayani floodplain adjacent to the Indian border. Figure. 4.2 illustrates the local drainage system
Figure.4.1 Study area and major rivers in Nepal (CIA Map, The World Factbook)
Figure. 4.2 Drainage system in the study area
We investigated the river system of the Kaligandaki River and the Narayani River sequentially from the north to the south.
The northern area is arid and vegetation is very poor. Most slopes are eroded as shown in the Photo. 4.1.
16
Photo. 4.1 Jomsom Airport along the Kaligandaki River
Even in the upstream area the river water is very muddy because of heavy weathering, landslides and glaciation. During our river survey we sometimes identified well sorted sand consist of clear quartz whose size is granule to medium. In the Kaligandaki midstream area we often confirmed the white sandbanks (Photo. 4.2).
Photo. 4.2 Small White Sandbank at the Kaligandaki Bridge (Midstream)
Near the Indian boarder white sandbanks were also identified and confirmed the clear quartz sand.
17 4.2. Terai plain
Basically Terai lowland is a floodplain and the overbank deposits mainly consist of silt and clay. The southern foot of the Siwalik Hills which is called Bhabar zone, is the alluvial fan and mostly composed of coarse sand, pebbles and boulders. Bhabar zone is considered to be the recharge area i.e., the main source of underground water in the Terai plains. The narrow belt is 3-12 km wide from north to south, which is covered by Sal forest, where we confirmed various braided channels. Most small channels are ephemeral streams and they become dry during the pre-monsoon.
The study area is located in the central flat belt where the width is approximately 10 km north-south. The number of artesian flowing wells decreased by the influence of mass tube-well pumping but a few exists near the fan edge in Bhabar zone..
The grain size of the alluvium decreases from north to south according to the inclination and its altitudes in Terai. However our investigation concluded the opposite results in our study area. The subsurface sediments on the south have large size sediments such as coarse sand, pebbles and gravels. The geological feature of the central area indicated very fine sand, silt and clay. It is very rare to find pebbles in rivers at our study area because of very flat topology. The river water becomes stagnant in the dry season and the flood-prone plain expands approximately 900km to the Bengal Bay.
4.3. Headwaters of the Kaligandaki River
Landslides as well as GLOF, glacial lake outburst floods, often occur triggered by earthquakes and indirectly by tectonic uplift and climate changes in Nepal. Rivers and streams carry clastic sediments downstream onto Terai lowland.
Photo. 4.4 Braided channels in Bhabar zone
18
The headwaters of the Kaligandaki River lies on high Himalayan range including Annapurna. Because northern Annapurna is an arid climate, weathering is very intense and the upstream area generates huge amount of weathered marlstone and glacial lake deposit into the Kaligandaki River. That is the reason why the river water is muddy. For example, the Mustang Khola is one of the headwaters of the Kaligandaki River basin. The erosional valleys expand approximately by 20 km east-west and by 50 km north-south. They belong to the Tibetan Sedimentary Zone, which is the bottomset bed or prodelta sediment containing very fine materials such as very fine sand, silt and clay. Many fossils such as ammonites and belemnites can be found in this area, meaning the Jurassic limestone matrix is marine sediments.
4.4. Geological Setting
In the northeast of the study area there are steep slopes of the Siwalik Hills which has 800m-1,100m linear peeks (Figure. 4.3). Large sediments such as boulders and pebbles are deposited at the south foot of the Siwalik Hills, where we identified braided rivers and permeable beds. This area was considered as a recharge zone. The erosional surface of the Siwalik Hills is a very small belt and produces limited amount of clastic rocks (Figure. 4.3). Approximately 10 km away from the Siwalik Hills there is no gravel and the entire surface is covered only by silt and clay. Silty soil occurs in any river bed located in the flat area
Butwal large fan is located about 50 km north-west away from the study site. It is situated at the foot of the Siwalik hills. Groundwater of Butwal has no arsenic contamination, where sediments are mainly large sediments such as sand, pebbles and rounded gravels.
The study area is flat land and it mainly consists of silt and clay. Estimated content of the clay up to 50m depth is 60% - 80% of the whole sediment and the remainder is silt. Silt and clay layers shall have been deposited very slowly with coagulation and sedimentation.
Narayani River is located about 30km south-east from the study area. Its high-water level is higher than the elevation (104-109m) at the central part of the study area, i.e., the study area is flood-prone.
One of the branch streams of the Narayani River is the Karigandaki river. Through midstream to downstream area of both River there are well-sorted sand which consists of clear quartz sand. In case of heavy rain and flooding such sand could be carried down by the rivers to the study area in the Terai lowland.
In the norther study area we confirmed the aquifer consisting of small pebbles (4mm - 7mm in diameter) at the depth of 12 m by drilling. The well is located at No.2 site about 4 km away from the Siwalik fan edge. The pebbles in the aquifer are considered to be originated from the Siwalik Hills. However, clear quartz sand was not confirmed in the drilling samples.
Figure.4.3 Linear Drainage Divide of Siwalik Hills
19
At the No.4 site, Khokhapurwa, we drilled two test wells. Surface silt layers up to 3 to 4 m are yellow to orange-brown but dark brown spots or small brindles occur at deeper clay layers. Then a shallow aquifer, containing a dark gray sand layer, was identified. The groundwater showed arsenic contamination. The water temperature was 26℃, ORP -30mv, and DO was 29% at the depth of 14m.
However, the deeper groundwater at the depth of 30m has no arsenic contamination. The water temperature was 25.9℃, ORP +130mv, and DO was 54%. The deeper aquifer materials, indicating light brown and light gray, were obviously oxidized.
Photo. 4.6 Sample sediments at Khokhapurwa No.4 site.
Round samples are silt/clay and the light color layer has no As contamination.
On the south of the study area, at Dewagau (No.14 site) shallow aquifer materials were confirmed small brown and gray pebbles. Local experienced drillers told us that the center of the study area has mainly silt and clay layers but in the southern area pebble aquifers can be found very easily. Our drilling results were in conformity with local drillers’ experience. We inferred that the groundwater is stagnant at the study area because of the flat or gentle hydraulic gradient and gradual topography. In the south of the study area there are better aquifers consisting of pebbles. The aquifer materials are considered as originating in ancient river flows.
Based on our field study, the geological section, Terai zone-Flatland, made by C.K. Sharma (1981) well explains the feature of the study area (Figure. 4.4).
Relatively new sediments locate southern part of the study area, may have been carried from the Siwalik Hills, however, at the center part, aquifer materials with well-sorted quartz sand are estimated not originated from the Siwalik Hills. The Narayani River should have carried such quartz sand which is shown in the Photo 4.7. We confirmed that there is no clear quartz at local small rivers nor Siwalik streams , which originating from the Siwalik Hills.
20
Figure. 4.4 Geological section(C.K.Sharma 1981)
Photo. 4.7 Clear well-sorted quartz sand, at Patkhauli, No. 13 shallow aquifer
Considering the geology of thick silt-clay layers we infer that the site used to be lowlands, such as wetland or pond and the surface water was standing because of flat topography. Small particles such as clay have tendency to adsorb and accumulate arsenic contamination.
Butwal lies on the sloping fan at the foot of the Siwalik Hills. Its geological feature is fluvial deposits whose porosity is very high and the groundwater flow is active. In Butwal there is no arsenic contamination including flat area.
Probably our study area was influenced by muddy flood water coming from the Narayani River. Clay particles should have adsorbed arsenic and accumulated at the area.
21
5. Field Study on the Inhabitants and their Life
Our survey purpose is to identify the arsenic contamination and improve the well water (groundwater) usage. We utilized questionnaire and interviewed each villager living in the arsenic contaminated area. Then we observed the actual use of the drinking water wells by the local inhabitants, the arsenic contamination and the potential problems and considered future measures to be taken on drinking water use.
5.1 The Surveyed Area and the Details
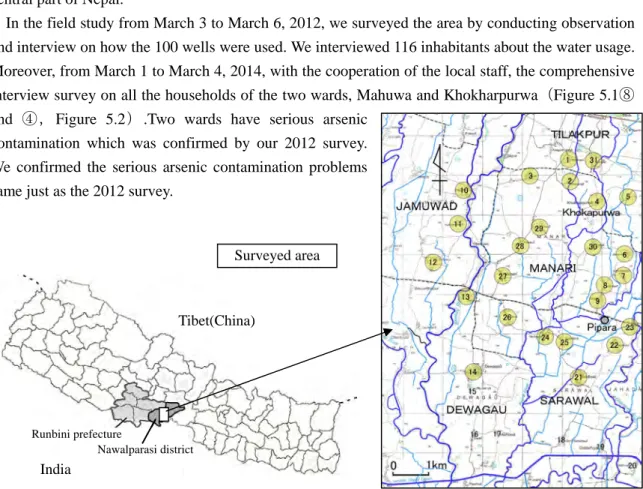
The surveyed area includes the 5 villages, Jamwad,Tilakpur,Manari,Dewagau,Saraw, which located in Nawalparasi district, on the east of Runbini prefecture in Terai lowland in the southern central part of Nepal.
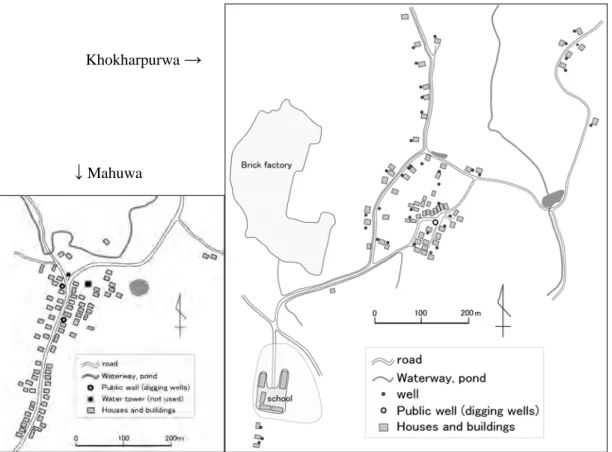
In the field study from March 3 to March 6, 2012, we surveyed the area by conducting observation and interview on how the 100 wells were used. We interviewed 116 inhabitants about the water usage. Moreover, from March 1 to March 4, 2014, with the cooperation of the local staff, the comprehensive interview survey on all the households of the two wards, Mahuwa and Khokharpurwa(Figure 5.1⑧ and ④,Figure 5.2).Two wards have serious arsenic
contamination which was confirmed by our 2012 survey. We confirmed the serious arsenic contamination problems
same just as the 2012 survey.
5.2 Summary of the Religion, Ethnic Groups and Caste System
The Terai lowlands in the southern part of Nepal are culturally close to India, and the Hinduism is widely believed, with a small percentage of Islam.
Tharu people was indigenous to the Terai lowlands and many of them live there. When Malaria was exterminated in the 1950s, various kinds of races entered the area from other part of Nepal and India. Now each ward has each individual dialect, diversifying their culture.
Surveyed area
Figure 5.1 Surveyed Wards (Villages) Tibet(China)
India
Runbini prefecture
22
Figure 5.2 Wards Surveyed in March, 2014 (Mahuwa, Khokharpurwa) Table 5.1 Relations between Tribes and Castes
The racial and ethnic characteristic of the two words (Mahuwa and Khokharpurwa) where we investigated in March, 2014, is that more than 80% are Tharu,. The rest is Bahun and Neware that are believed to be indigenous people of Nepal central mountainous region.
In our study area the caste system mainly consists of Burauman, Chetri, Baisia, Shudra, Darit and so on. Table 5.1 Relations between Tribes and Castes
5.3 Research on the Well Use
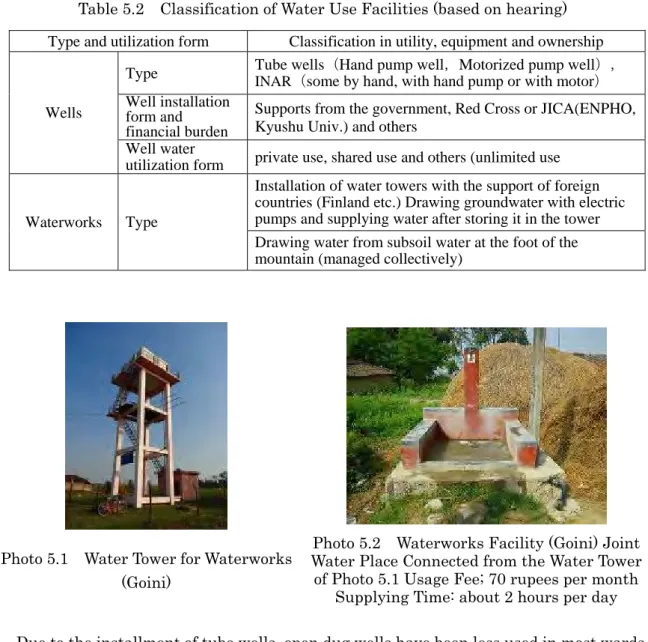
Most of their drinking water and everyday life water comes from tube-wells and the traditional dug well called inar. Some utilizes piped water from overhead water tanks.
In the waterworks, they pump up deep groundwater as water sources, and after being stored in the Khokharpurwa
→
23
overhead water tank, it is supplied to each household (Photo 5.1, Photo 5.2). In some waterworks, the water is drawn from the northern hill areas through the water pipes, and supplied to the houses (Photo 5.3).
Table 5.2 Classification of Water Use Facilities (based on hearing)
Due to the installment of tube wells, open dug wells have been less used in most wards these days. However, dug wells are still being used for daily life in a few wards such as Mahuwa as public use.
5.4 The Research on Drinking Water and Daily Life Water
5.4.1 The Results of the 2012 Survey
In the surveyed 25 wards, we conducted interview investigation and confirmed that the wells consisted of 79 tube wells, 18 dug wells (traditionally called inar) and 3 waterworks. Depth of the dug wells are 5.25m to 8.2m. Tube wells depth is the range of 18.3m~24.4m, which occupying 73% of all the wells (Figure 5.3). Most of the tube wells have been installed in recent years, i.e., more than half of them were installed within 10 years, and about 20% of them within a year.
Type and utilization form Classification in utility, equipment and ownership Type Tube wells(Hand pump well,Motorized pump well), INAR(some by hand, with hand pump or with motor) Well installation
form and financial burden
Supports from the government, Red Cross or JICA(ENPHO, Kyushu Univ.) and others
Wells
Well water
utilization form private use, shared use and others (unlimited use Installation of water towers with the support of foreign countries (Finland etc.) Drawing groundwater with electric pumps and supplying water after storing it in the tower Waterworks Type
Drawing water from subsoil water at the foot of the mountain (managed collectively)
Photo 5.1 Water Tower for Waterworks (Goini)
Photo 5.2 Waterworks Facility (Goini) Joint Water Place Connected from the Water Tower of Photo 5.1 Usage Fee; 70 rupees per month
24 0 20 40 60 80 100 120 140 160 180 200 0 10 20 30 40 50 Year of installation(before~) T he d e pt h o f t he w e ll( feet ) 0 10 20 30 40 50 60 70 80 0 5 10 15 20 25 Year of installation(before) D ep th(f eet )
5.4.2 The Results of the 2014 Survey
Figure 5.5 shows the depth of the well in Mahuwa and Khkharpurwa of the 2014 survey. In Mahuwa, most of the wells are 55 to 65 feet (16.8m to 19.8m) deep, and only a
Photo 5.3 Waterworks drawn through pipes from subsoil water at the foot of the mountain (Suryapura)
Photo5.4 Traditional Moat Well with bricks piled up(Kothilaha)
Photo5.5 Common Tube Well
(Mahuwa) (School in Khokharpurwa) Photo 5.6 Well with motor pump
Figure 5.3 Relations between the depth of tube well and the year of installation
Figure 5.4 Relations between the depth of well not drinkable and the year of installation
25
few are less than 50 feet (15.2m) deep. In Khokharpurwa, many of them are 65 to 75 feet (19.8m to 22.9m) deep. However, characteristically the shallow wells ranging from approximately 20 feet(6.1m) to 35 feet (10.7m) deep are very easy to get. The concentration of arsenic varies in areas and there is the spatial, vertical and temporal variation of the arsenic concentration.
Finally, the inhabitants generally get the groundwater from the aquifer 50 to 75 feet (15.2m to 22.9m) deep where the arsenic concentration is often very high. That is the problem. 0 10 20 30 40 50 60 70 80 90 0 10 20 30 40 50 60 井戸(番号) 井戸の深さ (f ee t) 0 10 20 30 40 50 60 70 80 90 0 10 20 30 40 50 60 井戸(番号) 井戸 の深 さ ( feet )
Figure 5.5 Depth of Surveyed Wells; Mahuwa (left), Khokharpurwa (right) 5.4.3 Characteristics in Water Use
(1) The relationship among the well depth, the installation year, and arsenic damage
The tube wells (79 in total) began to be installed about 40 years ago. In the beginning the depth of the wells were only 20 to 40 feet deep(6.1 m~12.2m), but later they dug deeper wells, and most of them were 50 to 70 feet deep(15.2~21.3m) about 20 years ago, and the current wells are 50 to 70 feet deep in most cases. In recent years, some of the wells are more than 80 feet deep.
The contaminated wells from which people cannot drink water were mostly installed within 20 years and are 45 to 75 feet deep. Wells of 45 to 75 feet depth seem to have something to do with arsenic contamination and health hazard (Figure 5.4).
(2) Characteristic of water usage by the interview and questionnaire surveys
Following characteristics of the water supply and utilization were identified by our interview and questionnaire surveys to the local inhabitants in 2012 and 2014 (Figure 5.6 and Figure 5.9).
・Many people feel they are blessed with good abundant water, but they are worrying about a little bit about the water quality.
Enough 76% Plenty 6% Not so enough 14% Not enough st all 4% Figure 5.6 Concerning the Amount of water
Available D epth of the wel l D epth of the wel l Well (number) Well (number)
26
・Many of them suspect that the groundwater may contain arsenic, but they don’t know exactly what arsenic damage is all about, or fully do not understand the problem.
・Public campaign on arsenic damage has been undertaken, however, local people does not understanding it.
・Half of the people who have suffered from arsenic disease have not been examined by the doctor.
・In 2012 survey, we confirmed that almost all inhabitants in 25 words drink groundwater without boiling. But in the detailed survey in 2014, it was confirmed that 49 people (33.8%) living in two wards, Mahuwa and Khokharpurwa, drink groundwater after boiling.
・Concerning water supply, many people requested to install overhead water tanks and the waterworks and/or water filtering devices.
・Most people does not show interest for rainwater harvest which is collecting rainwater for drinking water. Q48 On arsenic damage 91 24 0 10 20 30 40 50 60 70 80 90 100
Heard of it before Never heard of it
人 Q50 Illness ob arsenic 3 0 45 53 0 10 20 30 40 50 60
Suffering from it Have suffered from it before
Have never suffered from it
Not aware of it
人
Figure 5.8 Questionnaire on Arsenic Related Illnesses (the number of people)
5.5 Use of Arsenic-contaminated Water
Groundwater drawn from tube wells in the study area shows high-concentration arsenic of 100ppb to 300ppb in many points, which far exceeds the water quality standard (Japan and WHO: 10ppb and Nepal: 50ppb).
In some tube wells, the concentration showed as high as over 500ppb. They started to utilize the groundwater from the tube wells about 20 to 30 years ago. They pump up the groundwater from aquifers ranging from 40 to 70 feet (12m to 21m) deep, where the arsenic concentration is very high. Many of the inhabitants are still drinking the water.
Chronic arsenic poisoning is caused by drinking arsenic-containing water for a long time. Arsenic affected person tends to get cornification and melanin pigmentation, especially on their palms (photograph 5.8). Furthermore, arsenic causes various cancers. It is necessary to prevent serious health damage that some measures not to drink arsenic contaminated water must be implemented and all arsenic contaminated wells should be announced. Furthermore, the reliable drinking water source is necessary.
The use of the arsenic filter increased. Only one case of the filter use was found in 25 wards by our
Tast es good 84% Tast es bad 15% Neit her 1% Figure 5.7 Concerning the Taste of Drinking Water
27
2012 survey, however, 49 cases (34%) were identified in Mahuwa and Khokharpurwa by the 2014 survey. Although the use of filter seems to have become popular, there are differences in their awareness and recognition by the degree of the outbreak of the arsenic illness in each area. In Mahuwa and Khokharpurna, the serious arsenic damage seems to have made people comparatively highly aware of their drinking water.
5.6 Realities and challenges of arsenic damage
In our 2014 survey, it was revealed that two men in their 30s and 40s died by drinking arsenic contaminated water in Mahuwa in 2013. A lot of people worrying about arsenic health damage came to our survey team for help and they asked us if the drinking water was safe, and some asked us to have their health conditions examined.
Measures taken against arsenic damage include the use of arsenic filter and the alternative safe water sources, but they could not improve fully. For example, the supply of the arsenic filter has not been sufficient. Above all, it is important to maintain the filters regularly, but once they break down, they are apt to be left abandoned.
The situation of the well water use is different one by one such as its equipment and locations. Most tube wells are not installed beside proper drainage, so stagnant waste water or garbage surrounds the wells, with serious hygienic problems sometimes by domestic animals. Therefore it is necessary to improve the well environment, such as where to place the wells and how to install them. Improving facilities to avoid arsenic exposures have close relation to the economy of each family and their ethnic custom.
It is the reality that they cannot help using contaminated water in their villages, because of their tribes, caste and the economic conditions. Even if they are aware of the arsenic exposures and its health hazards, they cannot find hospitals or doctors in the neighborhood, or cannot go to the doctors because of poverty. This is complicatedly intertwined with awareness of arsenic.
Photo 5.8 Skin disease patients thought to be suffering from arsenic contamination damage Two brothers (left; elder, in the latter half of 10s, right; younger, around 10 years old) who seem to have suffered from skin disease caused by arsenic; Black spots appear on their skin.
The worrying mother let us take the pictures. She told us that she wanted to consult with a doctor about the disease of her sons (in Jyamuniya Ward)
28
6. Countermeasures of arsenic contamination
Rainwater harvesting is one of the water resource options in this area, since rainwater does not contain salts, arsenic and other toxic components and it can be easily collected from roofs. The water supply experiment was conducted to take an opportunity of rainfall utilization by installing the accumulation system and the large water tanks at the Balpuri Primary School. Photo.6.1 shows the installed water tanks with a volume of 200 L per unit and the pipe systems which lead the rainwater into the tank.
There were some problems in this system, such as uneasiness and inexperience against the rainwater as drinking water and the sanitary issues including algae and bacteria. The improvement will be expected for considering more convenient and culturally oriented measures.
Photo. 6.1 Water Tanks and the Piping Systems for Rainwater Harvesting
Various onsite measurements were performed by utilizing useful apparatus for arsenic detection. For reliable and high-performance test kits, we selected two types of onsite analysis kits, one is a conventional kit (Quick II 481303, Photo.6.2) with high accuracy and another is a special field kit (Hironaka II/V As valent, Photo 6.3) with a function of discrimination of arsenic valences. Those onsite kits are very useful to evaluate the exposure of arsenic contaminated water in the study area. Particularly, since the chemical compositions in sampled water are quickly transformable due to oxidation and reduction, it is very important to recognize the real time situation of arsenic in terms of its concentration and sensitive valent conditions.
Table 6.1 shows the results of onsite measurements for some kinds of groundwater samples. Each sample indicated specific variability of the concentration and valent of arsenic as time passes. These data were extremely valuable for onsite measurement and risk assessment for arsenic toxicity and exposure.
29
Photo.6.2 Test kit of quick arsenic detection. Photo.6.3 Test kit for arsenic valent detection. Table 6.1 The results of onsite measurement of arsenic by using test kits.
Table 6.2 The results of risk assessment for the intake of arsenic contaminated water.
Table 6.2 shows the results of risk assessment for the typical situations occurred in the study area. According to the result, more than 3,000 persons per million of habitants were suffering from skin cancer risk caused by arsenic. This estimation consistently followed the results of field investigation of health as described in the final report written in Japanese.
It was found from the onsite measurement that the habitants in the study area have taken unacceptable risks of arsenic exposure by drinking groundwater. Thus we considered the measures to mitigate the serious situations of arsenic risks. The most important things to solve the problems were cost-performance and culturally oriented technology. Two types of mitigation measures, exposure control and removal of arsenic, were introduced, based on the onsite measurement data.
Unit ppb
Total As
As III
As V
ORP(mV)
Sample 1(Reduced) 320 240 80 -240
Sample 2(Open) 140 80 60 -180
30
Figure.6.1 The introduction of filter system for the removal of arsenic and fluoride.
Figure.6.1 illustrates the set-up of filter system for the removal and exposure controlled processes with some materials and sand column. Iron or alumina filters were utilized for the reduction of arsenic, and sandy column was installed for the filtration of suspended solids and organic matters. By using this system, it is possible to mitigate the exposure and risk of both arsenic and fluoride up to 1/10 to 1/100.
Fundamental experiments to test the performances of such materials were carried out, by onsite measurements and test trials using iron powders, alumina, sand and their assortments. The utilization of iron and alumina powders was very effective to remove arsenic from groundwater, and the most effective condition was obtained under the specific combination of iron and sand column. The results of experiments are summarized in Figure.6.2. This investigation was clearly made out the utilization of an arsenic filter system using iron nails and sands, as shown in Photo. 6.4.
31
Photo.6.4 Using filtering system for arsenic removal in houses in Parasi.
An important phenomenon was observed in the experiment that the concentrations of arsenic shortly removed with time by the oxidation and precipitation mechanisms. Figure. 6.3 shows the natural attenuation of arsenic in groundwater without any utilization of chemical materials. In a day or a couple of days the arsenic concentrations decreased up to 1/2 to 1/3 compared with the initial stage of sampling. Thus it is very important to understand the dynamics of arsenic in aquatic system. It is possible for habitants to mitigate the risk of arsenic, only for waiting 12 hours or 1 day ahead of drinking.
Figure.6.3 The natural attenuation of arsenic observed in groundwater samples.
Geological surveys showed the higher concentrations of arsenic solely took place in the second aquifers in most cases as mentioned in Chapter 3. Thus it is very important to select the appropriate aquifer to obtain safe drinking water. Moreover, the prevention of contaminated groundwater migration into safer deep aquifers is also necessary. On the basis of the fundamental investigation, we suggest the scientifically proper way to find safer groundwater and the quick detection of arsenic before drinking the well water.
C o n c e n tr at io ns of a rs e n ic (p pb) Time elapsed(hr)
32
7. Summary
During the last 5 years from 2011 to 2015, we comprehensively investigated our study area based on various disciplines. Especially we focused on meteorological and weather conditions, water analysis and groundwater movement, geographical and geological structures, actual living conditions of the
inhabitants, and measures against arsenic contamination etc., in Parasi, Nawalparasi County in the Terai lowlands, where arsenic contamination in groundwater is very serious.
7.1 Studies on meteorological and weather condition
Our study area is situated in Monsoon climate zone, and the Monsoon season falls on
from the middle of June to the middle of September, during which more than 90% of the
yearly rainfall converge. The latter half of April, just before the Monsoon season, is called
pre-Monsoon season, when it clears up every day, and the temperature reaches highest of
the year and sometimes at more than 40℃. Due to the increase in the amount of global
solar radiation, rising of temperature and the decrease in relative humidity, the amount of
evaporation in this period scores highest. Until the latter half of December after the
Monsoon season, post-Monsoon season comes in, when there is a long spell of fine and
moderate weather. With Siwalik mountains from the north, during the pre-Monsoon and
post-Monson seasons, northerly mountain wind descending the mountain slope during the
night, and southerly valley wind ascending the slope during the day are predominant
respectively.
In order to empirically show the seasonal variations of the room temperature of the local
houses in this sub-tropical area, we conducted the observation in the three houses whose
roofs consist of galvanized iron sheet, tile and concrete respectively. In the Monsoon season,
due to heavy rainfall and high humidity, both the decline of temperature during the night
and diurnal range are smaller than in the other seasons. The difference in temperature
between the iron sheet room, which was hottest and tile roofed room, which was least hot,
was great during the day. This is because, along with the heat capacity, the difference is
reflected in the temperature of tile roof, which suppresses temperature rise with strong water retention, and zinc-coated iron sheet-roof, which cannot retain water. Innon-Monsoon season, the temperature tends to rise steeply after the sunrise and the diurnal
range is greater, especially in the case of zinc-coated iron sheet roof . The temperature
during the night is highest in the concrete roof room, and the difference is great compared
with the other roofs. It was demonstrated that this was caused by the effects of heat
receiving on the roof surface during the day, and heat dissipation off the roof surface during
the night.
7.2 Hydrological Study on Arsenic
We conducted research on the groundwater arsenic(As) contamination and its seasonal
variation. The aquifers in this area can be divided into three parts: the first from 5 - 6m
deep (shallow groundwater), the second from 12 - 23m deep, and the third from 30 - 50m
deep. Arsenic density (As concentration) of the first is relatively low ranging from 10 to
100ppb, and the third extremely low from 0 to 10ppb, while the second aquifer is from 10
to 1000ppb. The seriously contaminated groundwater is found only in the second aquifer.
The ORP of the groundwater shows minus value and the groundwater is in the reductive
conditions in the second aquifer. Groundwater with high arsenic density shows the higher
Fe2+ density, which explains arsenic elution under the reducing conditions. In the surveyed
area, the groundwater flow is thought to be extremely slow, and much of the dissolved ion
stays in reducing condition. In the dry season, the arsenic density is 10 - 12% higher than in
the rainy season. In a tube well of highest As density, the value reached at 1,048ppb, and in
33
many other wells, it exceeded 500ppb. After confirming the widespread groundwater
arsenic contamination, we identified the horizontal and vertical As distribution. The level,
movement and arsenic density of groundwater in this area greatly vary in both the rainy and
dry seasons, and in each year. Such findings helped us understand the mechanism of
groundwater arsenic contamination and the relation of aquifer distribution.
7.3 Geographical and geological study on arsenic
For the purpose of grasping geological situation in the arsenic contaminated area of
Nawalparasi and elucidating the arsenic enrichment, we drilled several tube-wells, 20 -
50m deep and collected sediment samples. We conducted detailed chemical analysis on the
groundwater and sediment samples, and investigated the relation between the geological
condition and arsenic density of the groundwater.
Sediments consisting of very fine, fine, and medium to coarse grained sand contain very
little arsenic, no more than 1 mg/kg. This is not particularly high showings compared with
general environment, but they contain several times more than in the case of sand layer.
Seeing that there is difference in chemical composition consisting aquifer and aquiclude, it
is estimated that host rocks of deposited particles are not the same. Qualitative analysis
results using XRD showed that silt and clay layers contain weathering minerals such as
small clay mineral and chlorite, and the aquifers contain much rock forming minerals such
as quartz and feldspar.
All these things show that arsenic accumulates in the silt and clay layers, and this may
cause ground water contamination in the process of sediment deposit. And the possibility
was suggested that arsenic concentrates in the silt/clay layer between the aquifers and elutes
with high density into the groundwater in the anaerobic geological environment.
The knowledge obtained from our research will from now on provides useful scientific
insight in making measures against arsenic and health risk protection, such as structure
improvement of drinking water wells, guidance for drinking safe groundwater and
prevention of the As exposure risk.
7.4 Studies on Actual Living Condition of the Inhabitants
The villagers in the study area are faced with the serious problems of drinking water in
their everyday life, and they have to deal with a lot of difficulties. We conducted
questionnaire investigation and surveyed on the actual situation of drinking water usage, in
25 wards in 2012 and in 2014, we focused on two As suffering villages, Mahuwa and
Khokharpurwa. In the investigated area, drinking water is easy to obtain both in the rainy
and dry seasons. The most serious problem is that even now they keep drinking
arsenic-contaminated water every day.
In the area, they depend on 50 - 70 feet(15.2 - 21.3m)deep tube wells and the aquifers
contain much arsenic, it is possible to cause arsenic diseases in the future. The water of
shallow open wells (INAR) in most is free of arsenic, but the water has other contamination
such as colon bacilli and nitrates because of poor hygiene.
As for damage from arsenic contamination, JICA and supports from Nepali government
and from abroad have provided educational activities regarding arsenic contamination and
helped construct safer wells, but they haven’t yet succeeded in providing daily life water
(drinking water). In order to strike measures against arsenic contamination, water tower
(overhead tanks) and safe water service are being provided by the Nepali government
(supported by foreign countries), but there remains problems of poor electric supply and
lack of maintenance capacity. Many villagers hope to install water tower systems but the
construction of water tower is not an easy way of solving the current and potential
problems. This is because the construction cost is so high, and there remains unsolved
34
problems like maintenance costs, supply facilities and fee burden.
Also, most arsenic patients haven’t had a doctor and diseases caused by arsenic haven’t
fully understood yet, and this makes the problems more difficult. In the background, land
lease issues caused by traditional landlord system, and discrimination and poverty caused
by caste system and tribal difference are thought to have something to do with the living
conditions of the inhabitants and arsenic damage. These things must be considered in the
future.
7.5 Studies on Measures against Arsenic Contamination
Based on the survey results of As groundwater contamination in Nawalparasi, we
conducted quantitative evaluation on health risk of taking in arsenic. With the use of
Geo-environmental Risk Assessment System (GERAS) (Kawabe, 2008), we assessed the
health risk of drinking the groundwater, and estimated that the cancer risk is 1.5-7.5×10⁻³.
Drinking such As contaminated water all their lives is expected to increase the probability
to cause cancer in 150-750 people in 100,000. The local NPO (ENPHO, 2004) and JICA
also conducted the epidemiological study and reported similar health risk. This could show
very serious situation. And for the feasible measures against arsenic in the area, we
considered a way to get rid of As from groundwater and how to construct arsenic-free tube
wells.
The arsenic density of groundwater taken from the highly arsenic-contaminated tube
wells declined by half after leaving it at rest for 12 hours, and by about 30% after 24 hours.
During that duration, the ORP of the groundwater changed from -240mV just after
collecting it to +200mV after 12 hours. From the results of the experiment, we found that it
is certainly possible to reduce the health risk when drinking the water taken from the well
after leaving it at rest half a day.
Using sand, aluminum powder and iron powder or with the combination of them for
filtering, we experimented the arsenic removal effectiveness of them in for the As
contaminated groundwater. With the results, we proved that it was possible to remove
arsenic effectively with making use of sand and iron filters in the field. Actually, many
arsenic removal filters stuffed with river sand and iron nails, which are available locally,
have been introduced. By keeping the exact amount of sand and iron and the duration of
retention time of groundwater, and providing regular maintenance precisely, it was
experimentally confirmed that arsenic can be removed easily from contaminated water.
From now on, based on these empirical results, it is important to go on examining more
specific measures and solutions. In the basic research field, we initiate investigation into the
movement like the mobility of arsenic in the stratum and aquifers and its chemical form,
accumulation of basic data concerning the health impact of arsenic and geological
environment, and what is more, development of a less expensive way to remove arsenic.
In the field, it is essential to take further measures against arsenic with the residents
taking part. For that, first of all, it is of great significance to educate and deploy human
resources familiar with fundamental knowledge of arsenic and measures against it. In
corporation with the local NPOs and the municipality bodies, we will continue cooperation
activities from now on so as to have many human resources appear in the society. What is
more, for our realistic approach, it is indispensable to cooperate with JICA in securing
full-fledged alternative water resources and constructing businesses linked with other
industries like agriculture.
35
Presented Papers on the Nepali Study
OOKA, K., KOMAI, T., NAKAMURA, K., HAMADA, H., MATSUO, H., YACHI, T., MATSUMOTO, F. and TANIGUCHI, T. 2013 : Arsenic Groundwater Contamination of Lowland Terai and its Relationship with the Headwater Areas in Nepal. Proceedings of the 23rd Symposium on Geo-Environments and Geo-Technics. 147-152.
KOMAI, T., OOKA, K., NAKAMURA, K., HAMADA, H., MATSUO, H., YACHI, T., MATSUMOTO, F. and TANIGUCHI, T. 2013 : Arsenic Groundwater Contamination in Lowland Terai Nepal and its Correlation with Geological Environment. Proceedings of the 23rd Symposium
on Geo-Environments and Geo-Technics. 153-158.
NAKAMURA, K., MATSUO, H. and OOKA, K. 2014 : The Local Life Style and the Industry Harmonizing with the Natural Environment of Nepal with its Historic Transfiguration and the Contemporary Nepali Problems. The Keiai Journal of International Studies, No.27, 1-17.
NAKAMURA, K.., MATSUMOTO, F., HAMADA, H., KOMAI, T., OOKA, K., YACHI, T., MATSUO, H., TANIGUCHI, T. and TODA, M. 2014 : Climatic Environment Investigation in Terai, Lowland Nepal. Journal of the Geographical society of Hosei University, No..46, 17-24. NAKAMURA, K., MATSUO, H. and YACHI, T. 2014 : A Study of Rural Life and Water Usage in
Terai, Low Land in Nepal. Annual Bulletin of the Keiai Institute for Area Studies, No.4, 110-126. HAMADA, H., NAKAMURA, K, Komai, T., OOKA, K., TANIGUCHI, T., YACHI, T.,
MATSUMOTO, F., TODA, M., MATSUO, H. and GHIMIRE, H. P. 2014 : A Study of Arsenic Contamination of Groundwater during the Dry Season in lowland Terai, Nepal. Bulletin of the Faculty of Education, Chiba University, Vol. 62, 385-392.
OOKA, K., KOMAI, T., NARISAWA, N., NAKAMURA, K., HAMADA, H., MATSUO, H., YACHI, T. and MATSUMOTO, F. 2014 : Arsenic Contamination and the peripheral geology in lowland Terai, Nepal. Proceedings of the 24th Symposium on Geo-Environments and Geo-Technics. 45-50.
KOMAI, T., OOKA, K., NAKAMURA, K., HAMADA, H., NARISAWA, N., MATSUO, H., YACHI, T. and MATSUMOTO, F. 2014 : Onsite Investigation and Countermeasures for Arsenic Contaminated Groundwater in Lowland Terai, Nepal.
Proceedings of the 24th Symposium on Geo-Environments and Geo-Technics. 51-56.
KOMAI, T. and NAKAMURA, K. 2014 : Onsite Investigation for Arsenic Contaminated Groundwater in Lowland Terai, Nepal (a quick report). Environmental Management, Vol.50, No.11, 22-26.
NAKAMURA, K. and MATSUMOTO, F. 2014 : Climatic Environment Investigation in Terai, Lowland Nepal. Environmental Management, Vol.50, No.11, 27-31.
NAKAMURA, K.., MATSUMOTO, F., KOMAI, T., MATSUO, H., YACHI, T. and OOKA, K. 2015 : Observation Results of Global Solar Radiation, Precipitation, and Amount of Evaporation in Nawalparasi District in Central Terai, lowland in Nepal (2013). Annual Bulletin of the Keiai Institute for Area Studies, No.5, 43-49.
MATSUO, H. and NAKAMURA, K. 2015 : A Study of the Water Usage of Rural Community of Terai, Low Land in Nepal. The Keiai Journal of International Studies, No.28, 33-49.