<MBA Degree Thesis>
AY 2015
D ETERMINING THE F ACTORS FOR P ASSENGERS ’ A IRPORT C HOICE W ITHIN N ORTHEAST A SIAN
A IRPORT S YSTEMS
A Focus on the Northeast Asian Aviation Circle
35132335-0 B ENJAMIN L IU
G LOBALIZATION AND B USINESS L EADERSHIP
C.E.
R
EIJIO
HTAKID.E.
H
IRONORIH
IGASHIDE D.E.N
ORIHIKOT
AKEUCHISummary
Passengers, as one of the consumers of airport services, play a vital role in the development and success of airports around the world. In the age of globalization, most individuals have undoubtedly traveled internationally before, most likely through an airport gateway in reaching their destination. Many of these destinations nowadays feature airport systems, or multiple airports serving the same metropolitan area. Often, these airport systems are regulated by the government or some other entity that prevent the intensification of competition in order to allow the different airports to flourish. However, the recent deregulations in these controls have allowed airports within airport systems to openly compete with each other.
This study is aimed at analyzing the various factors that passengers consider when they are selecting an airport within an airport system. For example, these factors may include overall impressions and perceptions about airports, personal ratings of airport facilities and services, opinions about flight availability and so forth. In specific, this study will utilize airport systems in three major airport systems within Northeast Asia: Tokyo, Taipei, and Seoul. These airport systems contain airports that are often highly ranked in the world, experience large passenger and aircraft traffic, and are widely used by international travelers. Furthermore, these airport systems provide a sampling that could tentatively be used as insight into other airport systems around the world.
This study is structured into four major sections. The first section introduces the topic of airport systems and passenger choice, as well as describes the purpose and motivations behind the study. The second section describes the background and history of airport systems, focusing on the specific airports that are compared in this study. These include Narita International Airport (Tokyo), Haneda International Airport (Tokyo), Taoyuan International Airport (Taipei), Songshan International Airport (Taipei), Incheon International Airport (Seoul), and Gimpo International Airport (Seoul). The third section summarizes the results obtained from survey respondents and presents the data analysis. The fourth section reviews the findings of the study and also suggests various directions of future research.
A survey was developed and distributed to a wide variety of respondents, with responses collected over a period of two weeks. The survey was designed in four sections. The first section asked respondents background questions regarding overall preferences regarding airport factors as well as their preference of airports within airport systems. The second section asked respondents specific questions about each of the six airports, with the respondent skipping questions for airports that they have not visited before. The third section asked respondents about airport comparison questions. The final section asked respondents demographics-related questions. In all, 101 responses were collected from respondents.
From the results of the survey, respondents have shown that the most important factor for airport choice is airfares. It seems that regardless of how highly respondents rate an airport or what their overall impressions of an airport are, respondents tend to react more to the cost of the airfares when choosing an airport within an airport system. Overall, a majority of passengers also tend to choose to travel through primary airports more than through secondary airports when traveling, though the percentage of passengers choosing primary airports drops slightly when respondents were asked to name the preferred airport they would use, rather than the actual airport they use. This realization further supports the case that airport choice is strongly correlated with the cost of airfares, at least with the leisure travelers that formed the bulk of the survey respondents in this study.
Airports, airlines, and passengers may all benefit from the contributions of this study to the aviation industry. Airports may study how passengers generally perceive different aspects of airports,
allowing airports to develop strategies and innovate in order to become more competitive. Airlines, on the other hand, may use the results of this study to determine a gauge for how passengers respond to the airports that that airlines choose to fly through. Using this gauge, airlines may be able to better plan and develop route choices that optimize the satisfaction of the passengers while fulfilling other factors that airlines consider while planning routes. Finally, passengers may benefit from understanding how their peers view the airports and also gain a better knowledge of the different aspects of the airport. As a result, passengers may be better informed when making the selection of which airports to travel through, especially when faced with a choice of airports in an airport system.
<Inside Cover>
D ETERMINING THE F ACTORS FOR P ASSENGERS ’ A IRPORT C HOICE W ITHIN N ORTHEAST A SIAN
A IRPORT S YSTEMS
A Focus on the Northeast Asian Aviation Circle
35132335-0 B ENJAMIN L IU
G LOBALIZATION AND B USINESS L EADERSHIP
C.E.
R
EIJIO
HTAKID.E.
H
IRONORIH
IGASHIDE D.E.N
ORIHIKOT
AKEUCHITable of Contents
LIST OF FIGURES AND TABLES ... 3
CHAPTER 1. THESIS MOTIVATION AND EXPLANATIONS... 4
SECTION 1. BACKGROUND ... 4
SECTION 2. RESEARCH MOTIVATION AND RATIONALE ... 5
SECTION 3. SCOPES AND LIMITATIONS ... 5
SECTION 4. INTERESTED PARTIES ... 7
SECTION 5. DEFINING TERMINOLOGIES ... 8
SECTION 6. HYPOTHESES ... 8
CHAPTER 2. AIRPORT AND AIRPORT SYSTEMS ... 10
SECTION 1. DEVELOPMENT OF AIRPORT AND AIRPORT SYSTEMS ... 10
2.1.1. Defining an Airport ... 10
2.1.2. Evolution of the Airport ... 12
2.1.3. Emergence of Airport Systems ... 14
SECTION 2. ASIAN AIRPORT CIRCUMSTANCES ... 15
SECTION 3. TOKYO AIRPORT SYSTEM ... 18
2.3.1. History of the Tokyo Airports ... 18
2.3.2. Narita International Airport (NRT) ... 19
2.3.3. Haneda International Airport (HND) ... 21
SECTION 4. TAIPEI AIRPORT SYSTEM ... 22
2.4.1. History of the Taipei Airports ... 22
2.4.2. Taoyuan International Airport (TPE) ... 23
2.4.3. Songshan International Airport (TSA) ... 24
SECTION 5. SEOUL AIRPORT SYSTEM ... 26
2.5.1. History of the Seoul Airports ... 26
2.5.2. Incheon International Airport (ICN) ... 26
2.5.3. Gimpo International Airport (GMP) ... 27
SECTION 6. RELATED LITERATURE REVIEW ... 28
2.6.1. Selection of Data Type ... 28
2.6.2. Use of SP Data and Introduction to Nested Logit Models ... 30
2.6.3. Direct Survey Analysis for Passengers’ Airport Satisfaction ... 31
2.6.4. Performance Evaluation for Airports ... 32
CHAPTER 3. RESEARCH AND DATA ANALYSIS ... 35
SECTION 1. SURVEY BACKGROUND ... 35
3.1.1. Respondents ... 35
3.1.2. Survey Questions Overview ... 37
SECTION 2. DATA ANALYSIS ... 38
3.2.1. Background Section ... 38
3.2.2. Airport Ground Access, Facilities, Services, Procedures, and Flights ... 43
3.2.3. Airport System and Integrated Hub Airport Comparisons ... 47
CHAPTER 4. CONCLUSION ... 51
SECTION 1. HYPOTHESIS REVISITED ... 51
SECTION 2. CONCLUSION ON AIRPORT SYSTEMS ... 53
SECTION 3. RECOMMENDATIONS FOR FUTURE RESEARCH ... 55
SECTION 4. FINAL WORDS ... 56
REFERENCES ... 58 APPENDIX 1. T-TEST RESULTS FOR BACKGROUND SECTION OF SURVEY RESPONSE ... 63 APPENDIX 2. T-TEST RESULTS FOR AIRPORTS SECTION OF SURVEY
RESPONSE ... 64 APPENDIX 3. DISTRIBUTED SURVEY ... 65
LIST OF FIGURES AND TABLES
Figure 1: The Airport System (Ashford, 1997) ... 11
Figure 2: Main Choice Processes of an Outbound Air Journey (Hess, 2010) ... 29
Figure 3: Percent Composition of Visitors by Age to Travel Sites Globally (ComScore, 2011) ... 36
Figure 4: Number and Percent of Respondents that Travel Through Each City’s Airport ... 39
Figure 5: Number of Percent of Respondents that Prefer to Travel Through Each City’s Airport... 39
Figure 6: Rating of Overall Impression Regarding Airports ... 40
Figure 7: Respondents’ Most Important Priority When Considering Airports ... 42
Figure 8: Respondents’ Least Important Priority When Considering Airports ... 43
Figure 9: Number of Responses to the Statement “You would prefer to fly through cities with airport systems rather than into cities with an integrated airport hub” ... 48
Figure 10: Number of Responses to the Statement “Airport systems offer more choices in terms of routes to choose from” ... 49
Figure 11: Number of Responses to the Statement “Airport systems offer a better chance of having an airport conveniently located to you” ... 50
Table 1: Examples of Different Types of Full or Partial Airport Privatizations (Graham, 2011) ... 13
Table 2: Frequency of Observation of Mechanisms Governing the Evolution of Multi-Airport Systems Across World-Regions (Bonnefoy, 2008) ... 15
Table 3: Basic Statistics of Selected Cities (Di, 2013) ... 16
Table 4: The World's Top 100 Airports - 2015 (Skytrax, 2015) ... 17
Table 5: Miscellaneous Skytrax Rankings (Skytrax, 2015) ... 17
Table 6: Airport Connections to Worldwide Cities (Narita International Airport Corporation, 2014; Japan Airport Terminal Co., Ltd., 2015; Taoyuan Airport Corporation, 2014; Taipei International Airport, 2014; Incheon International Airport Corporation, 2014 and 2015; “Flight Schedule”, 2015) ... 18
Table 7: Narita Terminal Information (Narita International Airport Corporation, 2014) ... 19
Table 8: Haneda International Terminal Data (Editorial Board Member, 2011) ... 21
Table 9: Taoyuan Airport Terminal Information (Taoyuan Airport Corporation, 2014) ... 24
Table 10: Songshan Airport Terminal Information (Taipei International Airport, 2014; Staff Writer, 2010; China Post News Staff, 2011) ... 25
Table 11: Incheon Airport Terminal Information (Rahn, 2008 and 2009; “Incheon International Airport”, 2015) ... 27
Table 12: Top 5 Reasons for Airport Choice by Leisure Passengers at the Four Major London Airports (Civil Aviation Authority, 2011) ... 31
Table 13: Final Evaluation Criteria of Airport Operating Performance (Chang, 2003) ... 33
Table 14: Results of Chang's Research (Chang, 2003) ... 34
Table 15: Demographics of Survey Respondents ... 35
Table 16: Breakdown of Travel Purposes by Respondents ... 37
Table 17: Respondents’ Results of Ground Access and Airport Ratings... 44
CHAPTER 1. THESIS MOTIVATION AND EXPLANATIONS
Section 1. B
ACKGROUNDThroughout the latter half of the 20th century and well into the current 21st century, globalization and the expanding interconnections between regions around the world has necessitated the growth and expansion of airports as a means of linking these regions. Airports are seen not only as a transportation hub and a gateway to the outside world for cities, but also as a catalyst for the regional economy. However, airports sometimes outgrow their capabilities to expand beyond their originally intended capacity, which thus necessitates the construction of alternate airports close to the city.
In East Asia, this has become a popular trend as older, outdated airports have outlived their use and are often replaced with modernized airports designed specifically for an increased amount of passenger and aircraft traffic. However, in some cities, such as Tokyo, Taipei and Seoul, the older airports have been retained and have often been modernized gradually in such a way that these older airports often serve as a secondary airport to the newly built primary airport, effectively creating a market competition between airports. Initially, governments may induce regulations on these airport systems to control competition and shift specific types of traffic to different airports. However, recent deregulations in the airport systems have intensified the competition between airports within airport systems.
Furthermore, current trends in the growth of the Asian economies have indicated that there is great importance in the development of gateways into this region. These trends demonstrate the importance of the airports in these airport systems scattered around East Asia. However, the presence of multiple airports lends itself to natural competition between the various different airports within regional boundaries. In essence, rival airports must be able to effectively compete with each other and attract enough customers to be able to generate profits and succeed. An excellent representation of the situation that the airport is in deCoat’s quote: ““First, customers are more demanding…to them the airport is the airport. They demand that someone take control to provide good and seamless
service regardless of who the service provider is.” (deCoat, 2011). The passengers are the key to determining the success or failure of each airport.
Section 2. R
ESEARCHM
OTIVATION ANDR
ATIONALEThis thesis dives into the degree of success different airports in the “Northeast Asia Golden Aviation Circle” (Shan, 2011) have had in attracting passengers to selecting their airport rather than rival airports in the region. As will be described in a later section, there have been numerous past researches on airport competition, but these researches focus primarily on airport-airline relationships, rather than on airport-passenger relationships. Furthermore, much of what has been done on airport competition has focused on the airport systems in the San Francisco Bay Area or in the Greater London Area. In contrast to previous researches, this thesis intends to focus on the Tokyo Area (Narita and Haneda), Taipei Area (Taoyuan and Songshan), and Seoul Area (Incheon and Gimpo).
Passenger choice between competing airports in these three regions in Northeast Asia is particularly interesting because of the various factors, not only access time and airfare considerations, that go into the selection of an airport as a departure or arrival point. Furthermore, as these three regions are expected to grow in importance in tandem with the rise of the Asian economies, the degree of success that these airports have in attracting passengers to their airports can determine what role that airport will play in its corresponding Northeast Asian city. Furthermore, this topic is of particular interest to the author as the author has flown multiple times through several of these cities in the past, utilizing the different airports available in the different cities. However, interrelationships between the airports have become more dynamic as secondary airports grow in importance, which stimulated the author into pursuing an increased understanding of the factors that various people consider when choosing airports.
Section 3. S
COPES ANDL
IMITATIONSThis thesis researches into the factors that influence a passenger’s choice in a specific airport
out of multiple airports in each of the included Northeast Asian airport system. This thesis will focus its attention primarily on factors that the passenger has direct interactions with, particularly from the time the passenger leaves home to the moment of departure from the airport by plane (or conversely, from the moment of arrival at the airport by plane to the moment the passenger arrives at home).
Essentially, this thesis will be evaluating an airport’s value chain in context of the passenger’s point of view. As such, the researched area will include topics such as airport access, airport facilities and service, air travel offerings, security and immigration processing, etc. Because of the primary focus on the passenger’s choice in airport, areas related to the airports’ relationships with government, airlines or other entities will not be considered as primary focal points as these relationships often are not foremost in the passenger’s logical thinking process during the airport selection process.
Furthermore, much research has already been previously performed on several of these other areas, which allows the author to focus on new, unexplored areas related to airport competition.
While the Northeast Asia Golden Aviation Circle is used as the initial basis for selecting airport systems to investigate, it should be noted that only three of the four systems in the Circle were selected. The Northeast Asia Golden Aviation Circle comprises of Tokyo, Taipei, Seoul and Shanghai (Shan, 2011). However, due to the limitation on information that could be acquired relating to the Shanghai airports (Pudong International Airport and Hongqiao International Airport), Shanghai was excluded from the research and analysis within this thesis.
Furthermore, due to the constraints in resources, the research survey undertaken constitutes a convenience sample. This method of sampling centers around the collection of data from a population that is conveniently available for participating in the survey. While this method of sampling is effective in its simplicity, ability to be facilitated in a short duration of time, as well as cost effectiveness, it may be more vulnerable to selection bias (“Convenience Sampling”, 2015).
While it may be difficult to effectively represent the results of this thesis as representative for all of the passengers that may travel through the airports in Tokyo, Taipei, and Seoul, this thesis does represent the opinions of a portion of the passenger traffic at these airports.
As a final note on limitations, this study was conducted primarily on English-based resources
available to the author. Therefore, although there may be studies and resources available pertaining to the relevant airport systems in Northeast Asia, they may not have been found or used because they were available only in a non-English language. However, the survey conducted as part of this study was available in both English and Japanese, so data was collected from a wider respondent range than could be possible with a survey conducted only in English. It must be noted that the survey was translated by non-native Japanese speakers, so some of the translations may be slightly confusing in Japanese.
Section 4. I
NTERESTEDP
ARTIESAn increasing number of people are utilizing air travel as a means of transportation to reach their destinations, which implies the importance that airports mostly likely place on being able to attract not only air carriers, but also passengers to their airports, particularly in regions with multiple airports. Therefore, the results of the study should be of particular interest to airports involved in airport systems, especially those in Northeast Asia, which is the focus of this study. These airports can better understand and connect their efforts in improving their airport. By doing so, they can improve passengers’ perception of the airport as well as the airport’s likelihood of being selected as a point of departure or arrival. Passengers themselves may also be interested in the results of the survey so as to understand overall perceptions and preferences of other passengers utilizing the different airports in the Northeast Asian region, as well as to possibly use the study results as a gauge for understanding the value of traveling through each airport, which may influence their subsequent choice in airport. Finally, the results of the survey may appeal to air carriers as the study may help them understand how effectively different airports are operating and how efficiently the airports are competing with one another to gain passenger traffic. Air carriers may be primarily interested in extending or expanding routes into more competitive airports as a means of capitalizing on the increased passenger traffic.
Section 5. D
EFININGT
ERMINOLOGIESFor the purpose of this research and to differentiate the two airports in each airport system, the terms “primary airport” and “secondary airport” will be defined as such:
Primary airport – the international airport in an airport system with the higher international passenger traffic
Secondary airport – the international airport in an airport system with the lower international passenger traffic
In accordance to this definition, primary airports are Narita, Taoyuan and Incheon Airports while secondary airports are Haneda, Songshan and Gimpo Airports. It is interesting to note that the three secondary airports in the current study were once the main international airports in their respective city but were relegated to a secondary role once the new primary international airports were opened.
Section 6. H
YPOTHESESIn order to focus the important aspects of passenger choice in airport competition within specific Northeast Asian cities, a set of hypotheses was developed that pinpointed various aspects of passenger choice in airports that may have a significant impact on a passenger’s final choice. While the ultimate goal of this study is to answer these hypotheses in view of all three surveyed airport systems, this study will first attempt to apply these hypotheses separately to each of the airport systems to determine if there are also any regional differences between the three systems. It may be noted that the hypotheses focus on three specific parts of the airports, namely airport access, airport facilities and services, and air travel offerings.
1. Travelers prefer to use secondary airports because of their ease of access from the city center.
2. Travelers prefer the airport that has better facilities (i.e., shopping, restaurants, services, etc.) within an airport system.
3. Travelers have a better impression of primary airports compared to their corresponding secondary airport.
4. Travelers prefer to travel into cities with airport systems rather than into cities with an integrated airport hub.
5. Airport procedures (i.e., check-in, security, immigration, baggage retrieval, customs, etc.) and airport procedures time at each airport are not an important determinants for travelers in choosing between airports.
6. Airfare is an important determinant in choosing between airports for travelers.
7. Available flight times is an important factor for travelers deciding between airports.
CHAPTER 2. AIRPORT AND AIRPORT SYSTEMS
Section 1. D
EVELOPMENT OFA
IRPORT ANDA
IRPORTS
YSTEMS2.1.1. Defining an Airport
In terms of simple definition, an airport is “a complex of runways and buildings for the take-off, landing, and maintenance of civil aircraft, with facilities for passengers” (“Airport”, 2015).
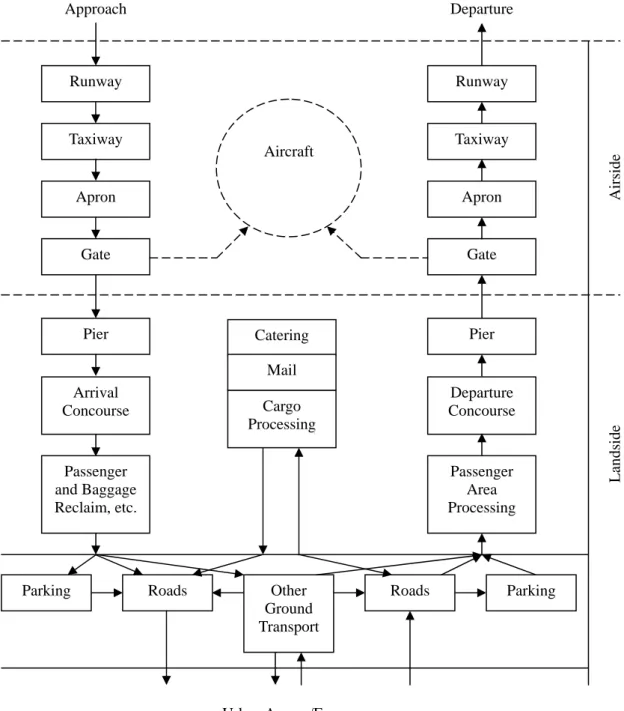
However, airports play a much larger role than just what is listed as a definition. The function of an airport is to provide a location that allows for passengers to transition from local ground transportation to an aerial transportation and vice versa. More specifically, it allows for a change of mode between ground and aerial transportations, processing such as ticketing and control of passengers/luggage, and change of movement type based on a schedule (Ashford, 1997). Airports can be thought of as divided into two parts: landside and airside (shown in Figure 1). Passengers often cross between the two sides, which indicates that airports have to make the transfer as smooth as possible.
Although small to medium sized airports with low passenger traffic can be run very similarly in complexity to railroad or bus stations, medium to large sized airports with a significant amount of passenger traffic require much more organization and planning in order to manage the large complexity involved in such an airport. Some examples of what an airport has to manage include the following (Ashford, 1997):
Handling of passengers
Servicing, maintenance, and engineering of aircraft
Airline operations including aircrew, cabin attendants, ground crew, terminal and office staffs
Businesses necessary for the economic stability of the airport (concessions, leasing companies, etc.)
Aviation support facilities (air traffic control, meteorology, etc.)
Government functions – agricultural inspection, customs, immigration, health
Figure 1: The Airport System (Ashford, 1997)
In addition to being divided between airside and landside, airports can also be divided based on the hardware and software. In this instance, “hardware” can be considered as the facilities and
Approach Departure
Catering Mail Cargo Processing Pier
Arrival Concourse
Passenger and Baggage Reclaim, etc.
Pier
Departure Concourse
Passenger Area Processing Aircraft
Runway
Taxiway
Apron
Gate
Runway
Taxiway
Apron
Gate
Other Ground Transport
Parking Roads Roads Parking
Urban Access/Egress
Airside Landside
equipment that is offered by the airport while the “software” can be considered as the services offered by airport or the airport staff. For example, hardware may include facilities, such as duty-free stores, restaurants, airline lounges, public seating areas, prayer rooms or silence rooms, smoking areas, restrooms, and signage and information. On the other hand, software may include the information desk, roaming service agent or staff, self check-in kiosks, flight information monitors, digital applications (e.g., smartphone applications), and luggage services. In order to maintain competitiveness, airports often have to continuously update and innovate on their offerings to the passengers.
2.1.2. Evolution of the Airport
Around a century ago, the first commercial airports began to be established in various countries around the world. At first, these airports were nothing more than just grass fields offering a place for aircrafts to take-off and land. However, airports eventually developed the facilities, services, and operational procedures to handle larger aircrafts through the years. Now the role of airport managers has “changed from the purveyor of infrastructure to the dominant manger over the process of getting people and goods out of land vehicles into air vehicles” (deCota, 2011).
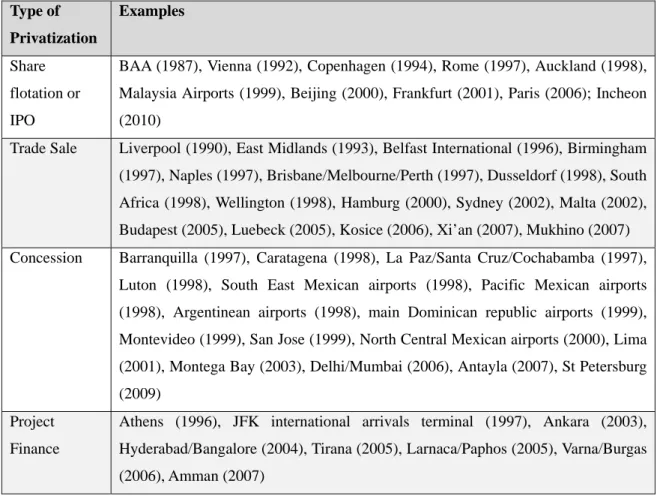
In the beginning, airports and airlines were often established by a government or with the support of a government, resulting in a regulated aviation industry. During the latter half of the 20th century, this situation began to change as governments began to privatize their aviation assets, as seen in some examples provided in Table 1. Through the act of privatizing airports, the government has allowed airports to begin operating freely in the market economy, ideally making these airports more responsive to market forces. As a result, airports have had to become more competitive in order to survive under the new unregulated circumstances. This has had a particularly dramatic effect in areas with airport systems where the government regulated flight routes in airports among co-existing airports. For example, Tokyo’s airport system was managed in such a way that international routes were flown primarily into Narita International Airport while domestic routes were flown primarily into Haneda International Airport. With the deregulation of the aviation industry, these airports were no longer controlled by a central entity but were free to determine their
own portfolio of flights, leading to inter-airport competition for lucrative flights. In Tokyo’s case, Haneda International Airport began to bid for international routes, thus encroaching upon a market previously monopolized by Narita International Airport.
Type of Privatization
Examples
Share flotation or IPO
BAA (1987), Vienna (1992), Copenhagen (1994), Rome (1997), Auckland (1998), Malaysia Airports (1999), Beijing (2000), Frankfurt (2001), Paris (2006); Incheon (2010)
Trade Sale Liverpool (1990), East Midlands (1993), Belfast International (1996), Birmingham (1997), Naples (1997), Brisbane/Melbourne/Perth (1997), Dusseldorf (1998), South Africa (1998), Wellington (1998), Hamburg (2000), Sydney (2002), Malta (2002), Budapest (2005), Luebeck (2005), Kosice (2006), Xi’an (2007), Mukhino (2007) Concession Barranquilla (1997), Caratagena (1998), La Paz/Santa Cruz/Cochabamba (1997),
Luton (1998), South East Mexican airports (1998), Pacific Mexican airports (1998), Argentinean airports (1998), main Dominican republic airports (1999), Montevideo (1999), San Jose (1999), North Central Mexican airports (2000), Lima (2001), Montega Bay (2003), Delhi/Mumbai (2006), Antayla (2007), St Petersburg (2009)
Project Finance
Athens (1996), JFK international arrivals terminal (1997), Ankara (2003), Hyderabad/Bangalore (2004), Tirana (2005), Larnaca/Paphos (2005), Varna/Burgas (2006), Amman (2007)
Table 1: Examples of Different Types of Full or Partial Airport Privatizations (Graham, 2011)
Deregulation has also forced airports to innovate product offerings that are provided to both airlines and passengers. In particular, airports have had to focus on service quality in order to attract passengers, many of whom are used to airports with increasingly better service offerings.
Furthermore, in an effort to enhance their visibility among passengers, airports have also differentiated their product offerings to cater to the diverse needs of these passengers. While in the past, differentiation may be confined primarily to improved check-in, waiting, and lounge areas, recent airport innovations are beginning to spread into a series of technological enhancements. These
enhancements include not only passenger-facing improvements such as self check-in kiosks and smartphone applications, but also in processing improvements such as check-in procedures, security, and border control.
2.1.3. Emergence of Airport Systems
Airport systems that include more than one airport began to emerge in large population centers around the world in response to primarily capacity constraints in existing airports. In other words, when older airports approach or surpass their designed traffic capacity, the government often develops plans to either expand the existing airport or build a completely new airport to relieve traffic at the original airport or take over operations completely. In his study, Bonnefoy identifies 59 airport systems around the world at the time of his research, with 25 in Europe, 18 in North America, 8 in Asia-Pacific, 5 in Latin America, and 3 in the Middle East (Bonnefoy, 2008). More specifically, the eight airport systems in Asia-Pacific include Tokyo, Osaka, Shanghai, Hong Kong, Taipei, Seoul, Bangkok and Melbourne. Many of the airport systems in existence came about through one of two methods: 1) an existing small airfield was converted or gained enough traffic to become a full-fledged airport, or 2) a new airport was constructed with partial or total transfer of traffic to the new airport. In cases of total transfer of traffic, such as in Denver and Oslo, the original airport was closed (Bonnefoy, 2008). However, in cases of partial transfer of traffic, such as in Tokyo and Seoul, the original airport was demoted to a secondary airport status while the new airport was assigned as the primary airport and gained a majority of the international traffic.
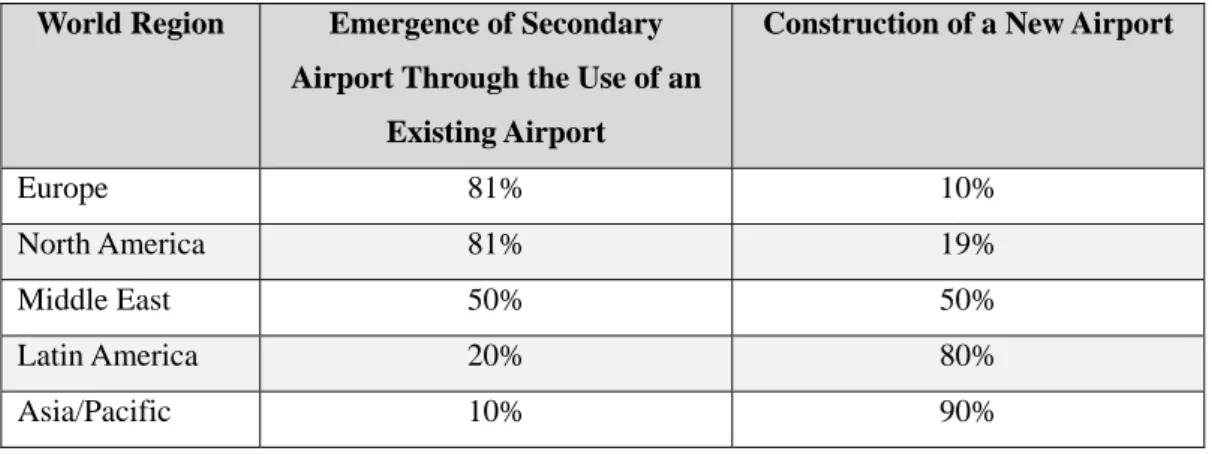
Bonnefoy further identified three primary factors influencing the evolution of these airport systems: “(1) the availability of existing airport infrastructure, (2) the entry of low-cost carriers at under-utilized airports and (3) regulatory and political factors” (Bonnefoy, 2008). Europe and North America both have high numbers of existing airfields within proximity of large population centers, which meant that these centers had existing infrastructure that could be easily adapted or expanded into full airports. In contrast, the Asia-Pacific and Latin America regions had few existing infrastructures, which led to the necessity of building a completely new airport to serve the city center. This difference is obvious in Table 2, where 50% or more airport systems in the Middle East,
Latin America, and Asia-Pacific consisted of a newly constructed airport.
World Region Emergence of Secondary Airport Through the Use of an
Existing Airport
Construction of a New Airport
Europe 81% 10%
North America 81% 19%
Middle East 50% 50%
Latin America 20% 80%
Asia/Pacific 10% 90%
Table 2: Frequency of Observation of Mechanisms Governing the Evolution of Multi-Airport Systems Across World-Regions (Bonnefoy, 2008)
Airport systems are also stimulated when low-cost carriers (LCCs) enter an under-utilized airport, thus stimulating the market at the airport and also attracting other carriers to fly routes into that airport. This phenomenon is known as the “Southwest effect”, a term coined from Southwest Airlines’ role of developing the emergence of numerous smaller airports in the United States.
The final factor, one which is perhaps most pertinent to the Northeast Asian airport systems, is the regulatory and political factors surrounding the construction of new airports. In a few cases, the older airport may be closed completely. However, in all three of the cases studied in this thesis, the government ordered the construction of a new airport away from the city center and generally forced airlines to switch to the new airport, keeping the older airport open for a limited number of domestic traffic. This situation was originally intended to keep airports within airport systems from direct competition; however, deregulation has created a new environment in which these airports may now directly compete with one another.
Section 2. A
SIANA
IRPORTC
IRCUMSTANCESAsia is an interesting region to focus on the development of airports and airport systems because of the rapid growth experienced in the region. Not only is Asia the leading region in aviation
traffic (30% of the world’s revenue passenger kilometers), but it is home to 41% of the world’s middle class (Clayton, 2014). Furthermore, the liberalization of Asian economies coupled with the lifting of travel restriction has provided ripe circumstances for the surge in air traffic in the Asian region during the recent decades. To cope with the already overburdening capacity strains, Asian cities have looked into many ways of expanding capacity to meet expected future demands. One of these ways is to construct multiple airports near a city, thus creating an airport system. According to Clayton, airport systems are capable of “delivering airport infrastructure that is cost-effective and efficient…providing airport accessibility to a larger percentage of the population…[and] improving the quality of travel and reducing congestion and delays” (Clayton, 2014).
City
Metropolitan Area Main City Area
Population (Thousands)
Area (km2)
Density (Persons/km2)
Population (Thousands)
Area (km2)
Density (Persons/km2)
Beijing 20,186 16,411 1,230 12,014 1,368 8,780
Berlin 3,502 892 3,927 3,502 892 3,927
London 8,302 1,572 5,281 8,302 1,572 5,281
Seoul 10,442 605 17,254 10,442 605 17,254
Taipei 2,673 272 9,835 2,673 272 9,835
Tokyo 13,277 2,189 6,066 9,050 622 14,550
Washington
DC 3,720 2,460 1,512 632 159 3,976
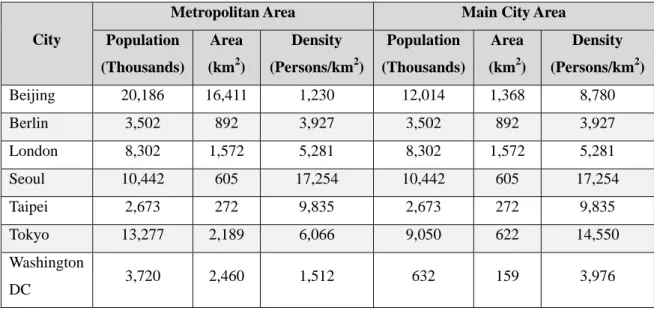
Table 3: Basic Statistics of Selected Cities (Di, 2013)
As can be seen in Table 3, the three selected Asian cities offer unique locations for this study because of their large population size and/or density compared to many other capitals in the world.
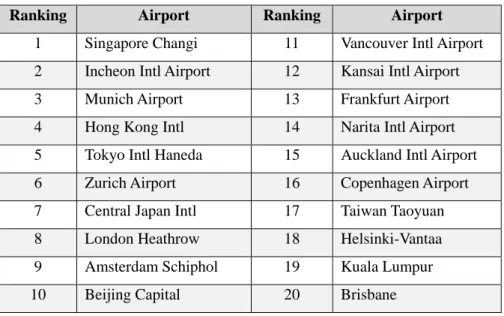
Furthermore, while the other capital cities listed also have airport systems, they serve either a smaller population or a city center that is less dense than that of the three selected Asian cities. In addition, the three Asian cities selected also have several airports listed among the “World’s Top 100 Airports” in 2015, according to the Skytrax ranking as shown in Table 4.
Ranking Airport Ranking Airport 1 Singapore Changi 11 Vancouver Intl Airport 2 Incheon Intl Airport 12 Kansai Intl Airport
3 Munich Airport 13 Frankfurt Airport
4 Hong Kong Intl 14 Narita Intl Airport 5 Tokyo Intl Haneda 15 Auckland Intl Airport
6 Zurich Airport 16 Copenhagen Airport
7 Central Japan Intl 17 Taiwan Taoyuan
8 London Heathrow 18 Helsinki-Vantaa
9 Amsterdam Schiphol 19 Kuala Lumpur
10 Beijing Capital 20 Brisbane
*Gimpo Intl Airport is ranked 41 in this list
Table 4: The World's Top 100 Airports - 2015 (Skytrax, 2015)
Another interesting point to note is that the airports in the three selected Asian cities also rank within the top 10 of many other Skytrax rankings, as shown in Table 5.
Cleanest Airport
Best Airport Shopping
Best Airport
Dining
Best Airport Immigrat
ion
Best Airport Security
Best Baggage Delivery
Best Airport Leisure Amenities
Narita 6 9 9 3 10 6
Haneda 2 10 5 1 6 7
Taoyuan
9 2 4 4 8 Songshan
Incheon 1 6 4 7 5 2
Gimpo
Table 5: Miscellaneous Skytrax Rankings (Skytrax, 2015)
Finally, a comparison of the scale of operation at each airport can be seen in Table 6. This
table shows the number of domestic and international routes that are flown into and out of each airport as of June 2015, as well as the number of airlines that use the airport.
Number of Airlines
Number of Domestic Destinations
Number of International Destinations
Narita 84 17 101
Haneda 33 61 27
Taoyuan 71 0 161
Songshan 15 7 15
Incheon 88 2 182
Gimpo 14 6 6
Table 6: Airport Connections to Worldwide Cities (Narita International Airport Corporation, 2014; Japan Airport Terminal Co., Ltd., 2015; Taoyuan Airport Corporation, 2014; Taipei International Airport, 2014; Incheon International Airport Corporation, 2014 and 2015; “Flight
Schedule”, 2015)
Section 3. T
OKYOA
IRPORTS
YSTEM2.3.1. History of the Tokyo Airports
The Tokyo airport system consists of three airports: Narita, Haneda, and Ibaraki. However, Ibaraki Airport only serves a limited amount of flights and so will not be included in the scope of this study. Haneda Airport is located within the Tokyo city boundaries, at the mouth of the Tamagawa River relatively 15 kilometers away from Tokyo Station. Because it is surrounded by land on three sides and Tokyo Bay on the fourth side, expansion at Haneda Airport has been difficult but possible through land reclamation that has occurred throughout the decades. In order to relieve the strains in capacity at Haneda Airport, the Japanese government ordered the construction of Narita Airport in Chiba Prefecture, about 60 kilometers away from Tokyo Station. Because of opposition by local residents, conflicts resulted in continuous delays in opening parts of the airport, including a 24 years delay in the opening of the second runway. With the opening of Narita Airport, most
international flights into Tokyo were shifted from Haneda Airport to the new Narita Airport.
However, conflicts continued until the 2000s, when further expansion was possible with the building of new terminals at the airport and runway extensions. This recent expansion has occurred concurrently with the expansion at Haneda Airport into becoming a full-fledged international airport again (Yamaguchi, 2013). Overall competition has increased between the two Tokyo airports, especially since 2011 with the capacity expansion at both airports, internationalization of Haneda Airport, and launch of Open Skies Agreements at Narita Airport (Kurono, 2012)
2.3.2. Narita International Airport (NRT)
Located in Narita, Chiba Prefecture, Narita Airport is the primary international airport serving the Tokyo Metropolitan region. It takes approximately 36 minutes to reach the airport by the Keisei Skyliner route and an hour by other methods of transportation, with up to 12 trains per hour when combining JR and Keisei rail services (Narita International Airport Corporation, 2014).
However, Narita Airport offers connections to many major city centers around the world and has served as a major transit hub for trans-Pacific flights during the last few decades. The airport itself consists of three terminals, including a newly built LCC terminal, with service by over 55 airlines.
More specific information about each of Narita Airport’s terminals can be seen in Table 7.
Terminal 1 Terminal 2 Terminal 3*
Commission Date May 20, 1978 December 6, 1992 April 8, 2015 Total Floor Space 455,000 m2 405,900 m2 around 66,000 m2 Passenger Handling
Capacity 25 million 17 million 7.5 million
Number of Contact
Gates 34 28 around 14
* Information regarding Terminal 3 is tentative as it was not opened at the time of the publishing of Narita International Airport’s annual report
Table 7: Narita Terminal Information (Narita International Airport Corporation, 2014)
Narita Airport is currently undergoing a 3-year plan that has been dubbed “Innovative Narita 2015” that is aimed at improving Narita Airport’s competitiveness. This plan focuses around three core strategies: endless pursuit of safety, creating an airport of popular choice, and building corporate strength (Narita International Airport Corporation, 2014). Of particular interest to passengers traveling through Narita Airport is the second goal within Innovative Narita 2015. Narita Airport is striving to improve the airport as a popular choice among passengers through four sub-focus areas: user-friendly airport, lower airport costs, improved comfort and convenience, and contribution to the local community.
With the expansion of the airport through construction of additional parking spots and also with the construction of Terminal 3 (a dedicated LCC terminal), Narita Airport is aiming to upgrade its international network of mid- and long-haul routes as well as to increase short-haul Asian routes.
This would provide passengers with an even greater number of route choices to select from when planning trips. Furthermore, the original Terminals 1 and 2 are being refurbished and renovated in order to improve the comfort and ambience that passengers experience in these terminals.
However, much of the improvements for passengers traveling through Narita Airport may come from the various technological interfaces improvements and retail expansions that the airport has implemented. For example, there are now non-stop security gates at the entrances to the airport that will both improve security and remove the troublesome security checks that were once present at the airport. Wi-Fi areas have also been expanded and upgraded to provide visitors with more comprehensive Internet coverage. Finally, the airport has also been progressing in its “i-Airport”
strategies, which have included releasing hospitality applications, augmented reality applications, and multilingual audio translation applications, as well as introducing video phone services and roving information agents (Narita International Airport Corporation, 2014). Narita Airport has also strived to expand and improve shopping areas within the three terminals to provide passengers with a greater selection of duty-free shopping. In addition, Narita Airport has opened a new capsule hotel for passengers requiring the usage of overnight accommodation for taking early morning flights.
2.3.3. Haneda International Airport (HND)
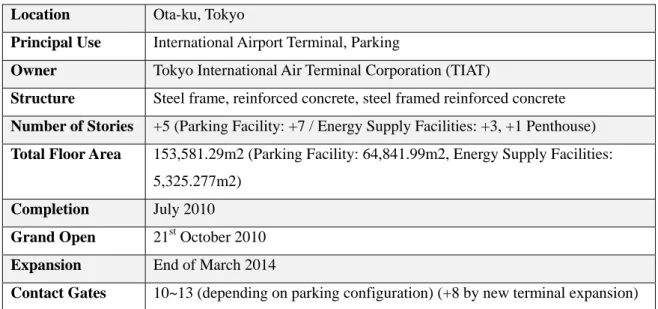
Located in Ota Ward within the Tokyo city boundaries and also within 16 kilometers of Tokyo Station, Haneda Airport is conveniently located in the city for many of the city’s residents. It serves as the primary base for both of Japan’s major airlines, Japan Airlines and All Nippon Airways, each of which runs out of separate terminals at the airport. Although Haneda Airport used to be Tokyo’s primary international airport, it was relegated into a primarily domestic airport with the opening of Narita Airport in 1978. However, Haneda Airport has been expanding recently and has recaptured some of international routes such that it is effectively an international airport once again.
The opening of an international terminal in 2010 has also bolstered its abilities to accept international flights, as has the opening of an additional runway built into Tokyo Bay.
Location Ota-ku, Tokyo
Principal Use International Airport Terminal, Parking
Owner Tokyo International Air Terminal Corporation (TIAT)
Structure Steel frame, reinforced concrete, steel framed reinforced concrete Number of Stories +5 (Parking Facility: +7 / Energy Supply Facilities: +3, +1 Penthouse) Total Floor Area 153,581.29m2 (Parking Facility: 64,841.99m2, Energy Supply Facilities:
5,325.277m2) Completion July 2010 Grand Open 21st October 2010 Expansion End of March 2014
Contact Gates 10~13 (depending on parking configuration) (+8 by new terminal expansion)
* Information regarding the recent International Terminal expansion at Haneda Airport is tentative as little information has been released about the new expansion at the time of this study
Table 8: Haneda International Terminal Data (Editorial Board Member, 2011)
Although Haneda Airport consists of two domestic terminals, the airport’s new international terminal has made Haneda Airport a competitive force in the Northeast Asian aviation market, providing Haneda with a mean to effectively compete with other international airports. To attract
passengers, the terminal itself was designed to invoke the concept of sky and cloud within the departure lobby, while emphasizing the importance of “expression to the spatial sensibility, delicacy and human scale that are distinctive to Japan…[hoping] people will get a sense of the Japanese culture of hospitality” (Editorial Board Member, 2011). Basic information regarding the international terminal is shown in Table 8.
In recent years, Haneda Airport has striven to improve its offerings to passengers traveling through its airports. As seen in the airport’s annual report, Haneda Airport has focused its efforts into expanding operations of duty-free shops, extending the international passenger terminal, and opening the “Royal Park Hotel THE Haneda” adjacent to the international passenger terminal (Japan Airport Terminal Co., Ltd., 2015). The airport hopes that these improvements would better help serve the passengers’ needs during their travels through the airport. Furthermore, Haneda Airport is looking into improving passenger convenience by establishing a transfer facility between the domestic and international terminals as well as introducing baggage carts in gate lounges beyond security screening points. Overall, Haneda Airport is attempting to improve its competitiveness in preparation for the 2020 Tokyo Olympics and Paralympics Games.
Section 4. T
AIPEIA
IRPORTS
YSTEM2.4.1. History of the Taipei Airports
The Taipei airport system consists of two airports: Taoyuan International Airport and Songshan International Airport. Songshan Airport is located within the downtown Taipei area and is conveniently located for those that are looking to travel into and out of the immediate Taipei area.
Taoyuan Airport, originally known as Chiang Kai-Shek International Airport, was built approximately 40 kilometers outside of Taipei and opened in 1979 to relieve traffic at the congested Songshan Airport. Prior to 1979, Songshan Airport was the primary link between Taiwan and other countries but was severely over-capacity even after a series of expansion. The urban area of Taipei had encroached around Songshan Airport, restricting its ability to further expand outside of its 213 hectares area (in comparison, Narita Airport has 1,090 hectares) (Taipei International Airport, 2014
and MLIT, 2015). After the transfer of traffic, Songshan Airport became primarily a domestic airport while Taoyuan Airport became an international airport hub for the Asia-Pacific region. In response to government policy changes and loss of domestic traffic due to the opening of the Taiwan High Speed Rail, Songshan has began to expand to better accommodate international travelers to Tokyo, Seoul, and mainland China. Taoyuan Airport is currently in the midst of its own renovations to update its facilities to modern standards, with a rapid transit system set to link the airport with Taipei city in the near future.
2.4.2. Taoyuan International Airport (TPE)
Located about 40 kilometers west of Taipei, Taoyuan Airport is the busiest airport hub in Taiwan, serving as the main international gateway into the country. The airport is also the main hub for the Taiwanese airlines China Airlines and EVA Air. After gaining most of Songshan Airport’s international operations in 1979, Taoyuan Airport has gradually grown to become one of the major transfer airports in the Asia-Pacific region for trans-Pacific flights. Because of its distance from the city center, passengers need to take local ground transportation, such as cars or buses, for about an hour to reach Taoyuan Airport from the Taipei city center. There is currently a mass rapid transport connection currently planned for commencement in December 2015 that will allow travel between Taipei Station and the airport in 35 minutes, which will greatly improve the airport’s convenience and competitiveness.
Taoyuan Airport’s promise to passengers is its goal of “Connecting the World with Heart”
(Taoyuan Airport Corporation, 2014). The airport is striving to provide passengers with innovative services, elegance/diversity of Chinese culture, and a sense of human touch as it rises to become a benchmark for airports worldwide. Taoyuan Airport has recently pursed and completed a few major projects that have increased its ability to handle increasing numbers of passengers while providing an increased level of service. The first of such projects was the completion of the Terminal 1 renovation, which was the remodeling of the 32-year old terminal and bringing it up to modern standards. Furthermore, the airport has also worked to upgrade its two runways to accept newer and larger aircrafts, providing passengers more choices in flight choices. At the current time, Taoyuan
Airport consists of two passenger terminals, with a third terminal in the planning stages. Table 9 provides some basic information about the existing terminals.
Terminal 1 Terminal 2 Completion Date
(Renovation Completion Date)
February 26, 1979
(June 2013) July 29, 2000
Annual Capacity 15 million 17 million
Floor Area 182,796 m2 316,643 m2
Passenger Aprons 18 20
Table 9: Taoyuan Airport Terminal Information (Taoyuan Airport Corporation, 2014)
With all of Taoyuan Airport’s improvements, the airport has concentrated on customer satisfaction. The airport has invested heavily in embedding Chinese culture and elegance into its new terminal designs, particularly in new theme waiting lounges that exhibit Taiwan’s diversity.
Furthermore, the airport has worked to implement innovative technologies. These have included automated check-in counters, streamlining the customs clearance process, and even an electronic parking space query system to help drivers find their vehicles in airport parking lots.
2.4.3. Songshan International Airport (TSA)
Conveniently located within the city limits of the Taipei city center, Songshan Airport is Taiwan’s first international airport and major Taiwanese hub until Taoyuan Airport replaced Songshan Airport in handling international flights. Following the shift in focus, improvements in land transportation (e.g., the Taiwan High Speed Rail) caused domestic traffic to steeply decline.
Songshan Airport only recently recovered with the emergence of Direct Cross-Straight Flights and Northeast Asia Golden Aviation Circle policies proposed in 2008 (Taipei International Airport, 2014).
Although limited in international services, Songshan Airport has strived to become competitive against Taoyuan Airport on routes to cities designated in the Northeast Asia Golden Aviation Circle.
As seen in Table 10, there is a significant difference between Songshan and Taoyuan Airports
(compare with Table 9). Therefore, this study aims at investigating Songshan Airport’s competitiveness against Taoyuan Airport’s competitiveness in the overlapping market (i.e., flights primarily to Japan, South Korea and China).
Terminal 1 Terminal 2 Renovation Completion
Date October 28, 2010 March 29, 2011 Annual Capacity 3.8 million 2.8 million
Floor Area 59,518 m2 18,115 m2
Contact Gates 6 2
Table 10: Songshan Airport Terminal Information (Taipei International Airport, 2014; Staff Writer, 2010; China Post News Staff, 2011)
With the renovation of Terminal 1, Songshan Airport has enhanced its check-in hall and waiting lounges with various appealing flight-related imagery and themes. Furthermore, Songshan Airport has appealed further to travelers by introducing an observation deck overlooking the airport.
The Taiwanese government has also set up an International Health Liaison Center at Songshan Airport to provide medical consultation and hospital contact for medical tourism passengers, as well as a massage station for stress relief services (Taipei International Airport, 2014). In terms of commercial facilities, Songshan Airport has established Fashion Avenue, an area within the airport laid out like a commercial street with international brands and duty-free shops lining the avenue.
In terms of new technological implementations, Songshan Airport has strengthened its role as a business airport by improving the free Wi-Fi service as well as electric charging stations.
Furthermore, Songshan Airport has invested in using an electronic boarding-pass verification system to speed up check-in and boarding processing. To provide readily available information to passengers, Songshan Airport has also introduced Information Kiosks at various spots in the terminals. Though small, Songshan Airport is effectively trying to position itself as a prominent business airport in Taipei.
Section 5. S
EOULA
IRPORTS
YSTEM2.5.1. History of the Seoul Airports
Two airports exist in the Seoul airport system: Incheon International Airport and Gimpo International Airport. Gimpo Airport was the original airport in the Seoul area, located approximately 15 kilometers west of the central area of Seoul. Gimpo Airport was the primary gateway into South Korea through the latter half of the 20th century, but its limited ability to cope with the growing traffic through the airport led the Korean government to order the construction of a larger international airport in Incheon, about 48 kilometers away from the Seoul city center. In 2001, Incheon Airport was opened for service and received most of Gimpo Airport’s share of international traffic. As a result, Gimpo Airport became primarily responsible for domestic routes and Incheon Airport was responsible for international routes. However, in subsequent years, Gimpo Airport reestablished several international routes to Japan, China and Taiwan. Although not very competitive in the international market due to limited route availabilities, Gimpo Airport is becoming competitive against Incheon Airport in terms of these few routes to Japan, China and Taiwan. In the meanwhile, Incheon Airport has grown significantly to becoming one of the world’s preeminent airport, receiving numerous international awards from Skytrax (see Table 5).
2.5.2. Incheon International Airport (ICN)
Incheon Airport, located in a satellite city of Seoul, is one of the world’s busiest airports in terms of international passengers. Located some distance away from Seoul, Incheon Airport can be accessed from the city center by bus or by the A’REX train within an hour. Incheon Airport was envisioned originally as a relief for Gimpo Airport’s traffic but soon became a destination within itself as many entertainment and resort facilities were built into the airport. Furthermore, Incheon Airport is still in the midst of expanding its operations and is currently building an additional terminal (Incheon International Airport Corporation, 2015). Statistics about the current terminal and the planned expansion are shown in Table 11. Incheon Airport also serves as the main hub for three of Korean airliners: Korean Air, Asiana Airlines, and Jeju Air.
Terminal 1 Concourse Terminal 2 Commission Date March 2001 June 2008 2017 (expansion by
2025)
Total Floor Space 496,000 m2 166,000 m2
around 378,000 m2 (expand to 663,000
m2) Passenger
Handling Capacity 30 million 14 million 18 million (expand to 46 million) Number of Contact
Gates 44 30 37 (expand to 72)
Table 11: Incheon Airport Terminal Information (Rahn, 2008 and 2009; “Incheon International Airport”, 2015)
Incheon Airport focuses its strategy on serving the people through four main strategies:
ensure safety and convenience, strengthen hub network, expand new infrastructure, and gain and respect as public corporation (Incheon International Airport Corporation, 2014). In addition to continuing its accident-free reputation since its opening, Incheon Airport has also redeveloped itself as a “culture-port” by providing displays and performances of Korean cultural culture within the airport itself. The Millenium Hall, designed as the centerpiece of Incheon Airport, reflects “the marriage of form and function that is the dominant theme of the IIA [Incheon International Airport]”
(Jung, 2001). Furthermore, the airport has developed a “Korean Cultural Street” that reproduces traditional Korean buildings for passengers to tour as they traverse the airport. Incheon Airport also ranks as the world’s top duty free shop in terms of sales, with over 500 brands being offered to travelers and additional expansions underway (Incheon International Airport Corporation, 2014).
2.5.3. Gimpo International Airport (GMP)
Gimpo Airport is located about 15 kilometers west of Seoul and is Korea’s third most busiest airport, being surpassed by Incheon International Airport and Jeju International Airport. Although it began as a Japanese military landing strip in 1939 Gimpo Airport was upgraded into an international airport in 1971 and served in that role for three decades before passing it on to Incheon Airport
(“Beautiful Flying”, 2015). However, Gimpo Airport has recently been slightly renovated and modernized to include the “Sky City”, which offers a place of culture, leisure and shopping.
Furthermore, Gimpo Airport also has a shopping outlet inside the international passenger terminal with over 250 brands, along with a movie theater and wedding hall (“Gimpo Airport Outlet”, 2015).
Various Skytrax customer reviews have noted that although Gimpo Airport is conveniently located to Seoul and an efficient airport, it is somewhat outdated due to lack of significant renovations and modernizations (“Seoul Gimpo Airport”, 2015). Current plans for the airport include “strengthening competitiveness as a Biz-Port” through the improvement of business communication infrastructure and immigration procedures (Korea Airports Corporation, 2014).
Section 6. R
ELATEDL
ITERATURER
EVIEW2.6.1. Selection of Data Type
When passengers decide on a trip that they would like to embark on, they encounter a myriad of choices. Each of the passenger’s choices inevitably leads to another choice, as shown in Figure 2.
However, Figure 2 shows only the basic scenario where only the most obvious dependencies were analyzed. Hess goes into more detail in her study about the chain of choices that a passenger makes, with one choice obviously limiting future choices. For example, a passenger has already limited his or her choice by selecting air travel to the chosen destination. After a passenger has made a choice, he or she is then confronted with a series of other choices, which Hess investigates in a further discussion about revealed preference (RP) and stated preference (SP) (Hess, 2010).
It is often difficult to perform an analysis of the many different factors of the choice process using RP data. In an RP survey, the data focuses on observations of what a respondent has chosen to do, while SP data represents direct responses from a respondent as to what he or she would have done when presented with a situation. SP data allows respondents to more definitively choose factors and reasons as to their choice, but the downside to SP data is that respondents have only a limited subset of choices modeled. Hess believes that SP data is more successful in determining significant factors for passenger choices (Hess, 2010). Another of Hess’s research also backs this claim up since
she further states that “studies using RP survey data often fail to recover a meaningful fare coefficient” (Hess, 2007).
Figure 2: Main Choice Processes of an Outbound Air Journey (Hess, 2010) Travel by
Air
Specific Flight Time &
Date Airline(s)
Dept.
Airport
Arrival Airport
Egress Mode(s)
Egress Route Connect.
Airport(s) Direct vs.
Indirect Access
Mode(s)
Access Route
Choice of Destination
Decision to Travel
2.6.2. Use of SP Data and Introduction to Nested Logit Models
Another one of Hess’s research focuses on demonstrating the usefulness of SP survey data in analyzing airport and airline choice behavior (Hess, 2007). RP data may not contain adequate or detailed information related to the factors that influence respondents’ choices, which leads to unreliable data for analysis. To justify this statement, Hess collects both RP and SP survey results.
Variables that Hess considers included frequent flier information, flight connections/transfers, aircraft-type and on-time performance. However, a major downside of Hess’ study with consideration to the current study is that Hess focuses primarily on the price sensitivity and access time acceptability for different types of passengers, from business travelers to holiday travelers to travelers visiting friends and relatives (VFR travelers) (Hess, 2007). While Hess does a thorough job in analyzing a passenger’s preferences in terms of flights chosen, she does not look directly into various airport factors influencing a passenger’s choice in airports in airport systems.
Using specialized software, Hess is able to construct linear and non-linear models of the data correlations in line with a Multinomial Logit structure for her research. However, Hess notes that nesting structures are not applicable because of the nature of the data set, a limitation which may be applicable to this study’s survey results as well (Hess, 2010). Furthermore, Nested Logit models can only be used for one dimension of choice, with multi-level Nested Logit model being used for multiple dimensions of choice. Although ideal for determining various dimensions of choice, the structures and models have a major downside in that it is only able to correlate along N-1 dimensions, where N is the total number of dimensions. In other words, Nested Logit model is can correlate one less than the maximum number of dimensions, where the lowest nested level becomes obsolete.
A research by Yang is more related to the Northeast Asian airports that are selected as part of the current study. Yang researched the interdependence of airports and flight routes using a two-level Nested Logit model (Yang, 2014). While this study is significant in that it deals with the same region’s airports as the current study, Yang chooses to model the dimensions of joint airport and route choices using an SP design. This is different than the current study in that the current study explores airport choice, not route choice from each airport. However, factors that Yang considers
were also utilized in the current study’s survey, specifically questions about socioeconomic characteristics as well as air fare, flight frequency and access times, which were what Yang found to be more influential in affecting airport choice.
2.6.3. Direct Survey Analysis for Passengers’ Airport Satisfaction
The Civil Aviation Authority (CAA) carried out an extensive assessment of three London Airports: Heathrow, Gatwick and Stansted. Overall, it uses “data obtained from the CAA Passenger Survey in order to analyse the extent to which an airport’s passengers may be willing and able to switch away from that airport, the possible reasons why passengers choose a particular airport, and their price responsiveness” (Civil Aviation Authority, 2011). Because of the related nature of this working paper to the current study, many aspects of the study are replicated in the current study for researching Northeast Asian airports. Furthermore, the CAA study also utilizes SP data. Some of the CAA study involves asking passengers about airports that they have used in the recent years, as well as any other airports that were considered as alternative airports. The results are organized into the top five reasons that leisure passengers, business travelers, and VFR travelers chose a specific airport.
An example of the organization is shown in Table 12. These results are also organized according to flight duration.
Rank UK Foreign
1 Nearest to Home 31% Cost 36%
2 Third Party Decision 27% Third Party Decision 17%
3 Route Network 18% Nearest to Leisure 17%
4 Cost 15% Route Network 15%
5 Timing of Flights 4% Nearest to Home 7%
Table 12: Top 5 Reasons for Airport Choice by Leisure Passengers at the Four Major London Airports (Civil Aviation Authority, 2011)
The CAA study goes further than the current study in investigating the passengers’
responsiveness to change prices. CAA was able to accomplish this through including a hypothetical
SP question that asked passengers to respond to an increase in the airfare from their departure airport.
These increases are of set amounts ranging from £5 to £50 for short to long haul flights. The results show that business travelers, particularly at Heathrow, are not likely to switch away from their airport compared to other types of travelers.
A second study relating to service quality and customer satisfaction with an airport was conducted by Bezerra on Guarulhos International Airport in Brazil. The study focuses on attributes related to the passenger terminals and uses both exploratory factor analysis and ordinal logistic regression models to analyze relationships between various aspects of the airport with the passengers’
overall satisfaction (Bezerra, 2015). Although this study does not directly connect with the current study, a passenger’s satisfaction in an airport can easily be correlated to the possibility that the passenger will select that airport repeatedly, particularly if the airport is part of an airport system.
The survey probes dimensions such as check-in, security, ambience, basic facilities, prices, convenience, and mobility. The study found that although passenger characteristics had no significant effect, frequent flyers may not present high levels of satisfaction. In addition, the study found that restaurants and stores “may be considered dissatisfiers for passenger satisfaction, which mean that an increase in their quality should not have greater impact in creating satisfaction, but a decrease should create dissatisfaction” (Bezerra, 2015). Other conveniences, such as food facilities, stores, banks/ATMs/exchanges, and courtesy and helpfulness of staff were found to be mainly dissatisfiers as well. Ambience, however, was found to be the dimension with the highest effect on customer satisfaction.
2.6.4. Performance Evaluation for Airports
Although not directly related to the analysis of airport choice by passengers, there are a few studies based on an evaluation of airport performance. While these researches themselves cannot be directly used in this study, some of the factors that were analyzed prove to be of use in determining factors for passenger choice. The first research by Chang analyzed the performance of international airports in East Asia, specifically at Narita International Airport (Tokyo), Kansai International Airport (Osaka), Incheon International Airport (Seoul), Beijing International Airport (Beijing),