九州大学学術情報リポジトリ
Kyushu University Institutional Repository
The roles of predictive information in absolute evaluative processing
オウンジャイ, カジョーンヴット
http://hdl.handle.net/2324/2236051
出版情報:九州大学, 2018, 博士(システム生命科学), 課程博士 バージョン:
権利関係:
The roles of predictive information in absolute evaluative processing
Mr. Kajornvut Ounjai
Supervisor: Professor Johan Lauwereyns Cognitive Neuroscience Laboratory
In Partial Fulfilment of the Requirements for the Doctoral Degree in the Graduate School of Systems Life Sciences
Kyushu University, Fukuoka, Japan
December 2018
i | P a g e
Abstract
Predictive processing is fundamental to many aspects of the human mind, including perception and decision-making. The previous researches show that animals and humans share similar preference toward the information that provides reliable prediction for the future outcome, mainly future rewards, even though obtaining predictive information does not change the value of upcoming rewards. It remains to be elucidated, however, in which way predictive information impacts on absolute evaluative processing, particularly in tasks that employ bivalent stimulus sets. Various accounts, including framing, proactive interference, and cognitive control, appear to imply contradictory proposals on the relation between prediction and preference formation.
To disambiguate whether predictive cues produce congruent biases versus opponent mechanisms in evaluative processing, we conducted two experiments in which participants were asked to rate individual food images. The image database included appetitive and aversive items. In each trial, a cue predicted, with varying degrees of reliability, the valence of the impending food image. In both experiments, we found that the ratings exhibited congruent biases as a function of the reliability of the predictive cue, with the highest evaluations following the most reliable positive-valence predictions. Eye prepositioning further showed a selective spatial bias suggestive of response preparation in line with the predictions. The response times also exhibited a pattern of results consistent with selective preparation, producing slow responses following invalid predictions. The data suggested an active form of evaluative processing, implementing a confirmation bias that aims to accommodate the prediction.
ii | P a g e In addition, the several extended analyses show other characteristic of the predictive information in this particular experimental paradigm. Pupil dilation analysis during the cue exposure suggests that pupillary responses do not work as a function of explicit features of the predictive cues such as cue reliability, cue valence and cue color. However, the intrinsic arousal level that is induced by the predictions from predictive cues is the major factor that involves the pupil dilation. The history analysis of evaluation score shows that there is no significant effect of confounds by predictive information and the exposure of images in the past on the evaluation process of current images. And lastly, the median split analysis shows interesting evidences on the underlying mechanism behind human evaluation processing. Regardless of cueing condition, outcome valence and other experimental conditions, people have tendency to give more extreme rating when they decide to response fast by their own wills. These interesting results inspire promising future works that provide further investigation of the underlying mechanism of evaluation processing.
In conclusion, this thesis provides the solid evidences of how the predictive information affects the absolute evaluation in various cue reliability and cue valence for both positive and negative outcomes. The results suggested that confirmation bias from predictive cue works actively as the amplifier of subjective value of the congruent outcomes while also being the reducer of the incongruent outcome. Other extra analyses show the robustness of experimental paradigm, potential physiological indicator for measuring intrinsic arousal value of predictive information by using pupil dilation and also the interesting underlying mechanism of evaluation processing in relationship between response speeds with the polarization of the rating score. These data not only answer the main questions that we have on the role of predictive information in absolute evaluation but also open up the new chapter of future research that might provide other insight mechanisms of human evaluation processing.
iii | P a g e
Ethics statement
The protocols for the present study were designed in accordance with the Declaration of Helsinki, and were approved by the Human Ethics Committee of the Faculty of Arts and Science, Kyushu University (issue number 201711). Informed consent was obtained in writing from each subject.
iv | P a g e
Table of Contents
Abstract ... i
Ethics statement ... iii
Table of Contents ... iv
List of Figures ... vii
Acknowledgements ... ix
Chapter 1: General Introduction ... 1
Chapter 2: Active Confirmation Bias in the Evaluative Processing of Food Images ... 7
Introduction ... 7
Rationale of the present study ... 10
Methodology ... 14
Subjects ... 14
Apparatus and stimuli ... 14
Experimental procedures ... 15
Experiment
1.
... 15Experiment
2.
... 17Results ... 18
Experiment 1 ... 18
Evaluation scores. ... 18
Manual response times ... 20
v | P a g e
Gaze distribution data ... 22
Experiment 2 ... 24
Evaluation scores ... 25
Manual response times ... 27
Gaze distribution data ... 29
Discussion ... 31
Congruent Bias as an Active Process toward Confirmation ... 32
Chapter 3: Further investigation in the absolute evaluation process ... 35
Introduction ... 35
Method ... 37
Pupil dilation analysis ... 37
History analysis ... 38
Median split analysis... 39
Result ... 40
Pupil dilation analysis ... 40
History analysis of evaluation score ... 44
Median split analysis... 47
Discussion ... 52
Pupil dilation analysis ... 52
History analysis on the evaluation score ... 53
Median split analysis: the gate to new question... 54
vi | P a g e
Chapter 4: General Discussion... 57
References ... 65
Appendix A ... 70
Appendix A1: Visualization of gaze distribution ... 70
Appendix A2: Visualization of experiment 2 paradigm ... 72
Appendix B ... 74
Appendix B1: Sample of pre-experiment questionnaire ... 74
Appendix B2: Sample of post-experiment questionnaire ... 75
Appendix B3: Sample of Informed consent (Paid) ... 76
Appendix B4: Sample of Informed consent (Optional learning experience) ... 78
vii | P a g e
List of Figures
Figure 1. Distribution of the bivalent stimulus set.. ... 10
Figure 2. Schematic representation of the predictive cues in Experiment 1, associated with different outcome types... 11
Figure 3. Trial structure in Experiment 1. ... 13
Figure 4. Average ratings in each condition in Experiment 1. ... 19
Figure 5. Average response times (ms) in each condition in Experiment 1. ... 21
Figure 6. Average horizontal eye positions during the delay period in Experiment 1, as a function of delay duration, cue reliability, and cue valence. ... 23
Figure 7. Average ratings in each condition in Experiment 2. ... 26
Figure 8. Average response times (ms) in each condition in Experiment 2. ... 27
Figure 9. Average horizontal eye positions during the delay period in Experiment 2, as a function of the type of cue and evaluation bar. ... 29
Figure 10. The changes of pupil size over time in experiment 1 for each cue valence and cue color on 1s delay condition. ... 40
Figure 11. The changes of pupil size over time in experiment 1 for each cue valence and cue color on 9s delay condition. ... 41
Figure 12. The change of pupil size over time in experiment 1 for each cue valence and cue reliability on 1s delay condition. ... 42
Figure 13. the change of pupil size over time in experiment 1 for each cue valence and cue reliability on 9s delay condition. ... 42
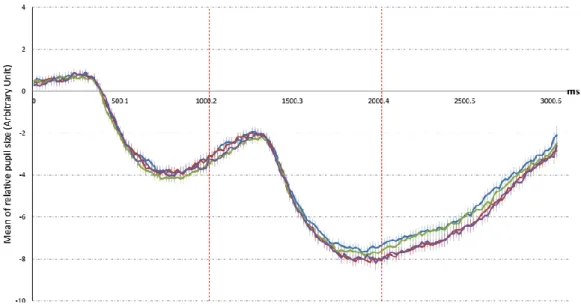
Figure 14. the change of pupil size over time in experiment 1 for each outcome valence and delay time condition during 2s stimuli exposure period. ... 43
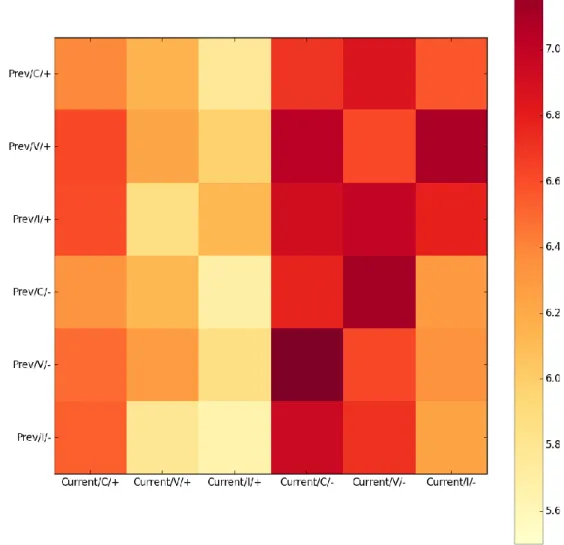
Figure 15. The 2D histogram visualizes the average evaluation score of experiment 1 arranging by previous trial conditions and current trial conditions. ... 44
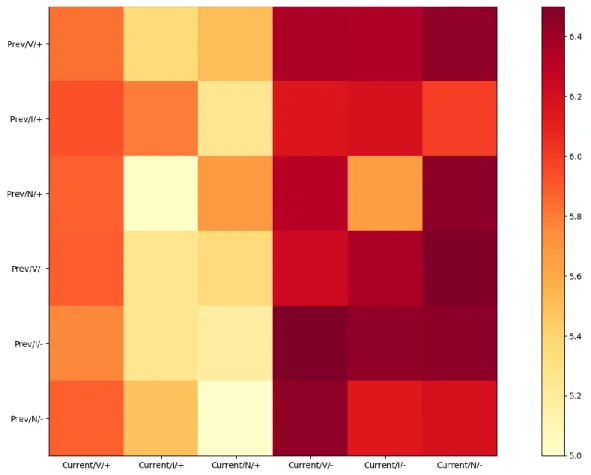
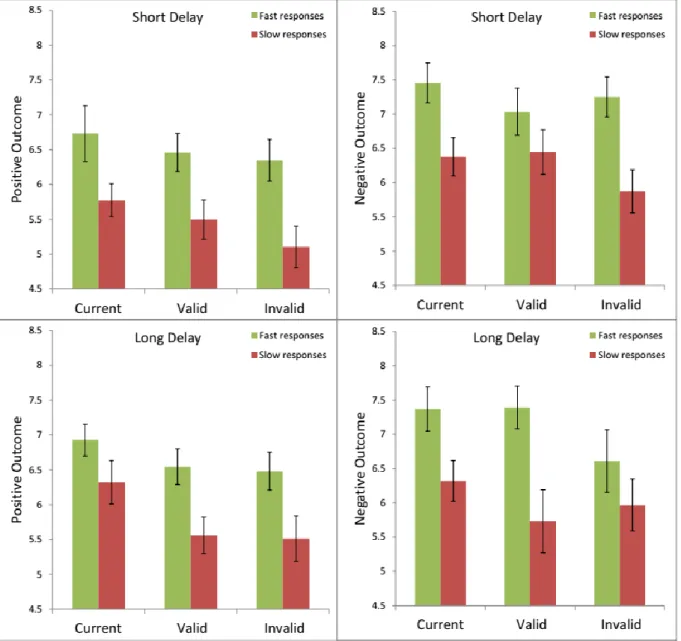
viii | P a g e Figure 16. The 2D histogram visualizes the average evaluation score of experiment 2 arranging by previous trial conditions and current trial conditions. ... 45 Figure 17. The average rating in each condition in experiment 1 split into two group by median of reaction time. ... 47 Figure 18. The average rating in each condition in experiment 2 split into two group by median of reaction time. ... 50 Figure 19. The scatter plots and heat maps of gaze distribution in experiment 1. ... 70 Figure 20. Trial structure in Experiment 2. ... 71 Figure 21. Schematic representation of the predictive cues in Experiment 2, associated with different outcome types... 72
ix | P a g e
Acknowledgements
This thesis cannot be completed without supports and guidance from many people that I want to gratefully mention here in the acknowledgement.
First of all, I would like to sincerely thank my advisor, Prof. Johan Lauwereyns, who accept me whom make a shift from other field of study to joined this small but heart-warmth laboratory. With his guidance during the past 3 years, I have achieved many things that seem impossible to do within 3 years. And if I have a chance in future, I still want to come back at Dubito lab again as post-doctoral researcher.
Second, I would like to thank Dr. Shunsuke Kobayashi who always provides useful comments from the different point of view, which help a lot for refining both the quality of my Ph.D. research and also my personal vision. Dr. Kobayashi always be the second voice who keep encouraging me similarly to my advisor. Those cheer-up words from him always keep me back on track whenever I felt lost in this new research field.
Next, I would like to thank Prof. Kenji Iramina for all supports that he always give to me. In the times of need, Prof. Iramina always offers the helps e.g. when I struggled with the system of Kyushu University or provided me a permission to accessed the facilities of his laboratory while I conducted experiment at Ito campus. Without his supports, my Ph.D.
researches could not run smoothly like this.
Lastly, I would like to thank all my friends who keep encouraging me and stay by my side at in times of need especially Dubito lab members Ryu, Tokka, Noha, Crystal and Ola, my close friends Yok and Poome, my shared house mates Ayaka-san and Mako-san, my family and my fiancée, Wasitee. I love you all.
x | P a g e I would like to dedicate this Ph.D. thesis to my beloved mother, Rattiya Eimsiripreeda, who just passed away suddenly on 17th December 2018. Without supports and all cheer-up words from her, I could not withstand the toughest moments during my studies. Her faiths in me always guide me though the bad moments and lead me to the path of succession. She will always stay in my mind and I will keep going to make a great contribution to this world as her wishes.
1 | P a g e
Chapter 1: General Introduction
One of the powerful motivator in the daily life is the desire to know what will happen in the future. The information that can lead to the prediction towards future outcome always fascinates people including cognitive neuroscientists and psychologists to investigate how the brain reacts to this kind of information. In broader perspective, the predictive processing is a big part of our brain engine because the predictive processing in general can refer to any type of processing towards the future state; not only the information processing but also the internal body states up until the state of surrounding environments. The difference between sensory inputs with the predictions from top-down brain process create errors and the brain adapts to minimize these errors in cortical processing (Clark, 2013). Because the prediction processing works as a bridging process over the different points of time, from the information in present and the past towards cognitive outcomes in the future, predictive processing is unarguable main cognitive function that makes our brain so efficient (Bubic, Von Cramon, & Schubotz, 2010).
The predictive information is one kind of specific predictive processing inside the brain which is triggered by information that provides the hints about the outcomes, events or experiences in the future. In daily life situations, people generally seek for this kind of information because the accurate predictors accommodate us in planning and preparing how to deal with that upcoming future. Although gaining information will not affect the amount of upcoming outcome, the study by Iigaya et al. (Iigaya, Story, Kurth-Nelson, Dolan, & Dayan, 2016) also shows that humans still have preference to gain more information about upcoming outcome in general. Not only in human but also animal studies that conducted in monkeys (Blanchard, Hayden, & Bromberg-Martin, 2015) and pigeons (McDevitt, Dunn, Spetch, &
Ludvig, 2016; Zentall, 2016) show that these animals have the same seeking behaviors for the
2 | P a g e information when the information is related to rewards in near future. In pigeons’ studies, the results even showed that pigeons prefer to select sub-optimal choices that provide certain information more than the optimal choice that come after uncertain information.
Moreover, the monkeys studies by Bromberg-Martin and Hikosaka (Bromberg-Martin
& Hikosaka, 2009, 2011) also showed the neural bias in macaque monkeys in the preference test between two choices that provided different predictions of the upcoming rewards. Even though the choice selection does not change the amount of upcoming rewards, monkeys still preferred to select the choice that provided certain information about the upcoming rewards more than the choice that provided uncertain information. In addition, the activation of dopamine neurons in lateral habenula immediately after the exposure to the certain information of either big or small rewards have similar characteristics with the dopamine activation when either big or small rewards are given after uncertain information. These studies suggest that reward seeking mechanism and information seeking mechanism might be the same mechanism when the information provides prediction to rewards. Also the preferences toward this predictive information are embedded in neuronal level, not only in the higher cognitive process.
Although previous researches established the roles of predictive information in the relative evaluation processing between different choices, there is still unclear about how predictive information affects the absolute evaluation. In the other words, animals and humans have preference towards the certain predictive information but how subjective value of the outcome change by predictive information is still underdetermined. The previous researches on the predictive processing gave two major suggestions on the role of prediction on the evaluation process; either prediction produces congruent bias in the evaluation process (Cunningham, Van Bavel, & Johnsen, 2008; Jin, Zhang, & Chen, 2017; Levin, Johnson, Russo,
& Deldin, 1985; Tversky & Kahneman, 1981; Wilson, Lisle, Kraft, & Wetzel, 1989) or the prediction leads to the active inhibition that reduces the subjective value of the outcome
3 | P a g e (Aydogan et al., 2018; Cheng, Wu, & Lin, 2014; Geers & Lassiter, 1999; Stamos, Goddyn, Andronikidis, & Dewitte, 2018). In this sense, other empirical studies that are designed specifically to investigate the role of predictive information on the subjective evaluation are needed.
In the previous studies, there are reports about the related factors that might correspond to the effectiveness of the predictive information. In utility of anticipation researches (Loewenstein, 1987), the longer duration of anticipation towards future rewards also works as the enhancement over time on the subjective value of the outcome while the coexist mechanism, called temporal discounting, also reduces the subjective value of the outcome as a function overtime. Even though the boost by anticipation might overcome the discounting effect at first but, for long term, the temporal discounting will counter and suppress the subjective value of outcome instead (Iigaya et al., 2016). Therefore, there is a possibility that effectiveness of predictive information on evaluation processing can be influenced by the anticipation duration between the exposure to predictive information and outcome.
Other interesting factors are the valence of the outcome. While most of prediction errors, information errors, utility of anticipation studies based on the rewards (Bromberg-Martin &
Hikosaka, 2009, 2011; Iigaya et al., 2016; Schultz, 2013; Schultz, Dayan, & Montague, 1997), the opposite prediction for negative outcomes is barely investigated. Many previous studies show the asymmetrical effect between positive and negative outcomes, events or experiences on many cognitive processes such as behavioural outcomes according to threaten justice (Barclay & Kiefer, 2014) and satisfaction level of products (Mittal, Ross Jr, & Baldasare, 1998;
Rychalski & Hudson, 2017). Also, there are clear evidences that people tend to have bias towards positive information (Peeters, 1971; Unkelbach, Fiedler, Bayer, Stegmüller, & Danner, 2008) but the negative information have stronger impact in general for psychological phenomena (Baumeister, Bratslavsky, Finkenauer, & Vohs, 2001). To provide the whole
4 | P a g e pictures of how predictive information affects the underlying brain mechanism during the subjective evaluation process, it is essential to use bivalent stimuli set as the outcome of our experimental paradigm.
To create novel contribution in this kind of study, the series of experiments in the current thesis are mainly designed for evaluation of single stimulus and supporting bivalent stimuli set. By adapting from choice selection paradigm, which is highly regards as a paradigm that can use for direct comparison between animal and human study, to single image evaluation task, we can observe how predictive information influence in the subjective value of the outcome though the changes of evaluation score. Moreover the observation of how the predictive information affects the absolute evaluation of both positive and negative outcome in single experiment can provide the further understanding of how predictive information operate in each stimuli valence. By combining this two major adaptation in the behavior paradigm, the results of this study should be able to identify the overall mechanism of the predictive information in subjective evaluation.
In Chapter 2, the main body of this thesis will be explained and described in details of our finding by combining series of two experiments together. The first experiment is designed for overall observation in the role of predictive information on single image evaluation task by using bivalent food images set as stimuli that displayed after predictive cue. In this experiment, the design is not only made for investigating the effect of predictive cue on the rating score but also investigating the factors from literature that might influence the effectiveness of predictive cue including cue reliability level (100% certain cue or 50% uncertain cue), cue valence (either positive or negative) and delay time (either 1s or 9s delay time). Gaze data of participants is captured using desktop eye-tracker, Eye tribe, to provide the other physiological indicators of bias that create by predictive information.
5 | P a g e In the second experiment, we manipulated the cue reliability level to 75% for providing the surprise effect as a feature of predictive information when the prediction is correct most of the time but not always. Also we introduced neutral cue which is just random cues with no valence for investigating the difference between 50% uncertain cue and neutral cue. In addition, the directional gaze bias that was found in the first experiment was investigated further by introducing the different direction of evaluation bar to different group of subjects. According to this design, the results of gaze distribution analysis for the second experiment could show that whether directional gaze bias is followed the direction of score on the evaluation bar, or, it works as function of other cognitive bias in general. This main chapter had been published in the Scientific Reports in the title of “Active Confirmation Bias in the Evaluative Processing of Food Images” (Ounjai, Kobayashi, Takahashi, Matsuda, & Lauwereyns, 2018).
In chapter 3, other interesting investigations were done on results from both experiments which provided some more insights of the predictive information and some interesting suggestions on the underlying mechanisms of subjective evaluation process. Results of pupil dilation analysis show how pupil reacts to the predictive cue and stimuli in each experimental condition. History analysis on the evaluation score provided supporting evidence on the robustness of the paradigm by countering the concern of the experimental design that whether the information in the previous trial is still maintained and contaminated the rating of current trial, or not. Lastly, median split analysis of both experiments had been done to observe the relationship of reaction time in evaluation process for each experimental condition. This analysis provides further interesting data that suggests underlying mechanism behind evaluation process when participants decided to response fast or slow by their own will.
According to results of median spilt analysis, the consistency of cueing effect obtained in this paradigm is shown as a bias by predictive cues expressed in different response speed.
6 | P a g e The last chapter of this thesis provided the general discussion on the findings about the roles of predictive information in absolute evaluation process. The limitations and concerns of experimental conditions, measuring methods and the stimuli set are mentioned with suggested solutions for future experiments. Finally, the most promising future works that inspired by the findings in this study are mentioned with my own predictions on those future works and how those future studies might provide interesting insight of evaluative decision-making process in general.
7 | P a g e
Chapter 2: Active Confirmation Bias in the Evaluative Processing of Food Images
Introduction
In contemporary psychology, neuroscience, and philosophy of mind, the most comprehensive accounts of brain and mind suggest that predictive processing is central to many, if not all, forms of cognition (Clark, 2013, 2015; Friston, 2010; Hohwy, 2013; Lauwereyns, 2010). Also with respect to evaluative processing, it has been shown that contextual information can elicit expectations that modulate the liking of stimuli as diverse as visual art (Kirk, Skov, Hulme, Christensen, & Zeki, 2009), music (Aydogan et al., 2018), coffee (Fenko, de Vries, & van Rompay, 2018), soda (Schmidt, Skvortsova, Kullen, Weber, & Plassmann, 2017), and wine (Plassmann, O'Doherty, Shiv, & Rangel, 2008). The effects of prior expectations appear to have a fundamental impact on the perceptual processes underlying the evaluation, in ways that are difficult to accommodate with normative theories about rational decision-making(Kahneman, 2003).
Instead of rational decision-making, evaluative processing often involves complex or seemingly inscrutable processes we usually call “subjective,” with the implication that they are idiosyncratic and cannot be disputed (as according to the Latin maxim, De gustibus non est disputandum; “In matters of taste, there can be no disputes”). However, in reality we frequently do debate evaluative processing in virtually all aspects of human society, from commerce to health and well-being, from bioethics to politics. The phenomena of evaluative processing warrant scientific investigation, particularly with a view to understanding how, and when, biases distort the evaluation of objects and events that afford no easy objective metric (Kroger
& Margulis, 2017; Lauwereyns, 2010; Stauffer & Buckley, 2005; Ziegert & Hanges, 2005).
8 | P a g e The issue is to chart the extent to which evaluative processing is pervious to external influences.
The present study aims to contribute to this task.
More specifically, we focus on the direction of influences from prior expectations when both the predictions and the outcomes are bivalent. We chose food images as a relevant category for evaluative processing with bivalent items (Armel, Beaumel, & Rangel, 2008; Lim, O'Doherty, & Rangel, 2011; Sokol‐Hessner, Hutcherson, Hare, & Rangel, 2012) that elicit a complex integration of visual and non-visual features (e.g., flavor, caloric value, nutritive attributes) (Bailey & Muldrow, 2018; Bielser, Crézé, Murray, & Toepel, 2016; Kühn et al., 2016; Suzuki, Cross, & O’Doherty, 2017). Previous research in our lab had further shown that the rating of individual food items provides a suitable opportunity to investigate the cognitive mechanisms underlying evaluation (Wolf et al., 2018). Here, we examine how explicit, supraliminal positive or negative predictions impact on the evaluation of appetitive or aversive food images.
Previous research on framing effects might be taken to suggest that bivalent predictions should lead to congruent biases in the evaluative processing, with more positive evaluations following positive predictions and vice versa (Cunningham et al., 2008; Jin et al., 2017; Levin et al., 1985; Tversky & Kahneman, 1981; Wilson et al., 1989). We term this the “congruent bias” hypothesis. The congruent biases from framing would be due to explicit expectations under voluntary control. It has further been suggested that such positive or negative expectations evolve over time, potentially becoming more polarized (Iigaya et al., 2016;
Loewenstein, 1987). Other phenomena and theories can also be interpreted to imply similar congruent biases, albeit on the basis of implicit mechanisms that would be activated automatically or unconsciously by the predictive cues. These phenomena and theories include priming (Bargh, 2006; Dalenberg et al., 2014; Stöckli, Stämpfli, Messner, & Brunner, 2016), proactive interference (Wright, Kelly, & Katz, 2018), Pavlovian-instrumental transfer (Cartoni,
9 | P a g e Balleine, & Baldassarre, 2016; Geurts, Huys, Den Ouden, & Cools, 2013), and emotional contagion (Howard & Gengler, 2001; Morales & Fitzsimons, 2007).
In contrast, predictive cues could lead to the activation of opponent mechanisms, aiming to operate explicitly against external influences. We term this the “opponent mechanism”
hypothesis. For instance, proactive control would function as an endogenously activated mechanism in opposition to biasing information (Amodio & Swencionis, 2018; van Wouwe, Band, & Ridderinkhof, 2009). Previous research has identified a number of conditions in which the evaluative processing counteracted the biasing influences (Aydogan et al., 2018; Cheng et al., 2014; Geers & Lassiter, 1999; Stamos et al., 2018). Here, the opponent mechanism hypothesis implies a deliberate effort to inhibit responses in line with the prediction. Such active inhibition, however, may produce opposite effects, promoting responses that run counter to the cueing, analogous to phenomena such as inhibition of return (Klein, 2000) and negative priming (Frings, Schneider, & Fox, 2015). Thus, the evaluation of appetitive food images would be higher following negative predictions than following positive predictions.
Conversely, aversive food images, when occurring in contrast to the prediction, would be evaluated more negatively than aversive food images that appear in agreement with the prediction.
Counteractive evaluative processing might also occur as a function of more implicit opponent mechanisms, consistent with the notion of prediction errors in the neuroscience literature on dopaminergic mechanisms (e.g., an unexpected reward leads to stronger dopaminergic activation than an expected reward; such activation is thought to reflect learning and adaptive evaluative processing) (Berridge, 2007; O’doherty, 2012; Schultz, 2013; Schultz et al., 1997). Here, the conjecture would be that the predictive context amplifies the evaluative processing of unexpected outcomes.
10 | P a g e Figure 1. Distribution of the bivalent stimulus set. The blue points and yellow lines reflect the average evaluation scores (blue, vertical axis) and the associated 95% confidence intervals (yellow, horizontal axis) of the 200 images in the database, collapsed across all conditions and all subjects in the present study. Four representative images are shown in inset figures on the right.
Rationale of the present study
The present study was explicitly designed to pitch the congruent bias hypothesis against the opponent mechanism hypothesis. We conducted two experiments in which subjects received a predictive visual cue in advance of a single food image in each trial. The subjects were asked to rate the food image on a scale from -10, for most aversive, to +10, for most appetitive. The database of food images included a balanced variety of images to cover the
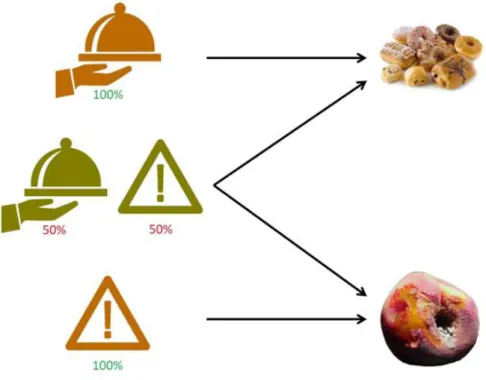
11 | P a g e entire range on the bipolar scale (see Figure 1). The predictive cue indicated, with varying degrees of reliability, whether the impending food image would be aversive or appetitive. In Experiment 1, the predictive cue was either perfectly reliable or random (see Figure 2). Thus, in Experiment 1, random cues effectively offered only a positive or negative framing. After the presentation of the food image, the subjects could manipulate a joystick to record their evaluation (see Figure 3). In Experiment 2, the predictive cue was either 75% reliable or explicitly neutral. In both experiments we recorded manual responses and eye positions.
Figure 2. Schematic representation of the predictive cues in Experiment 1, associated with different outcome types. The color indicates the level of reliability (orange, 100%; green, 50%) whereas the icon indicates the valence (tray, positive; hazard, negative). For 50% reliable cues, the predicted valence reflects merely framing.
According to the congruent bias hypothesis as a function of framing, the evaluations for appetitive items would be the highest for perfectly reliable predictions, and higher following positive framing than following negative framing. For aversive items, the evaluations would be the lowest for perfectly reliable predictions, and lower following negative framing than
12 | P a g e following positive framing. Given that framing would depend on voluntary control, the size of the framing effects should depend on the reliability of the predictive cues. Framing is also hypothesized to lead to response preparation (i.e., anticipatory eye positioning toward the expected response side), and likewise influence response time, with faster responses when the valence of the target matches with the prediction than when there is a mismatch between prediction and outcome. Theories and phenomena that predict congruent biases on the basis of implicit mechanisms do not predict any influence of the cue’s predictive validity, nor do they predict any active response preparation (i.e., no prediction of effects on response time or eye prepositioning).
According to the opponent mechanism hypothesis, the evaluations for appetitive items would be higher following negative framing than following positive framing, and again higher following positive framing than following perfectly reliable predictions. That is, when unexpected or running against the prediction, a positive item would elicit the largest counteractive amplification and therefore receive the most favorable evaluation. Analogously, the evaluations for aversive items would be lower following positive framing than following negative framing, and again lower following negative framing than following perfectly reliable predictions. That is, when unexpected or running against the prediction, a negative item would elicit the strongest amplification and therefore receive the lowest evaluation.
The opponent mechanism hypothesis, as a function of cognitive control, would imply counteractive response preparation (i.e., eye prepositioning toward the direction opposite to the prediction, and slowing of responses that match with the prediction). Opponent mechanisms on the basis of implicit processes (i.e., prediction error) should not affect eye prepositioning or response time.
13 | P a g e Figure 3. Trial structure in Experiment 1. Each trial starts with a word cue, presented for 1 s, indicating whether it will be either a short- or long-delay trial. The predictive cue is shown for 1 s, followed by a blank screen for either 1 s (short delay) or 9 s (long delay). The target image is shown for 2 s at the center of the screen, followed by the evaluation bar. Participants have maximally 6 s to respond by bending the joystick. The response is followed by a 2 s inter-trial interval.
14 | P a g e Methodology
Subjects
In Experiment 1, there were 42 subjects. All were Kyushu University students (26 males, 16 females) with a mean age of 22.45 ± 3.63 years. In Experiment 2, there were 66 subjects.
All were Kyushu University students (38 males, 28 females) with a mean age of 23.94 ± 4.54 years. There were 3 left-handed subjects in Experiment 1, and 2 in Experiment 2; however, these subjects also used their right hand to manipulate the joystick.
In both experiments, all subjects had normal or corrected-to-normal vision. Each person was given 1000 yen as a compensation for the participation, which lasted less than 1 hour. All subjects gave informed consent, and reported that they were in healthy condition before and after the experiment.
Apparatus and stimuli
The visual stimuli were presented in a dimly lit room on a 23.8-inch full high definition flat-panel-monitor, with a display resolution of 1920 × 1080 pixels. The subjects were seated approximately 62 cm from the monitor. To minimize head movement a chin-rest with a forehead-support was used. The evaluation responses were recorded using a joystick (Logitech, Switzerland; model no. 963290-0403). Eye positions were recorded using Eye Tribe, an eye- tracking device at 60 Hz sampling rate (The Eye Tribe Aps, Denmark); a system with sufficient reliability for present purposes (Dalmaijer, 2014; Ooms, Dupont, Lapon, & Popelka, 2015;
Wolf et al., 2018; Zommara, Takahashi, Ounjai, & Lauwereyns, 2018).
In order to start the eye tracking, the subject was asked to follow a dot on the screen for a 16-point calibration. After the calibration, the gaze coordinates were calculated through Eye Tribe with an average error of less than 0.5◦ visual angle on the 23.8-inch display. To prevent
15 | P a g e heat buildup a small universal serial bus (USB) fan was used. All events and recordings were controlled through code written in Psychopy version 1.84.2 (Peirce, 2007, 2009) including the PyTribe library.
All visual stimuli were presented as inset images on a white background in the middle of the otherwise black screen. The size of the inset image was fixed at 380 × 380 pixels for the predictive cues, and at 600 × 600 pixels for the food images. The predictive cues were icons: a tray for positive; a hazard sign for negative; and a checkerboard for neutral. Different colors were used (counterbalanced across subjects) to indicate the reliability of the cues in Experiment 1. Food images were drawn from the FoodCast research image database (FRIDa) (Foroni, Pergola, Argiris, & Rumiati, 2013) and supplemented with non-copyrighted images to construct a set of 200 food images with a balanced range of appetitive and aversive stimuli. If necessary, images were resized to fit in the frame of 600 × 600 pixels. The images were classified into 100 appetitive and 100 aversive stimuli based on the categorization by FRIDa and ratings by lab members. The categorizations proved valid for all 200 images based on the average responses of all subjects in Experiments 1 and 2: Each stimulus in the category of aversive food images received on average a negative rating, whereas each stimulus in the category of appetitive food images received on average a positive rating.
Experimental procedures Experiment 1.
Participants were asked to evaluate 180 naturalistic food images in 3 consecutive blocks of 60 trials with breaks of not more than 5 minutes between the blocks. At the start of each trial, the word “short” or “long” was presented for 1s in the middle of the screen to indicate the delay time between the predictive cue and the target image, either 1s or 9s. Next the predictive cue
16 | P a g e was shown at the center of the screen for 1s, followed by the blank screen for the delay period.
Then the target image was shown for 2s, and in turn replaced by the response screen. The subject had maximally 6s to evaluate the food image by bending the joystick to move the cursor on the evaluation bar from -10 to 10. The bending angle was used to indicate the evaluation score. After the response was made, there was a blank screen for 2s as inter-trial interval (ITI).
Different icons were used for the predictive cues to indicate the outcome, either appetitive or aversive, whereas the color indicated the reliability level of the cue, either 100%
or 50% reliability. The color assignment was counterbalanced across subjects. The reliability of the predictive cue was further indicated numerically in percentage, presented in small print beneath the icon.
The subjects were instructed to give their evaluation for each food image, focusing on the appeal of the image, not their general preference of the pictured food item. The evaluations had to be given on a continuous rating scale from -10 to 10, with a value of -10 for a maximally disgusting food image, a value of +10 for a maximally attractive food image, and a value of 0 for a food image that was neither likeable nor disgusting. The subjects were instructed to start bending the joystick for evaluation only after the evaluation bar appeared on the screen.
It was explained to the subjects that the cues predicted whether the upcoming food image would be likeable or dislikeable, with different levels of certainty, either 100% certain or 50%.
Before the experimental session, the subjects were given the opportunity to practice controlling the joystick for up to 30 times. The experiment included 180 trials, consisting of 15 repetitions of each of the 12 conditions, with 3 levels Cue Type (Certain, Valid, Invalid), 2 levels of Outcome Type (Positive, Negative), and 2 levels of Delay Time (1s, 9s). No food
17 | P a g e image was presented more than once. The 180 trials were presented in pseudorandom order to ensure that each block of 60 trials contained 5 repetitions of each condition.
Experiment 2.
Participants were asked to evaluate 200 naturalistic food images in 4 consecutive blocks of 50 trials with breaks of not more than 5 minutes between the blocks. The procedures were the same as in Experiment 1 except for the following. The delay time between the predictive cue and the food image was fixed at 2s; and no word cue was given to indicate the delay time at the beginning of the trial. The cue reliability for the positive and negative cues was fixed at 75%, and a third type of cue was included (a neutral cue, represented by a checkerboard as icon).
The evaluation bar assignment was changed for 2 groups of subjects, with either a conventional alignment (negative – left; positive – right) or the opposite alignment. Here, subjects were asked to confirm their evaluation by clicking the trigger on the joystick.
The experiment included 200 trials, divided into 6 conditions, with 3 levels Cue Type (Valid 75%, Neutral, Invalid 25%) and 2 levels of Outcome Type (Positive, Negative). The Valid 75% conditions consisted of 60 repetitions, whereas the Invalid 25% and the Neutral conditions each consisted of 20 repetitions (see details in Appendix A2). No food image was presented more than once. The 200 trials were presented in pseudorandom order to ensure that each block of 50 trials contained the same distribution of trials per condition.
18 | P a g e Results
Experiment 1
In Experiment 1, in addition to the variations of cue types and food images, we manipulated the delay between the predictive cue and the target food image to examine whether the prior expectations strengthen over time (Iigaya et al., 2016; Loewenstein, 1987). If so, any influences from the predictive cues on the evaluative processing of the food images should be larger after long delays than after short delays.
For each subject, the data could be classified into 12 conditions by the type of outcome, the delay time and the type of predictive cue. There were two types of outcome, either positive or negative, and two levels of delay time, either 1s or 9s between predictive cue and target image. For the predictive cues, there were three types defined by the relationship between the predictive information and the actual outcome; a cue with 100% reliability was labeled as
“Certain”; a cue with 50% reliability followed by the predicted outcome was labeled as “Valid 50%”; and a cue with 50% reliability followed by the opposite outcome was labeled as “Invalid 50%”.
Evaluation scores.
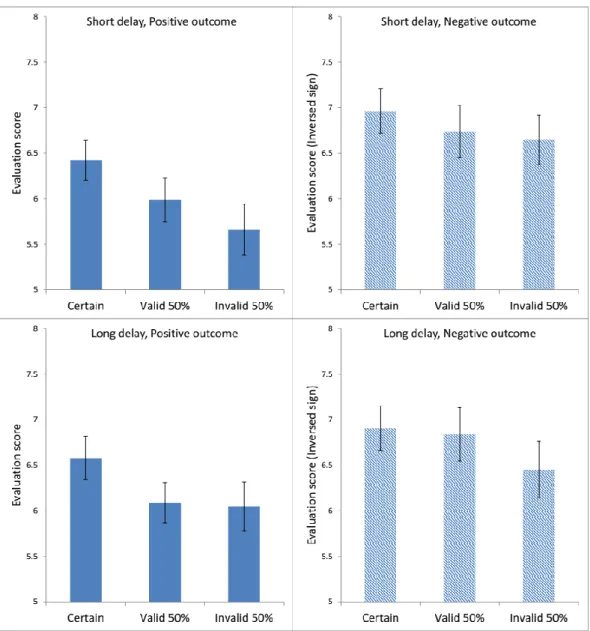
In order to facilitate the comparison across conditions, for negative outcomes the sign of the given evaluation score was inversed. Figure 4 presents the average evaluation scores in each condition for Experiment 1. Regardless of outcome type and delay time, the evaluation scores appeared to be the highest for the Certain condition, and the lowest for the Invalid 50%
condition. Negative outcomes appeared to be rated more extremely than positive outcomes.
For statistical analysis of the average evaluation scores, we employed a three-factor analysis of
19 | P a g e variance (ANOVA) with repeated measures, in which the factors Outcome Type, Delay Time, and Cue Type were all within subjects.
Figure 4. Average ratings in each condition in Experiment 1. Each panel shows data for Certain, Valid 50%, and Invalid 50% conditions. The top two panels are from the short-delay conditions; the bottom two panels from the long-delay conditions. The left two panels present the positive-outcome conditions; the right two panels, the negative-outcome conditions. The signs were inversed for the ratings in the negative outcome conditions in order to facilitate comparison with the positive outcome conditions. The error bars show the standard error of the mean in each condition.
The ANOVA produced a significant main effect of Cue Type, F(2,82) = 6.560,MSE = 1.716, ηp2 = 0.138, p < 0.005, as well as a significant main effect of Outcome Type, F(1,41) =
20 | P a g e 4.906, MSE = 10.073, ηp2 = 0.107, p < 0.05. There was no significant effect of Delay Time, F(1,41) = 1.068, MSE = 0.792, p = 0.307. Post-hoc pairwise comparisons using the Bonferroni test indicated that the average evaluation scores in the Certain condition were significantly higher than in the Valid 50% condition at p < 0.05, and also significantly higher than in the Invalid 50 % condition at p < 0.05. The difference between the Valid 50% and the Invalid 50%
condition was not significant, p = 0.274.
There was a significant interaction between Delay Time and Outcome Type, F(1,41) = 4.385, MSE = 0.503, ηp2 = 0.097, p < 0.05. Post-hoc comparisons using the Bonferroni test showed, for short-delay trials, significantly more extreme evaluation scores for negative outcomes than for positive outcomes at p < 0.05, whereas in long-delay trials there was no significant difference between positive and negative outcomes, p = 0.653. There were no other significant interactions (all F values less than 2).
Manual response times
Response times were measured from the onset of the screen with the evaluation bar until a bend was detected in the joystick. By this definition, all trials in which the subject started bending the joystick before the onset of the screen with the evaluation bar were excluded from the analysis. For this reason, a total of 9.93% of all trials was rejected for the response time analysis. Two subjects started bending the joystick prematurely in every trial in some conditions; the data from these two subjects were excluded from the ANOVA analysis on response time.
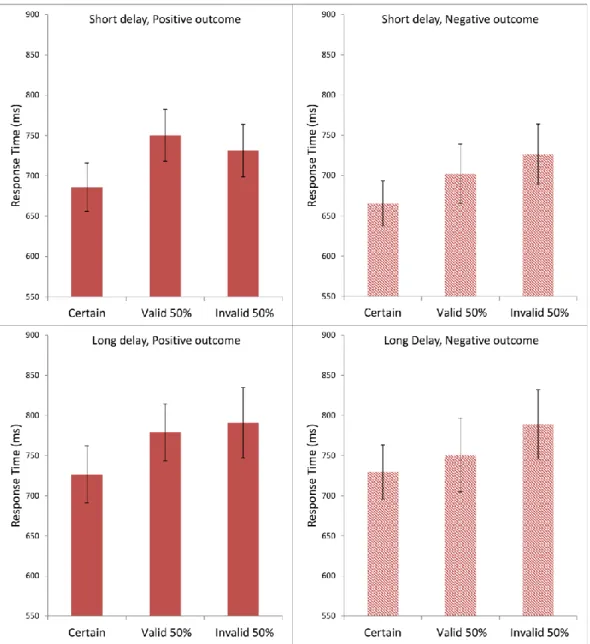
Figure 5 presents the subjects’ average response times in Experiment 1, using the same format as for the evaluation scores in Figure 4. Visual inspection suggested that the response
21 | P a g e times tended to be the fastest in the Certain condition and the slowest in the Invalid 50%
condition.
Figure 5. Average response times (ms) in each condition in Experiment 1. Each panel shows data for Certain, Valid 50%, and Invalid 50% conditions. The top two panels are from the short- delay conditions; the bottom two panels from the long-delay conditions. The left two panels present the positive-outcome conditions; the right two panels, the negative-outcome conditions.
The error bars show the standard error of the mean in each condition.
Preliminary normality tests (Shapiro-Wilk) showed significant deviations from normality in the response times. For this reason, the subsequent statistical analysis of response times was conducted on a simple inverse transformation (1/RT) (Whelan, 2008), which yielded
22 | P a g e normal distributions. Statistical analysis, with a three-factor repeated measures ANOVA, completely within subjects, produced a significant main effect of Cue Type, F(2,78) = 9.163, MSE = 0.045, ηp2 = 0.190, p < 0.001, and also of Delay Time, F(1,39) = 34.061, MSE = 0.039, ηp2 = 0.466, p < 0.001. Outcome Type did not have a significant effect on the response time F(1,39) < 1. Post-hoc comparisons using the Bonferroni test indicated that the average response time in the Certain condition was significantly faster than in the Valid 50% condition at p <
0.01, and also significantly faster than in the Invalid 50% condition at p < 0.01. The difference between the Valid 50% and the Invalid 50% condition was not significant, p = 0.802.
There were no significant interactions (all F values less than 1.5).
Gaze distribution data
In order to examine whether the predictive cues elicited an anticipatory response bias, we analyzed the average gaze positioning during the delay period. A response bias should lead the subjects’ gaze positions to deviate toward the direction associated with the predicted outcome (in Experiment 1: negative – left, positive – right). This analysis of gaze positioning is focused on the blank screen period before target onset; at this time, before the outcome is known, the cue conditions can only be separated between 100% reliable and 50% reliable. In this analysis, then, the data were classified into eight conditions according to Delay Time (1s or 9s), Cue Valence (either positive or negative) and Cue Reliability (50% or 100%). For each subject in each condition, the average horizontal eye position was calculated during the delay relative to the blank screen.
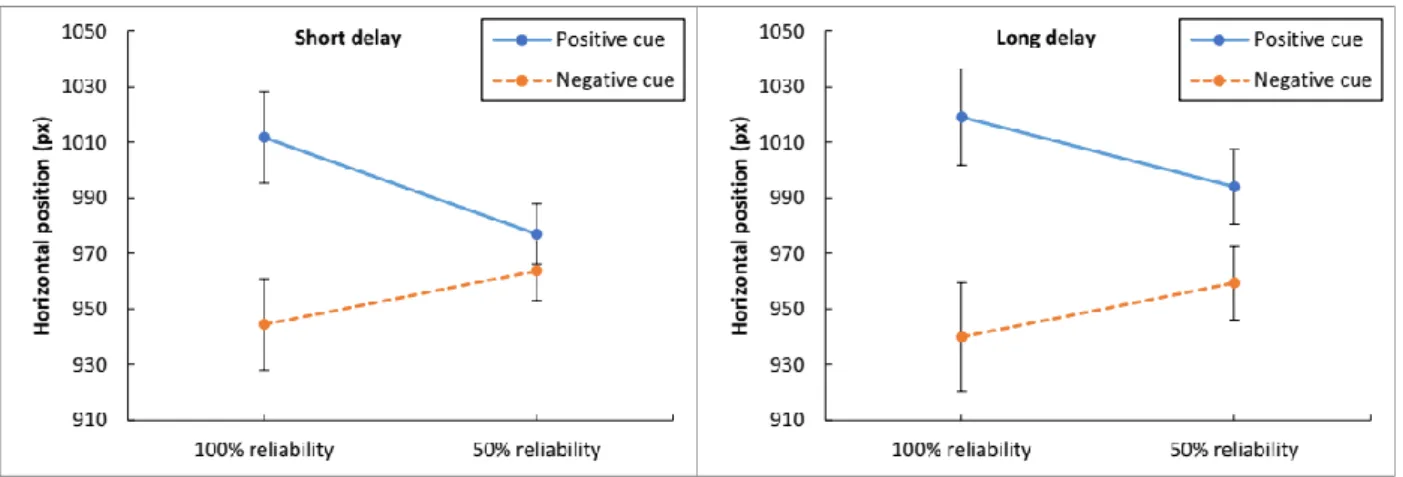
23 | P a g e Figure 6. Average horizontal eye positions during the delay period in Experiment 1, as a function of delay duration, cue reliability, and cue valence. The Y-axis represents the horizontal position on the screen (the screen width is set to 1920 pixels). The left panel shows the data for the short-delay trials; the right panel, for the long-delay trials. The conditions with positive cues are shown in blue; with negative cues, in orange. The error bars represent the standard error of the mean.
Figure 6 presents the average horizontal eye positions during the delay as a function of condition in Experiment 1. For both delay durations, the average horizontal eye positions appeared to be shifted to the left or right depending on the cue valence, with more pronounced biases for 100% reliable cues and for longer delays.
A three-factor repeated measures ANOVA indicated that Cue Valence produced a statistically significant effect on the average horizontal eye positions, F(1, 41) = 6.937, MSE = 28559.298, ηp2 = 0.145, p < 0.05. Delay Time, F(1, 41) < 1, and Cue Reliability, F(1, 41) = 3.297, MSE = 714.375, p = 0.077, did not produce a significant effect on the gaze positioning.
There was a significant interaction between Cue Valence and Delay Time, F(1, 41) = 6.402, MSE = 906.995, ηp2 = 0.135, p < 0.05, and also between Cue Valence and Cue Reliability, F(1, 41) = 7.213, MSE = 7051.153, ηp2 = 0.150, p = 0.010. There were no other interaction effects (the remaining F values < 1). Overall, the gaze positioning showed significant response biases associating positive cues with the rightward direction, negative cues
24 | P a g e with the leftward direction. These biases were particularly pronounced for long delays and 100% reliable cues.
Experiment 2
In Experiment 2, we investigated further the effect of the reliability level of the predictive cues, as well as the response bias observed in the gaze positioning. One concern with the response bias was that in the previous experiment, we employed only one fixed scheme of mapping between spatial position and response (negative – left; positive – right). To ensure that the response bias followed from the prediction rather than any inherent spatial bias, we counterbalanced the mapping between spatial position and response across subjects in Experiment 2. Thus, we divided the subjects into two groups; one group was always presented with the default evaluation bar (as in Experiment 1; negative – left; positive – right); and the other group was always presented with a flipped evaluation bar (positive – left; negative – right).
With respect to cue reliability, instead of using certain versus random cues, in Experiment 2 we set a fixed reliability of 75% for both positive and negative cues, and further included a neutral cue type (a checkerboard, without positive or negative framing). Finally, in Experiment 2 the delay time was fixed at 2s.
Thus, there were 12 conditions, with one between-subjects factor, Evaluation Bar (default versus flipped), and two within-subjects factors, Outcome Type (positive or negative) and Cue Type. For the Cue Type, there were three types defined by the relationship between the predictive information and the actual outcome; cues followed by the predicted outcome were labeled as “Valid 75%”; cues followed by an outcome opposite to the prediction were labeled as “Invalid 25%”; and cues that did not predict an outcome were labeled as “Neutral”.
25 | P a g e Evaluation scores
As before, for negative outcomes the sign of the given evaluation score was inversed.
Figure 7 presents the average evaluation scores in each condition for Experiment 2. The predictions appeared to affect the evaluation scores for positive outcomes, but not for negative outcomes. For positive outcomes, the effects of the predictions again suggested spill-over rather than updating. For statistical analysis of the average evaluation scores, we employed a three-factor analysis of variance (ANOVA) with repeated measures, in which the factors Outcome Type and Cue Type were within subjects, whereas the factor Evaluation Bar was between subjects.
The ANOVA produced a statistically significant main effect of Outcome Type, F(1,64)
= 10.071, MSE = 6.654, ηp2 = 0.136, p < 0.005. The main effect of Cue Type was not statistically significant, F(2,128) = 2.934, MSE = 0.815, p = 0.057, nor was that of the between- subjects factor Evaluation Bar, F < 1.
There was a statistically significant interaction between Cue Type and Outcome Type in the average evaluation scores, F(2,128) = 7.120, MSE = 0.403, ηp2 = 0.100, p < 0.005. Post- hoc pairwise comparisons, with the Bonferroni test, showed that for negative outcomes, there were no significant effects of cue type, whereas for positive outcomes, the average evaluation scores in the Valid 75% condition were significantly higher than those in the Invalid 25%
condition at p < 0.05, and significantly higher than those in the Neutral condition at p < 0.001.
There were no two-way or three-way interactions with the between-subjects factor Evaluation Bar (all F values < 1).
26 | P a g e Figure 7. Average ratings in each condition in Experiment 2. Each panel shows data for Valid 75%, Neutral, and Invalid 25% conditions. The top two panels show data from participants who used the Default Evaluation Bar; the bottom two panels are from participants who used the Flipped Evaluation Bar. The left two panels present the positive-outcome conditions; the right two panels, the negative-outcome conditions. The signs were inversed for the ratings in the negative outcome conditions in order to facilitate comparison with the positive outcome conditions. The error bars show the standard error of the mean in each condition.
27 | P a g e Figure 8. Average response times (ms) in each condition in Experiment 2. Each panel shows data for Valid 75%, Neutral, and Invalid 25% conditions. The top two panels show data from participants who used the Default Evaluation Bar; the bottom two panels are from participants who used the Flipped Evaluation Bar. The left two panels present the positive-outcome conditions; the right two panels, the negative-outcome conditions. The error bars show the standard error of the mean in each condition.
Manual response times
In order to prevent a loss of data due to premature bending of the joystick, in Experiment 2 the response method was modified by requiring the subjects to press the button
28 | P a g e on the joystick with their index finger for confirmation. Thus, response time was defined as the time between the onset of the response screen and the button press on the joystick. Figure 8 presents the average response times in each condition in Experiment 2, using the same format as Figure 7. Overall the Valid 75% conditions appeared to produce the fastest response times, particularly for positive outcomes.
As in Experiment 1, preliminary normality tests (Shapiro-Wilk) showed significant deviations from normality in the response times; the subsequent statistical analysis was conducted on the inverse response times, which yielded normal distributions. A three-factor repeated measures ANOVA produced a significant main effect of Outcome Type, F(1,64) = 4.531, MSE = 0.118, ηp2 = 0.066, p < 0.05. The factor Cue Type did not produce a significant main effect, F(2,128) = 2.605, MSE = 0.033, p = 0.078, nor did the between-subjects factor Evaluation Bar, F < 1. There was a statistically significant interaction between Cue Type and Outcome Type, F(2,128) = 3.905, MSE = 0.030, ηp2 = 0.058, p < 0.05. Post-hoc pairwise comparisons using the Bonferroni test showed that, for positive outcomes, there was a significant difference between the Valid 75% condition and the Invalid 25% condition at p <
0.01, but not between the Valid 75% and the Neutral conditions, p = 0.056, nor between the Neutral and the Invalid 25% conditions, p = 0.530. Conversely, for negative outcomes, there were no significant differences as a function of Cue Type (all p values above 0.7).
There was no significant interaction between Cue Type and the between-subjects factor Evaluation Bar, F(2,128) = 2.771, MSE = 0.033, p = 0.066, nor between Outcome Type and Evaluation Bar, F<1 . The three-way interaction was also not significant, F(2,128) = 1.796, MSE = 0.030, p = 0.170.
29 | P a g e Gaze distribution data
As in Experiment 1, we analyzed the gaze positioning during the delay period in Experiment 2 to examine whether the predictive cues elicited a response bias. In this analysis, focused on the blank screen period before target onset (i.e., when the outcome is not yet known), the data were classified into six conditions by the between-subjects factor Evaluation Bar (default or flipped) and the within-subjects factor Cue Type (either positive, neutral, or negative). For each subject in each condition, the average horizontal eye position was calculated during the delay relative to the blank screen.
Figure 9. Average horizontal eye positions during the delay period in Experiment 2, as a function of the type of cue and evaluation bar. The Y-axis represents the horizontal position on the screen (the screen width is set to 1920 pixels). The data with the Default Evaluation Bar are shown in blue; with the Flipped Evaluation Bar, in orange. The error bars represent the standard error of the mean.
Figure 9 presents the average horizontal eye positions during the delay as a function of condition in Experiment 2. The data appeared symmetrical for the two groups of subjects, suggesting that the gaze positioning flipped as a function of evaluation bar alignment,
30 | P a g e implementing response biases (toward the negative or positive pole depending on the prediction).
In the subsequent ANOVA, in order to facilitate the comparison with different evaluation bar alignments, we used the inverse of the horizontal eye position data in the flipped evaluation bar condition; that is, we subtracted the given horizontal eye positions from the maximal horizontal pixel value (1920). This procedure aligns the horizontal eye position data of the two groups in the same direction, so that any response biases yield similar numerical values across the evaluation bar conditions.
A repeated measures ANOVA confirmed that the within-subjects factor Cue Type had a statistically significant impact on the gaze positioning during the blank screen period, F(2,128) = 40.023, MSE = 257.261, ηp2 = 0.385, p < 0.001. Post-hoc pairwise comparisons using the Bonferroni test showed that there were statistically significant differences in the average horizontal eye positions at p < 0.001 for all pairwise comparisons among the three cue types. The horizontal eye positions leaned most toward the positive pole following positive cues (M = 967.992, SD = 7.872), and most toward the negative pole following negative cues (M = 943.061, SD = 6.667), implying more central positioning after neutral cues (M = 954.169, SD = 6.726).
Also the between-subjects factor Evaluation Bar produced a significant effect on the average horizontal eye positions, F(1,64) = 18.088, MSE = 9495.071, ηp2 = 0.220, p < 0.001.
However, there was no interaction between Cue Type and Evaluation Bar, F(2,128) = 2.493, MSE = 257.261, p = 0.087.
31 | P a g e Discussion
Two experiments were conducted to examine the effects of predictive cues on the evaluation of single food images. The experiments pitched the congruent bias hypothesis, as a function of framing (Cunningham et al., 2008; Iigaya et al., 2016; Jin et al., 2017; Levin et al., 1985; Loewenstein, 1987; Tversky & Kahneman, 1981; Wilson et al., 1989) or more implicit processes (e.g., priming or emotional contagion) (Bargh, 2006; Cartoni et al., 2016; Dalenberg et al., 2014; Geurts et al., 2013; Howard & Gengler, 2001; Morales & Fitzsimons, 2007; Stöckli et al., 2016; Wright et al., 2018), against the opponent mechanism hypothesis, derived from the concepts of proactive control (Amodio & Swencionis, 2018; Cheng et al., 2014; Geers &
Lassiter, 1999; Stamos et al., 2018; van Wouwe et al., 2009) and prediction error (Berridge, 2007; O’doherty, 2012; Schultz, 2013; Schultz et al., 1997). In Experiment 1, we found that the evaluation scores were influenced by the predictive cues, such that 100% reliable cues produced more extreme scores than 50% reliable cues, both for aversive and for appetitive food images, suggesting the operation of a congruent bias. The response times showed slower responses following 50% reliable cues than following 100% reliable cues, further implicating a selective response preparation in line with the predictions. Gaze prepositioning during the delay period, after prediction but before the food image, also suggested a response bias in accordance with the predictions.
Experiment 2 provided corroborating evidence, again showing that the evaluation scores were influenced by the predictive cues, with 75% reliable cues leading to more extreme scores for correct predictions than for incorrect predictions, suggesting congruent bias effects, particularly in the case of appetitive food images. Once again, the response times showed slower responses following incorrect predictions than following correct predictions, indicating that prior expectation guided the selective response preparation. Gaze prepositioning during
32 | P a g e the delay period also exhibited a response bias in accordance with the predictions, regardless of the spatial alignment of positive versus negative poles.
Positive predictive cues elicited an anticipatory process that set up a congruent response bias, leading to gaze prepositioning in the spatial direction associated with the positive pole of the evaluation bar. This response bias caused appetitive images to be evaluated more positively while (in case of erroneous prediction) causing aversive images to be evaluated less negatively.
Conversely, the opposite processes occurred for negative predictions. Crucially, these anticipatory processes and response biases reflected active inferences (Friston, 2010; Hohwy, 2013), depending on the perceived reliability of the predictive cues, with stronger effects for more reliable cues.
Taken together, both experiments provided solid evidence in favor of the congruent bias hypothesis. As a corollary, the data charted how external influences from prior (“objective”) information can have a significant impact on subsequent (“subjective”) evaluative processing, underscoring the potential importance of this line of research for other domains of value-based decision-making (e.g., in politics and bioethics).
Congruent Bias as an Active Process toward Confirmation
Several elements in the data suggested a role for active, deliberative processing in response to the predictive information rather than merely effects from automatic associations.
The effects of cue reliability on evaluation scores suggested voluntary control of expectation.
In Experiment 1, the congruent bias was large following cues with 100% reliability, but there was no significant difference between the 50% Valid and 50% Invalid condition. In Experiment 2, the 75% reliable cues did have an impact on the evaluation scores, particularly for positive outcomes (with more extreme scores in the 75% Valid condition than in the 25% Invalid
33 | P a g e condition). The pattern of data suggested that the subjects set their expectations based on the perceived reliability of the predictive cues – strongly for highly reliable cues, somewhat for reasonably reliable cues, and not so much for unreliable cues. Most likely, this was due to actively controlled usage of the predictive cues.
Here, it should be noted that the active processing of predictive information does not necessarily preclude the existence of concurrent, more implicit types of interference. A useful approach in this regard, compatible with the concept of framing (Cunningham et al., 2008;
Iigaya et al., 2016; Jin et al., 2017; Levin et al., 1985; Loewenstein, 1987; Tversky &
Kahneman, 1981; Wilson et al., 1989), may be that of the somatic marker hypothesis (Bechara, Damasio, & Damasio, 2000; Damasio, 1996; Verweij, Senior, Domínguez, Juan, & Turner, 2015). Applying this hypothesis to the current data, we might suggest that the covert action of
“marker” signals underpinned the introduction of a congruent bias in the selection of an aversive or appetitive mode of processing. Importantly, this hypothesis contends that it is erroneous to limit human decision-making to mechanisms of either conditioning alone or cognition alone. Thus, while the concurrent operation of conditioning cannot – should not – be excluded, the relevant point here is that the cue reliability determined the degree of impact from predictive information. This finding implicates cognitive control and active processing.
Apart from the dependence of evaluative processing on the reliability of the predictions, two further aspects of the data suggest that the impact of external influences was mediated via active, cognitive control. Notably, the gaze prepositioning indicated a selective preparation aligned with the expected direction of response. This gaze prepositioning was likewise sensitive to the cue reliability, with more pronounced prepositioning for more reliable predictive cues. Also, the response times indicated that the evaluative processing was more effortful following incorrect predictions than following correct predictions, again suggesting
34 | P a g e an active form of inference relative to the earlier prediction. Once more, the effects on response times depended on the reliability of the predictive cues.
The effortful, slower evaluative processing following incorrect predictions produced less extreme scores than the faster evaluative processing following correct predictions. For instance, an appetitive food image presented after a positive cue tended to quickly receive a highly positive evaluation, whereas an appetitive food image presented after a negative cue tended to receive a less positive evaluation after a longer deliberation, as if the subject tried to accommodate the prediction (finding something negative in the image, or trying to attenuate the discrepancy between prediction and outcome by reducing the evaluation). This may be thought of as an active attempt to assimilate a surprising stimulus to a prior expectation (Davidenko et al., 2018). Interestingly, there appeared to be an asymmetry, particularly in Experiment 2, with 75% reliable cues showing influences from prediction on the evaluation of appetitive images, but not on the evaluation of aversive images. This suggests that, relatively speaking, the evaluative processing of appetitive images is more vulnerable to external influences. Negative predictions tend to distort the reception of appetitive images, whereas aversive images appear to be more immune to positive framing.
In conclusion, the predictions produced a congruent response bias that can best be characterized as an active confirmation bias. Depending on the perceived reliability, positive predictive cues elicited an active positive anticipation of the food images, whereas negative cues elicited an active – and relatively stronger – negative anticipation. Correct predictions produced quick and amplified evaluation scores. Erroneous predictions produced slow and less extreme evaluation scores in an apparent effort to accommodate the prediction.