九州大学学術情報リポジトリ
Kyushu University Institutional Repository
Differences in magnetic resonance findings between symptomatic and asymptomatic pre- collapse osteonecrosis of the femoral head
畑中, 敬之
https://doi.org/10.15017/2348701
出版情報:九州大学, 2019, 博士(医学), 課程博士 バージョン:
権利関係:
Contents lists available atScienceDirect
European Journal of Radiology
journal homepage:www.elsevier.com/locate/ejrad
Research Article
Di ff erences in magnetic resonance fi ndings between symptomatic and asymptomatic pre-collapse osteonecrosis of the femoral head
Hiroyuki Hatanaka, Goro Motomura
⁎, Satoshi Ikemura, Yusuke Kubo, Takeshi Utsunomiya, Shoji Baba, Koichiro Kawano, Yasuharu Nakashima
Department of Orthopaedic Surgery, Graduate School of Medical Sciences, Kyushu University, 3-1-1, Maidashi, Higashi-ku, Fukuoka 812-8582, Japan
A R T I C L E I N F O
Keywords:
Osteonecrosis Pre-collapse Bone marrow edema
A B S T R A C T
Purpose:The purpose of this study was to assess the differences in magnetic resonance (MR)findings between the symptomatic and asymptomatic pre-collapse stage of osteonecrosis of the femoral head (ONFH).
Materials and methods:This study reviewed 123 consecutive hips in 91 patients in the pre-collapse stage of ONFH based on plain radiographicfindings. These 123 hips were divided into symptomatic and asymptomatic groups according to the pain domain score in the Harris hip score system. Bone marrow edema (BME), synovialfluid effusion, and subchondral fracture were evaluated using MR imaging. Odds ratios (ORs) were calculated be- tween these three parameters and symptoms. The subsequent clinical course after MR examination was also assessed for each hip that could be followed more than 1 year.
Results:Forty-six hips (37.4%) were categorized as symptomatic and 77 hips (62.6%) as asymptomatic. The prevalence of BME, synovialfluid effusion, and subchondral fracture were 87.0% (40/46), 80.4% (37/46), and 34.8% (16/46), respectively, in the symptomatic group, and 0%, 28.6% (22/77), and 0%, respectively, in the asymptomatic group, indicating significant differences between the two groups (p < 0.0001). Among these parameters, BME showed the highest OR with regard to the presence or absence of symptoms (BME, 965.8; joint effusion, 10.3; subchondral fracture, 83.9). Due to persistent pain and subsequent collapse, 30 of 35 (85.7%) symptomatic hips with BME subsequently underwent surgical treatment at a mean interval of 3.47 months after MR examination, while 25 of 66 (37.9%) asymptomatic hips without BME underwent surgical treatment at a mean interval of 20.7 months after MR examination.
Conclusions:This study demonstrated that symptomatic pre-collapse ONFH diagnosed based on plain radio- graphicfindings could be distinguished from asymptomatic pre-collapse ONFH by the presence of BME on MR imaging, and thus BME may be a sign of occult fracture.
1. Introduction
The treatment strategy of osteonecrosis of the femoral head (ONFH) is generally decided based on the disease stage, and the success of treatment usually depends on the accuracy of stage classification [1].
Currently, the Ficat and Arlet, Association Research Circulation Osseous (ARCO), and Japanese Investigative Committee (JIC) systems are widely used for stage classification [2–4]. These systems broadly dis- tinguish between the pre- and post-collapse stages based on the shape of the femoral head on plain radiographicfindings. However, it is often
difficult to assess the pre- or post-collapse stage when there are only minute radiographic changes in the contour of the femoral head.
Therefore, the insufficient reproducibility of stage classification has been pointed out [1].
The pre-collapse stage of ONFH is generally considered to be nearly asymptomatic, and the condition is therefore oftenfirst diagnosed ret- rospectively during detailed examination of the contralateral hip in patients with symptoms [5]. Persistent hip pain in ONFH patients is generally thought to be due to subchondral fracture and subsequent femoral head collapse in the post-collapse stage [6], but in many studies
https://doi.org/10.1016/j.ejrad.2019.01.002 Received 25 October 2018; Accepted 3 January 2019
Abbreviations:ONFH, osteonecrosis of the femoral head; MR, magnetic resonance; BME, bone marrow edema
⁎Corresponding author at: Department of Orthopaedic Surgery, Graduate School of Medical Sciences, Kyushu University, 3-1-1, Maidashi, Higashi-ku, Fukuoka 812-8582, Japan.
E-mail addresses:[email protected](H. Hatanaka),[email protected](G. Motomura),
[email protected](S. Ikemura),[email protected](Y. Kubo),[email protected](T. Utsunomiya), [email protected](S. Baba),[email protected](K. Kawano),[email protected](Y. Nakashima).
0720-048X/ © 2019 Elsevier B.V. All rights reserved.
T
treatment was performed for symptomatic ONFH despite it being classified as the pre-collapse stage [7–11]. In current classification systems, staging is independent of symptoms, and therefore both painful and asymptomatic hips have been generally classified as the pre-collapse stage if the spherical shape of the femoral head is main- tained without apparent subchondral fracture on radiographs. How- ever, grouping symptomatic and asymptomatic pre-collapse stage of ONFH together may complicate evaluations of treatment outcomes.
Magnetic resonance (MR) imaging is a more sensitive examination than radiographs to evaluate the state of the femoral head in ONFH because of its multiplanar imaging capability and the ability to directly image the condition of bone marrow [12]. Bone marrow edema (BME), subchondral fracture, and increased synovial fluid are known to be concomitant and characteristic MR findings in post-collapse ONFH [13–18]. Kim et al. reported that BME was seen most often in stage 3 (post-collapse stage), with high rates of concomitant hip pain, and was not observed in the early stages of disease [14]. Meier et al. also re- ported a strong correlation between subchondral fracture and BME in the post-collapse stage of ONFH [16]. On the other hand, several au- thors reported that the appearance of a band pattern without BME was a characteristic initial MRfinding in the early stage of ONFH [14,18].
Thus, it has been strongly suggested that MRfindings in ONFH differ between hips before and after collapse.
To the best of our knowledge, no studies have investigated which MR differences can distinguish between the presence and absence of hip pain in the radiologically determined pre-collapse stage of ONFH. The purpose of this study was to assess whether there are differences in MR findings between symptomatic and asymptomatic patients with the pre- collapse stage of ONFH.
2. Materials and methods 2.1. Patient selection
Ethical approval by the institutional review board was obtained for this retrospective study, and the requirement for informed consent was waived. From January 2010 to March 2016, 386 hips in 250 patients were newly diagnosed with ONFH at our institution. All patients un- derwent X-ray imaging (anteroposterior and lateral two-dimensional radiographs) and MR imaging, and were diagnosed based on the pre- viously reported criteria for osteonecrosis [3]. Hip diseases with radi- ologicalfindings similar to ONFH, including transient osteoporosis of the hip and insufficient subchondral fracture, were excluded based on the rigorous MR diagnostic feature of ONFH: a smooth, low-intensity band that is concave to the articular surface and circumscribes all ne- crotic segments. Contrast-enhanced MR imaging was also performed in cases where the diagnosis of ONFH was difficult [19]. Based on two- dimensional (anteroposterior and lateral) radiographs of hip joints at thefirst diagnosis, the 386 hips were divided into 162 hips with the pre- collapse stage of ONFH and 224 hips with the post-collapse stage of ONFH. Of the 162 hips with the pre-collapse stage, 39 were excluded because MR examination was performed more than 1 month after the examination of the initial radiographs. Finally, we retrospectively re- viewed 123 hips in 91 patients with the pre-collapse stage of ONFH (Fig. 1). The patients with the pre-collapse stage included 51 males (73 hips) and 40 females (50 hips) with a mean age of 43.1 years (14–76 years). Their body mass index (BMI) was 23.1 kg/m2 (15.2–33.9 kg/
m2). Regarding the factors associated with ONFH, 51 patients (71 hips) had a history of steroid administration, 26 patients (34 hips) had a history of alcohol abuse, 5 patients (6 hips) had both histories (steroid and alcohol use), and 9 patients (12 hips) had no relevant history (idiopathic). Regarding the localization of the necrotic lesion according to the JIC classification, 16 hips were classified as Type A (the necrotic lesion occupies the medial one-third or less of the weight-bearing portion), 21 hips as Type B (the medial two-thirds or less of the weight- bearing portion), 54 hips as Type C1 (more than two-thirds of the
weight-bearing portion but not extending to the acetabular rim), and 32 hips as Type C2 (more than two-thirds of the weight-bearing portion and extending to the acetabular rim) [3].
2.2. Evaluation of symptomatic and asymptomatic hips
According to the pain domain score in the Harris hip score [20] at the time of initial medical examination, 123 hips with the radiological pre-collapse stage of ONFH were divided into symptomatic or asymp- tomatic hips. Patients with 30 or fewer points (mild pain, no effect on common activities, rare moderate pain with unusual activity) were classified as symptomatic, and patients with 40 or 44 points were classified as asymptomatic.
2.3. Definition of pre-collapse on radiographs
The pre-collapse stage of ONFH was defined when both of the fol- lowing two conditions were met (Fig. 2). First, the contour of the fe- moral head maintained a spherical shape. In detail, a spherical shape was defined when no point on the circumference of a perfect circle centered on the femoral head was farther than 1 mm from the contour of the actual articular surface, on both anteroposterior and lateral radiographs. The second condition was that no crescent sign was seen within the femoral head. The radiological evaluation was conducted using the Image J software program (National Institutes of Health, Bethesda, MD, USA), which can measure length on radiographs in 0.1- mm units. Definition of pre-collapse was made blindly by two authors (H.H and Y.K) who had extensive experience in the diagnosis of ONFH.
If both authors made different judgments, the case was considered to represent the post-collapse stage of ONFH.
2.4. MR imaging evaluations
Patients with the pre-collapse stage of ONFH underwent MR ex- amination at our institution using a 1.5-T or 3-T MR system (Achieva;
Philips Medical Systems, Best, The Netherlands) within a month after thefirst radiographic examination. The mean duration between radio- graph and MR examination was 12.5 days (0–31 days). Coronal and oblique axial planes on T1-weighted images (TR/TE: 400–600/
8–19 ms) and fat-suppressed T2-weighted images (TR/TE: 3000–4000/
80–108 ms) were obtained in the supine position with 5-mm slice thickness, 1-mm inter-slice gap, andfield of view of 360 × 360 mm.
Three parameters (Fig. 3), namely BME, synovialfluid effusion, and subchondral fracture, were evaluated on all slices. Positive BME was defined when a diffuse, low-signal intensity area on T1-weighted images with a corresponding high-signal intensity on fat-suppressed T2- weighted images was seen around the femoral head and neck beyond the necrotic lesion [13,14,21,22]. Synovial joint effusion was con- sidered to be present when it was observed around the femoral neck on fat-suppressed T2-weighted images [17]. Subchondral fracture was defined as positive when an irregular, low-intensity band running parallel to the subchondral bone plate on T1-weighted images was seen along with corresponding bands of low or high signal intensity on fat- suppressed T2-weighted images away from the boundary of the necrotic lesion [14,16]. All MR imaging evaluations were performed by con- sensus of two authors (H.H and Y.K) who had extensive experience in the examination of ONFH.
2.5. Evaluation of clinical course after MR imaging
Using both follow-up radiographs and medical records, the clinical course after MR examination was assessed for each hip that could be followed up for more than 1 year. This evaluation included the presence or absence of apparent femoral head collapse and surgical treatments.
H. Hatanaka et al. European Journal of Radiology 112 (2019) 1–6
2
2.6. Statistical analysis
Statistical analyses were carried out using Fisher’s exact probability test to compare the ratio of three parameters, namely BME, synovial fluid effusion, and subchondral fracture, between symptomatic and asymptomatic hips. Odds ratios (ORs) were also calculated between these three parameters and symptoms. Student'st-test was used to de- termine the association between MRfindings and the period from MR examination until surgery due to persistent pain and subsequent col- lapse. A Kaplan-Meier analysis was performed and survival curves were created with the log-rank test. A value of p < 0.05 was considered to indicate significance. These statistical analyses were performed using JMP statistical analysis software (version 13; SAS Institute, Cary, NC, USA).
3. Results
Forty-six hips (37.4%) were categorized as symptomatic and 77 hips (62.6%) as asymptomatic. On MR, BME was observed in 40 (32.5%) hips, synovial fluid effusion was observed in 59 (48.0%) hips, and subchondral fracture was observed in 16 (13.0%) hips.
As shown inTable 1, the prevalence of BME, synovialfluid effusion, and subchondral fracture were 87.0% (40/46), 80.4% (37/46), and 34.8% (16/46), respectively, in the symptomatic group (Fig. 4), and 0%
(0/77), 28.6% (22/77), and 0% (0/77), respectively, in the asympto- matic group (Fig. 5). The prevalence of these three parameters were significantly higher in the symptomatic group than in the asymptomatic group (p < 0.0001 for all three parameters). Among these parameters, BME showed the highest OR with regard to the presence or absence of hip pain (BME: 965.8, joint effusion: 10.3, subchondral fracture: 83.9) (Table 1). There was a significant relationship between these MRI parameters and the localization of the necrotic lesion (Table 2).
Fig. 1.Flowchart demonstrating selection of patients with the pre-collapse stage of osteonecrosis of the femoral head.
Fig. 2.The pre-collapse stage of osteonecrosis of the femoral head was defined when the distances between OA (O’A’) and OB (O’B’) were both less than 1 mm, and no subchondral fracture line was seen. A or A’: the intersection point of a circle concentric to the femoral head with the line passing through the center of the femoral head (O or O’). B or B’: the intersection point of the articular surface with the line passing through the center of the femoral head.
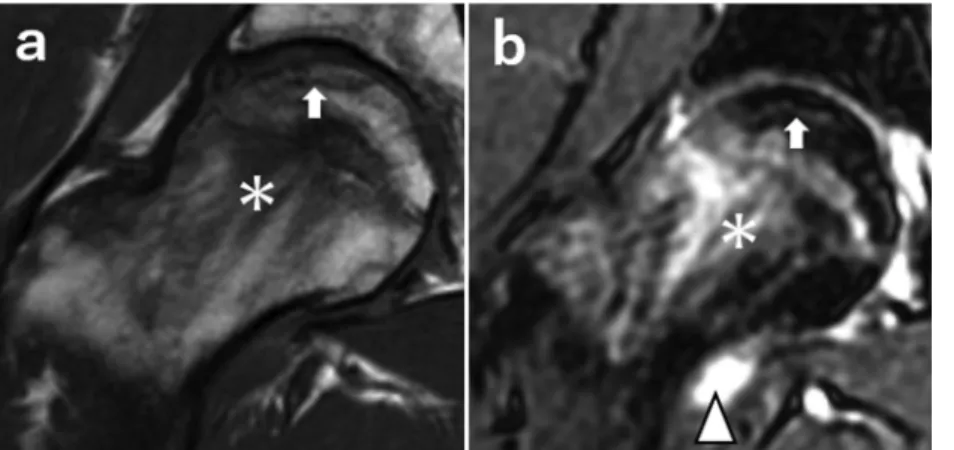
Fig. 3.Coronal T1-weighted MR image (a) and fat-suppressed T2-weighted image (b). BME manifested as a diffuse, low- signal intensity area on T1-weighted images with a corre- sponding high-signal intensity on a fat-suppressed T2- weighted image around the femoral head and neck beyond the necrotic lesion and extending to the intertrochanteric lesion (asterisk). Synovial joint effusion (arrowhead) was defined as positive when it surrounded the femoral neck on a fat-sup- pressed T2-weighted image (b). Subchondral fracture (white arrow) was defined as positive when an irregular, low-in- tensity band running parallel to the subchondral bone plate on a T1-weighted image (a) and corresponding bands of low or high signal intensity on a fat-suppressed T2-weighted image (b) were seen beyond the boundary of the necrotic lesion.
Of the 123 total hips, 106 were followed up for more than 1 year.
Fifty-six hips underwent surgery due to persistent pain with subsequent collapse. Forty-two hips were observed conservatively without radi- ological collapse, and eight were observed conservatively despite con- firmation of a minimal collapse. Due to persistent pain and subsequent collapse, 30 of 35 (85.7%) symptomatic hips with BME subsequently underwent surgical treatment at a mean interval of 3.47 months (SD 4.02) after MR examination, while 25 of 66 (37.9%) asymptomatic hips without BME underwent surgical treatment at a mean interval of 20.7 months (SD 13.9) after MR examination. Of the remainingfive symp- tomatic hips without BME, one hip underwent surgical treatment at 1 month after MR examination. Kaplan-Meier survivorship analysis using the log-rank test showed a significant difference in the survival rate between the BME-positive and -negative groups (Fig. 6).
4. Discussion
Recently, surgical treatments including core decompression with or without stem cell implantation have been increasingly used in the pre- collapse stage of ONFH to prevent femoral head collapse [7–11]. The
“pre-collapse stage”in the currently used ONFH classification systems commonly applies to both symptomatic and asymptomatic hips without anyfindings of femoral head collapse or subchondral fracture on plain radiographs. The current radiograph-based classification is a very convenient method and has been used as a reference when considering the treatment strategy of ONFH, however in the current study, 37.4%
symptomatic cases and 62.6% asymptomatic cases were classified as the same pre-collapse stage despite showing the same radiographical findings. We therefore believe that it would be preferable to define any findings that can more accurately classify these symptomatic and
asymptomatic pre-collapse stage hips.
In the current study, BME was the MR finding that best dis- tinguished symptomatic from asymptomatic pre-collapse stage of ONFH. In addition, pre-collapse hips with BME generally required surgery for subsequent collapse earlier than those without BME.
Although it remains controversial whether or not BME itself can cause hip pain, some studies have proposed that the elevated intramedullary pressure produced by BME is related to hip pain in ONFH [23,24], while other studies have shown that BME on MRfindings is more often seen when painful femoral head collapse has already developed [13,14,18]. Therefore, it seems reasonable to assume that BME on MR occurs secondarily to subchondral fracture and fracture-associated hip pain in radiographically defined pre-collapse ONFH.
The current study also showed that synovialfluid effusion was a commonfinding on MR imaging in the symptomatic pre-collapse stage of ONFH. On the other hand, some asymptomatic hip joints also de- monstrated effusion but none exhibited BME. Considering the fact that joint effusion is seen in some normal asymptomatic hips [17,23,25], we suppose that synovialfluid effusion is not always associated with pain in the pre-collapse stage of ONFH.
This study has several limitations. First, this was a retrospective study. As a result, our analyses were based on routinely performed examinations, namely plain radiographs and MR imaging. Regarding the detection of subchondral fracture, MR imaging is inferior to com- puted tomography due to the ambiguity of the fracture line resulting from diffuse BME [16]. We therefore consider that the prevalence of subchondral fracture in symptomatic pre-collapse ONFH was under- represented in the current study. A prospective analysis should be performed to clarify the association between symptomatic pre-collapse ONFH and subchondral fracture. Second, the presence or absence of hip Table 1
Relationship between hip pain and MR parameters.
Parameters of MRfindings Symptomatic
(n = 46)
Asymptomatic (n = 77)
p value Odds ratio (95% CI)
Bone marrow edema (BME) Presence Absence
40 (87.0%) 6 (13.0%)
0 (0%) 77 (100%)
< 0.0001* 965.8**(84.8 to 10015)
Synovialfluid effusion Presence
Absence
37 (80.4%) 9 (19.6%)
22 (28.6%) 55 (71.4%)
< 0.0001* 10.3
(4.26 to 24.8)
Subchondral fracture Presence
Absence
16 (34.8%) 30 (65.2%)
0 (0%) 77 (100%)
< 0.0001* 83.9**
(8.17 to 838)
* p values less than 0.05 indicate a significant difference.
** Cell data of 0 were corrected by adding 0.5 to all values of the cell.
Fig. 4.Radiographic and MR findings in symptomatic patients with the pre-collapse stage of osteonecrosis of the femoral head. On anterior (a) and lateral radiographs (b), the contour of the femoral head maintains a spherical shape without apparent subchondral fracture or collapse. MR findings show bone marrow edema around the femoral head and neck beyond the necrotic lesion, extending to the intertrochanteric lesion on both a coronal T1-weighted image (c) and a fat-suppressed T2-weighted image (d).
H. Hatanaka et al. European Journal of Radiology 112 (2019) 1–6
4
pain was assessed using the Harris hip score, which took into account only medical records data. However, MRfindings were clearly different between symptomatic and asymptomatic groups that were defined based on the Harris hip score. Although not ideal, we think that pain assessment using the Harris hip score is clinically useful as a guide for symptomatic pre-collapse ONFH. Third, this study was performed at a
single institution. Therefore, there may have been some bias, for in- stance involving patient selection and staging methods. A multicenter study would be preferable to minimize this bias and increase the gen- eralizability of the results.
In conclusion, this study demonstrated that symptomatic pre-col- lapse stage of ONFH diagnosed by plain radiography could be dis- tinguished from asymptomatic pre-collapse stage of ONFH by the pre- sence of BME on MR imaging, and that BME may be a sign of occult fracture.
Conflict of interest
No benefits of any kind have been received or will be received from commercial parties related directly or indirectly to the subject of this article.
Acknowledgments
This work was supported in part by a grant-in-aid in Scientific Research (16K10906) from the Japan Society for the Promotion of Science. We thank Junji Kishimoto, a statistician from the Digital Medicine Initiative Kyushu University, for his advice on the statistical analysis.
References
[1] A.Y. Plakseychuk, M. Shah, S.E. Varitimidis, H.E. Rubash, D. Sotereanos, Classification of osteonecrosis of the femoral head: reliability, reproducibility, and prognostic value, Clin. Orthop. Relat. Res. 386 (2001) 34–41.
[2] R.P. Ficat, Idiopathic bone necrosis of the femoral head. Early diagnosis and treatment, J. Bone Joint Surg. Br. 67 (1985) 3–9.
[3] N. Sugano, T. Atsumi, K. Ohzono, T. Kubo, T. Hotokebuchi, K. Takaoka, The 2001 revised criteria for diagnosis, classification, and staging of idiopathic osteonecrosis of the femoral head, J. Orthop. Sci. (7) (2002) 601–605.
[4] J. Gardeniers, ARCO committee on terminology and staging, ARCO News Lett.
(1993).
[5] M.A. Mont, M.G. Zywiel, D.R. Marker, M.S. McGrath, R.E. Delanois, The natural history of untreated asymptomatic osteonecrosis of the femoral head, J. Bone Joint Surg. Am. 92 (2010) 2165–2170.
[6] K. Ohzono, M. Saito, K. Takaoka, K. Ono, T. Nishina, T. Kadowaki, Natural history of nontraumatic avascular necrosis of the femoral head, J. Bone Joint Surg. Br. 73 (1) (1991) 68–72.
[7] E. Powell, W. Lanzer, M. Mankey, Core decompression for early osteonecrosis of the hip in high risk patients, Clin. Orthop. Relat. Res. 335 (1997) 181–189.
[8] D. Markel, C. Miskovsky, T. Sculco, P. Pellicci, E. Salvati, Core decompression for Fig. 5.Radiographic and MR findings in asymptomatic patients with the pre-collapse stage of osteonecrosis of the femoral head. The contour of the femoral head is spherical on anterior (a) and lateral (b) radiographs. Bone marrow edema is not seen on either a coronal T1-weighted image (c) or a fat-suppressed T2- weighted image (d).
Table 2
Relationship between MR parameters and localization of the necrotic lesion.
MR parameters Localization of the necrotic lesion (type)
p value
A (n = 16)
B (n = 21)
C1 (n = 54)
C2 (n = 32) Bone marrow
edema (BME)
Presence Absence
0 16
4 17
21 33
15 17
0.001*
Synovialfluid effusion
Presence Absence
2 14
6 15
31 23
20 12
0.001* Subchondral
fracture
Presence Absence
0 16
0 21
11 43
5 27
0.03*
* p values less than 0.05 indicate a significant difference.
Fig. 6.Kaplan-Meier survival curve shows the survival rate. The endpoint is the time when surgery was performed.
osteonecrosis of the femoral head, Clin. Orthop. Relat. Res. 323 (1996) 226–233.
[9] B. Mazières, F. Marin, P. Chiron, L. Moulinier, J.M. Amigues, M. Laroche, et al., Influence of the volume of osteonecrosis on the outcome of core decompression of the femoral head, Ann. Rheum. Dis. 56 (1997) 747–750.
[10] T. Floerkemeier, F. Thorey, D. Daentzer, M. Lerch, P. Klages, H. Windhagen, et al., Clinical and radiological outcome of the treatment of osteonecrosis of the femoral head using the osteonecrosis intervention implant, Int. Orthop. 35 (2011) 489–495.
[11] V. Gangji, V. De Maertelaer, J.-P. Hauzeur, Autologous bone marrow cell im- plantation in the treatment of non-traumatic osteonecrosis of the femoral head:five year follow-up of a prospective controlled study, Bone 49 (2011) 1005–1009.
[12] A.H. Zibis, A.H. Karantanas, N.T. Roidis, M.E. Hantes, P. Argiri, T. Moraitis, et al., The role of MR imaging in staging femoral head osteonecrosis, Eur. J. Radiol. 63 (2007) 3–9.
[13] T. Sakai, N. Sugano, T. Nishii, K. Haraguchi, T. Ochi, K. Ohzono, MRfindings of necrotic lesions and the extralesional area of osteonecrosis of the femoral head, Skeletal Radiol. 29 (2000) 133–141.
[14] Y.M. Kim, H.C. Oh, H.J. Kim, Y. Kim, H. Oh, H. Kim, et al., The pattern of bone marrow oedema on MRI in osteonecrosis of the femoral head, J. Bone Joint Surg. Br.
Ed. 82 (2000) 837–841.
[15] K. Stevens, C. Tao, N. Salem, J. Vandevenne, C. Chenq, G. Neumann, et al., Subchondral fractures in osteonecrosis of the femoral head: comparison of radio- graphy, CT, and MR imaging, AJR Am. J. Roentgenol. 180 (2003) 363–368.
[16] R. Meier, T.M. Kraus, C. Schaeffeler, S. Torka, A.M. Schlitter, K. Specht, et al., Bone marrow oedema on MR imaging indicates ARCO stage 3 disease in patients with AVN of the femoral head, Eur. Radiol. 24 (2014) 2271–2278.
[17] D.G. Mitchell, V. Rao, M. Dalinka, C.E. Spritzer, W.B. Gefter, L. Axel, et al., MRI of
jointfluid in the normal and ischemic hip, Am. J. Roentgenol. 146 (1986) 1215–1218.
[18] T. Kubo, S. Yamazoe, N. Sugano, M. Fujioka, S. Naruse, N. Yoshimura, et al., Initial MRIfindings of non-traumatic osteonecrosis of the femoral head in renal allograft recipients, Magn. Reson. Imaging 15 (1997) 1017–1023.
[19] S. Ikemura, T. Yamamoto, G. Motomura, Y. Nakashima, T. Mawatari, Y. Iwamoto, MRI evaluation of collapsed femoral heads in patients 60 years old or older: dif- ferentiation of subchondral insufficiency fracture from osteonecrosis of the femoral head, Am. J. Roentgenol. 195 (2010) W63–68.
[20] W.H. Harris, Traumatic arthritis of the hip after dislocation and acetabular frac- tures: treatment by mold arthroplasty, J. Bone Joint Surg. Am. 51 (1969) 737–755.
[21] S. Iida, Y. Harada, K. Shimizu, M. Sakamoto, S. Ikenoue, T. Akita, et al., Correlation Between Bone Marrow Edema and Collapse of the Femoral Head in Steroid-Induced Osteonecrosis, Am. J. Roentgenol. 174 (2000) 735–743.
[22] H. Ito, T. Matsuno, A. Minami, Relationship between bone marrow edema and development of symptoms in patients with osteonecrosis of the femoral head, Am. J.
Roentgenol. 186 (2006) 1761–1770.
[23] K.H. Koo, I.O. Ahn, R. Kim, H.R. Song, S.T. Jeong, J.B. Na, et al., Bone marrow edema and associated pain in early stage osteonecrosis of the femoral head: pro- spective study with serial MR images, Radiology 213 (1999) 715–722.
[24] M.D. Murphey, K.L. Foreman, M.K. Klassen-Fischer, M.G. Fox, E.M. Chung, M.J. Kransdorf, From the radiologic pathology archives imaging of osteonecrosis:
radiologic-pathologic correlation, RadioGraphics 34 (2014) 1003–1028.
[25] G.-S. Huang, W.P. Chan, Y.-C. Chang, C.-Y. Chang, C.-Y. Chen, J.S. Yu, MR imaging of bone marrow edema and joint effusion in patients with osteonecrosis of the fe- moral head: relationship to pain, AJR Am. J. Roentgenol. 181 (2003) 545–549.
H. Hatanaka et al. European Journal of Radiology 112 (2019) 1–6
6