Evaluation of Homogeneity on Cone Beam Computed Tomography Imaging with Flat Panel Detector
10
0
0
全文
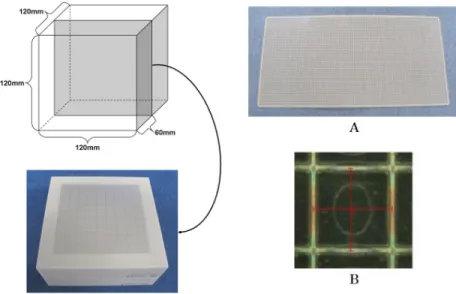
(2) J.Hard Tissue Biology Vol. 18(2):101-110, 2009. Figure 1.Cone beam computed tomography (CBCT).. Figure 2. Coronal image (upper left), sagittal image (upper right) and axial image (lower left) of CBCT.. Figure 3. The phantom consisted of four pieces of water equivalent material.. Figure 6. The phantom and a level.. Figure 4. The stainless steel x-ray mesh gauge embedded in the phantom.. Figure 5. The x-ray mesh gauge (A) and it’s microscope image (B).. uniformity9). On CBCT as well, it is very important to sustain the homogeneity of measurement of the distance at any regions on CBCT image in clinical applications10). Recently, flat panel detector (FPD) with both fluorescent screen and semiconductor had been integrated in CBCT. FPD has succeeded in holding down the fluctuation that occurs with I.I. On FPD, the x-ray signal is easily converted into digital signal with lesser fluctuation. Therefore, high spatial resolution is obtained on FPD without deterioration of the image due to fluctuation. FPD has also higher image contrast. The contrast resolution of I.I. is 8 bit with 256 gradations. On FPD, this is expanded to 12 bit with 4096 gradations, contributing to high sensitivity for the detection of a few contrasts on the image. To date, many researchers have been investigating the precision of the measurement of the distance on the images on CBCT alone or comparing that on both CBCT and MDCT. They finally conclude that CBCT has better precision for the measurement than MDCT11-16). However, little is known whether measurement values. of the distance between two sites are homogeneous at any region of the CBCT image. The objective of this study was to analyze the homogeneity of measurement of the distance on CBCT image with FPD. Materials and Methods CBCT equipment I used in this study the recently-developed CBCT (Morita Co., Kyoto) with FPD, the designated 3D Accuitomo type F17. This consists of a chair for the subjects and two rotated arms with gateshaped. One arm is equipped with the x-ray tube and the other arm the FPD (Fig. 1). Tomography shape obtained by CBCT is cylindrical. The 5 size of the cylinder can be selected in this CBCT: φ40mm×h40mm,φ60mm×h60m,φ80mm×h80mm, φ100mm×h100mm, and φ170mm×h120mm. Prior to taking the CBCT images, the lateral and frontal images of the subjects are obtained to determine the precise position of the imaging area. Thereafter, the cursor is adjusted to the centre of the imaging area, 102.
(3) Noriyuki Sugino: Homogeneity on CBCT Imaging with FPD. Figure 7. Lateral (A) and frontal (B) x-ray images of the x-ray mesh gauge embedded in the phantom.. Figure 8. Number of pixels between the neighboring two peaks (black arrow) of the density profile of the x-ray mesh gauge was considered as the distance.. Figure 9. Ideal pixel pattern of the x-ray mesh gauge in the area of CBCT; the size of the measurement is 40×40. Figure 10. Ideal pixel pattern of the x-ray mesh gauge in the area of CBCT; the size of the measurement is 60×60.. where the dentists want to take, on these lateral and frontal images. After the determination of the precise position, the arms rotate around the subject and 590 x-ray tomography images are automatically obtained with the time of 17.5 seconds. The i-VIEW software (Morita Co., Kyoto) was used to obtain and analyze three-dimensional reconstruction tomography images (horizontal, sagittal and frontal images) of CBCT (Fig. 2). Sizes of the voxel were between 0.080mm and 0.250mm according to the size of the cylindrical tomography shape obtained by CBCT.. Parameters of the CBCT imaging The tube voltage and total filtration were 90kV and 3.1mmAl, respectively. In addition, four typical parameters of the tube current and the tomography imaging volume were used in this study: 5mA and φ40mm×h40mm, 7mA and φ40mm×h40mm, 5mA and φ60mm×h60mm, and 7mA and φ60mm×h60mm. Prior to taking CBCT of the phantom, a levelling instrument was used to confirm whether top of the phantom is almost parallel to the floor (Fig. 6). The x-ray mesh gauge was placed parallel or perpendicular to the FPD before the CBCT exposure (Fig. 7). The X (frontal) and Y (lateral) plane images of the x-ray mesh gauge were obtained for parameters (4 current tube and imaging volumes) on CBCT. The images were taken 3 times within a day with an interval of 4 hours. Additionally, the images were taken 3 times with an interval of 1 week.. Experimental phantom The cube shape phantom with a size of 120mm×120mm× 120mm was constructed as the phantom for the study using plane board tough water phantom WE type (Kyoto Kagaku Co., Kyoto). The density of this phantom (1.017g/cm3) was almost equal to that of the water (Fig. 3). In addition, I used stainless steel x-ray mesh gauge with a size of 90mm×90mm× 0.1mm (DENTECH, Tokyo) and with a grid of 2mm interval. This was placed in the centre of the cube shape experimental phantom (Fig. 4). The interval of the grid on x-ray mesh gauge was confirmed using a microscope before the study (Fig. 5).. Calculation of the profile In the imaging area of φ40mm×h40mm, the slice thickness and interval were 0.080mm and 0.080mm, respectively. In the imaging 103.
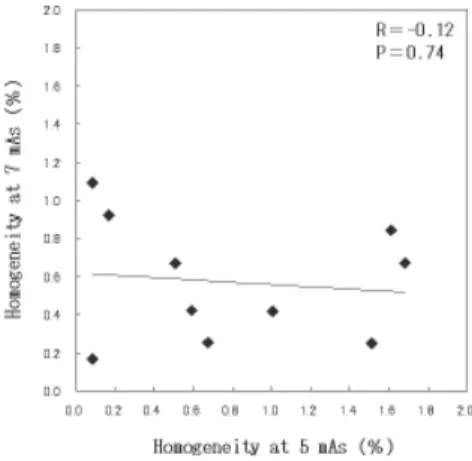
(4) J.Hard Tissue Biology Vol. 18(2):101-110, 2009. Figure 11. Five ROIs in measuring the distance; upper left (UL), upper right (UR), lower left (LL), lower right (LR), and the center (CC) on the size of the measurement at 40×40.. Figure 12. Five ROIs in measuring the distance; upper left (UL), upper right (UR), lower left (LL), lower right (LR), and the center (CC) on the size of the measurement at 60×60.. Figure 13. The relationship between the heterogeneity of measuring the distance when exposed at 5mAs and 7mAs in horizontal direction on X plane at 60×60.. Figure 14. The relationship between the heterogeneity of measuring the distance when exposed at 5mAs and 7mAs in vertical direction on X plane at 60×60.. Figure 15. The relationship between the heterogeneity of measuring the distance when exposed at 5mAs and 7mAs in horizontal direction on Y plane at 60×60.. area of φ60mm×h60mm, the slice thickness and interval were 0.125mm and 0.125mm, respectively Therefore, the voxel size in the imaging area of φ40mm×h40mm and φ60mm×h60mm, respectively, were 0.080mm and 0.125mm in each side. Data was stored with bitmap and incorporated into the software for image analysis (Scion Image Beta 4.02, Scion Corporation, USA). Measurement of the distance on the CBCT image and measurement region Number of pixels between peak values representing 1 grid interval of the x-ray mesh gauge on density profile of the CBCT image was considered as the distance between the grids (Fig. 8). If there was no noise including x-ray quantum noise, the distance between the grids is 25 pixels in the area of φ40mm×h40mm (Fig. 9) and 16 pixels in the area of φ60mm×h60mm (Fig. 10). Measurements of the mean distance were performed horizontally and vertically in 5 different regions: central (CC), upper left (UL), upper right (UR), lower left (LL), and lower right (LR) (Figs. 11 and 12). These measurements were performed on 104. X and Y plane images as well. Data analysis The coefficient of variation of 3 data obtained within a day was defined as a short-term reproducibility of the measurement of the distance. The coefficient of variation of 3 data obtained with an interval of 1 week was defined as a long-term reproducibility of measurement of the distance. One-way analysis of covariance was performed to evaluate the homogeneity in measurement of the distance among 5 regions on CBCT images. Homoscedasticity was analyzed by Levene statistic. Bonferroni correction for multiple test was done when homoscedastic was verified, and Tamhane’s test was applied when homoscedastic were not verified. Data analyses were performed using the Statistical Package for the Social Sciences (SPSS; version 8.0; SPSS Inc., Chicago, IL). P-values < 0.05 were considered statistically significant. Absolute difference values of the measured distances between two different areas (CC-UL, CC-UR, CC-LL, CC-LR, UL-UR,.
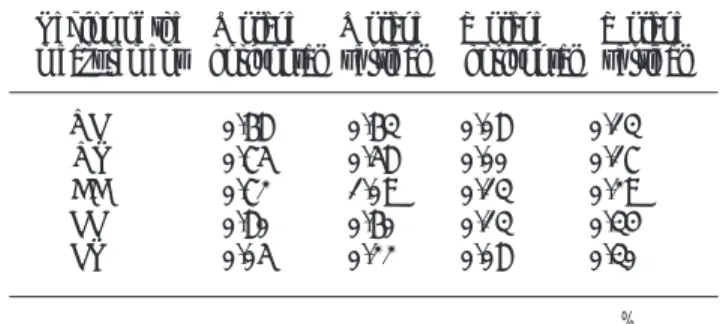
(5) Noriyuki Sugino: Homogeneity on CBCT Imaging with FPD. Figure 16. The relationship between the heterogeneity of measuring the distance when exposed at 5mAs and 7mAs in vertical direction on Y plane at 60×60.. Figure 17. The relationship between the heterogeneity of measuring the distance when exposed at 5mAs and 7mAs in horizontal direction on X plane at 40×40.. Figure 18. The relationship between the heterogeneity of measuring the distance when exposed at 5mAs and 7mAs in vertical direction on X plane at 40×40.. Figure 19. The relationship between the heterogeneity of measuring the distance when exposed at 5mAs and 7mAs in horizontal direction on Y plane at 40×40.. Non-uniformity of the distance on CBCT images with a tube current of 5mA was compared with a tube current of 7mA in order to investigate the effect of tube current on non-uniformity of the distance. Results In the imaging area of φ40mm×h40mm, short-term reproducibility was less than 1.24% for horizontal direction on X plane with a tube current of 5mA (Table 1) and less than 1.09% for vertical direction on X plane with a tube current of 7mA (Table 2). In the imaging area of φ60mm×h60mm, short-term reproducibility was less than 0.66% for vertical direction on X plane with a tube current of 5mA (Table 3) and less than 1.18% for horizontal direction on X plane with a tube current of 7mA (Table 4). In the imaging area of φ40mm×h40mm, long-term reproducibility was less than 0.58% for horizontal direction on X plane with a tube current of 5mA (Table 5) and less than 0.58% for vertical direction on Y plane with a tube current of 7mA (Table 6).. Figure 20. The relationship between the heterogeneity of measuringthe distance when exposed at 5mAs and 7mAs in vertical direction on Y plane at 40×40. UL-LL, UL-LR, UR-LL, UR-LR, LL-LR) were considered as an index representing non-uniformity of the distance on CBCT images.. 105.
(6) J.Hard Tissue Biology Vol. 18(2):101-110, 2009 Table 2. short-term reproducibility (within a day) of measuring the distance between two regions of interest(ROIs) in the area of cone beam computed tomography (CBCT) at 7mA; the size of the measurement is 40x40.. Table 1. short-term reproducibility (within a day) of measuring the distance between two regions of interest (ROIs) in the area of cone beam computed tomography (CBCT) at 5 mA; the size of the measurement is 40x40.. Region of the measurement UR UR CC LL LR. X plane horizontal 0.15 0.30 0.15 0.13 1.24. Region of the X plane X plane measurement horizontal vertical. X plane Y plane Y plane vertical horizontal vertical 0.37 0.88 0.25 0.38 1.05. 0.21 0.25 0.05 0.14 0.32. UL UR CC LL LR. 1.02 0.65 0.55 0.78 0.92. 0.68 0.75 0.72 0.80 0.05. 0.63 0.58 1.09 0.60 0.22. Y plane Y plane horizontal vertical 0.08 0.00 0.13 0.13 0.08. %. %. Table 3. short-term reproducibility (within a day) of measuring the distance between two regions of interest(ROIs) in the area of cone beam computed tomography (CBCT) at 7mA; the size of the measurement is 60x60.. Region of the measurement UL UR CC LL LR. X plane X plane Y plane horizontal vertical horizontal 0.54 0.00 0.00 0.08 0.00. 0.40 0.14 0.20 0.15 0.16. 0.35 0.55 0.21 0.58 0.40. Table 4. short-term reproducibility (within a day) of measuring the distance between two regions of interest(ROIs) in the area of cone beam computed tomography (CBCT) at 7mA; the size of the measurement is 60x60.. Y plane vertical. Region of the measurement. 0.14 0.13 0.66 0.08 0.23. UL UR CC LL LR. X plane X plane horizontal vertical 0.43 0.00 0.00 0.08 0.00. 0.82 0.82 0.13 0.85 0.34. Y plane Y plane horizontal vertical 0.68 0.40 0.40 0.60 1.18. % Table 5. Long-term reproducibility (day a day) of measuring the distance between two ROIs in the area of CBCT at 5mA; the size of the measurement is 40 x40.. Region of the measurement UL UR CC LL LR. X plane X plane horizontal vertical. Y plane Y plane horizontal vertical. 0.11 0.42 0.02 0.06 0.17. 0.15 0.14 0.02 0.18 0.15. 0.36 0.23 0.35 0.58 0.42. 0.13 0.17 0.29 0.34 0.30. 0.28 0.66 0.27 0.68 0.51 %. Table 6. Long-term reproducibility (day a day) of measuring the distance between two ROIs in the area of CBCT at 7 mA; the size of the measurement is 40 x40.. Region of the measurement. 0.04 0.08 0.03 0.07 0.09. UL UR CC LL LR. %. X plane X plane horizontal vertical. Y plane Y plane horizontal vertical. 0.35 0.11 0.06 0.35 0.28. 0.55 0.50 0.14 0.53 0.52. 0.34 0.27 0.04 0.34 0.14. 0.36 0.58 0.04 0.50 0.51 %. In the imaging area of φ60mm×h60mm, long-term reproducibility was less than 0.87% for horizontal direction on Y plane with a tube current of 5mA (Table 7) and less than 1.05% for horizontal direction on Y plane with a tube current of 7mA (Table 8). There was significant difference in the measured distance in the imaging area of φ40mm×h40mm for vertical direction on Y plane (P=0.02) (Table 9). However, multiple comparisons revealed significant difference between only UL and LL regions (P=0.04). In the imaging area of φ40mm×h40mm, absolute difference values was less than 1.68% for horizontal direction on X plane. with a tube current of 5mA (Table 10) and less than 1.66% for vertical direction on Y plane with a tube current of 7mA (Table 11). In the imaging area of φ60mm×h60mm, absolute difference values was less than 1.75% for vertical direction on Y plane with a tube current of 5mA (Table 12) and less than 1.49% for horizontal direction on X plane with a tube current of 7mA (Table 13). In the imaging area of φ60mm×h60mm, non-uniformities on CBCT images with a tube current of 5mA tended to be somewhat correlated with that on CBCT images with a tube current of 7mA 106.
(7) Noriyuki Sugino: Homogeneity on CBCT Imaging with FPD Table 7. Long-term reproducibility (day a day) of measuring the distance between two ROIs in the area of CBCT at 5 mA; the size of the measurement is 60 x60.. Region of the X plane measurement horizontal UL UR CC LL LR. X plane Y plane Y plane vertical horizontal vertical. 0.22 0.34 0.38 0.32 0.44. 0.75 0.75 0.27 0.67 0.60. 0.62 0.44 0.45 0.87 0.44. 0.65 0.58 0.25 0.81 0.72. Table 8. Long-term reproducibility (day a day) of measuring the distance between two ROIs in the area of CBCT at 7 mA; the size of the measurement is 60 x60.. Region of the X plane X plane measurement horizontal vertical UL UR CC LL LR. 0.27 0.39 0.38 0.05 0.29. 0.45 0.27 0.21 0.31 0.58. Y plane Y plane horizontal vertical 0.72 0.33 0.41 1.05 0.74. % Table 9. Evaluetion of the homogeneity of measuring the distance.. conditions. X plane X plane Y plane Y plane horizontal vertical horizontal vertical. 5ml φ 40mm×H40mm. 0.07. 0.75. 0.93. 0.93. 7ml φ 40mm×H40mm. 0.22. 0.46. 0.34. 0.02. 5ml φ 60mm×H60mm. 0.12. 0.30. 0.51. 0.55. 7ml φ 60mm×H60mm. 0.23. 0.24. 0.33. 0.61. 0.66 0.50 0.34 0.57 0.69 %. Table 10. Non-uniformity of measuring the distance been two ROIs in the area of CBCT at 5mAs; the size of the measurement is 40x40.. Two ROIs X plane horizontal CC-UL CC-UR CC-LL CC-LR UL-UR UL-LL UL-LR UR-LL UR-LR LL-LR. 0.08 0.68 0.17 1.68 0.59 0.08 1.61 0.51 1.01 1.51. X plane vertical 1.08 0.50 0.33 0.58 0.58 0.75 0.50 0.17 0.08 0.25. Y plane Y plane horizontal vertical 0.51 0.34 0.51 0.00 0.17 0.00 0.51 0.17 0.34 0.51. 0.08 0.58 0.08 0.08 0.67 0.17 0.00 0.50 0.67 0.17 %. p-Value Table 11. Non-uniformity of measuring the distance been two ROIs in the area of CBCT at 7mAs; the size of the measurement is 40x 40.. Two ROIs X plane horizontal CC-UL CC-UR CC-LL CC-LR UL-UR UL-LL UL-LR UR-LL UR-LR LL-LR. 0.17 0.25 0.92 0.67 0.42 1.09 0.84 0.67 0.42 0.25. X plane vertical. Y plane horizontal. Y plane vertical. 0.33 0.08 0.00 1.17 0.42 0.34 0.83 0.08 1.25 1.17. 0.00 0.17 0.84 0.93 0.17 0.84 0.93 0.67 0.76 0.08. 1.66 1.58 0.42 0.92 0.08 1.24 0.74 1.16 0.66 0.50 %. independent of the differences in the plane (X or Y) and direction (vertical or horizontal) (Figs. 13-16). On the other hand, in the imaging area of φ40mm×h40mm, the non-uniformity of measurement of the distance varied randomly. There was no association in non-uniformities on CBCT images between using 5mA and 7mA (Fig. 17-20).. Table 12. Non-uniformity of measuring the distance been two ROIs in the area of CBCT at 7mAs; the size of the measurement is 60x 60.. Two ROIs X plane X plane horizontal vertical. Y plane Y plane horizontal vertical. CC-UL CC-UR CC-LL CC-LR UL-UR UL-LL UL-LR UR-LL UR-LR LL-LR. 1.34 0.13 0.40 0.40 1.20 0.94 0.93 0.27 0.27 0.00. 1.75 0.68 0.68 0.68 1.08 1.08 1.07 0.00 0.00 0.00. 0.53 1.61 0.27 1.20 1.08 0.27 0.67 1.34 0.40 0.94. 0.67 0.27 0.00 1.07 0.94 0.67 1.75 0.27 0.80 1.07 %. Discussion In this study, short- and long-term reproducibility of measurement of the distance on CBCT images was less than 1.5%, indicating sufficient reproducibility. Basically, if the reproducibility is poor, the evaluation of the homogeneity of measurement of the distance on the CBCT images is not meaningful. That is why we first confirmed the short- and long-term reproducibility in this 107.
(8) J.Hard Tissue Biology Vol. 18(2):101-110, 2009 vertical directions of UL and LL in imaging area of φ40mm×h40mm Table 13. Non-uniformity of measuring the distance been two ROIs in on Y-plane; however, it is likely that this may be caused by chance the area of CBCT at 7mAs; the size of the measurement is 60x 60. finding because no significant differences were found in other Two ROIs X plane X plane Y plane Y plane situations. Therefore, I can indicate good homogeneity of horizontal vertical horizontal vertical measurement of the distance on CBCT image with FPD. Absolute difference values among the 5 areas on CBCT image was less than CC-UL 1.49 0.53 1.20 0.00 2% so that this also indicate good homogeneity of measurement of CC-UR 0.68 1.47 0.27 0.67 the distance on CBCT image with FPD. If the distance from the CC-LL 0.68 0.13 0.14 0.54 alveolar crest to the mandibular canal was 10mm, the results indicate CC-LR 0.68 0.80 0.67 1.20 that distance measured on CBCT image was between 9.8mm and UL-UR 0.81 0.94 1.47 0.67 10.2mm at any regions. This does not seem to be a clinical problem. UL-LL 0.81 0.40 1.06 0.54 In the imaging area of φ60mm×h60mm, non-uniformities on UL-LR 0.80 0.27 0.53 1.21 CBCT images with a tube current of 5mA were correlated with UR-LL 0.00 1.34 0.41 0.13 that on CBCT images with a tube current of 7mA independent of UR-LR 0.00 0.67 0.94 0.53 other parameters. On the other hand, in the imaging area of LL-LR 0.00 0.67 0.53 0.67 φ40mm×h40mm, the non-uniformity of measurement of the distance varied randomly. The main cause of the noise is the x-ray % quantum mottle and system noise. It is likely that these may study. Hildebolt et al. evaluated the alveolar bone loss on intrainfluence on the phenomena in the imaging area of φ40mm×h40mm. oral radiographs with a coefficient of variance of 2.3% using a However, since the non-uniformity of measurement of the distance computer-intensive method17). It may be difficult to compare the in the imaging area of φ40mm×h40mm is considerably small, these results with other data regarding reproducibility in clinical studies; phenomena do not influence on the results in clinical use. however, the results suggest that measurement of the distance on CBCT with FDP will rapidly spread in the near future in dental CBCT image may be relatively reproducible in clinical practice. field as well as medical field. Evaluation of both reproducibility The alveolar bone measurement14), pre-surgical assessment of and precision are very important when investigators or clinicians implant site 18) temporomandibular joint 19) have recently want to apply CBCT21). Caution should be noted when interpreting investigated by CBCT. Although the data were obtained by the results if this information is not obtained. The results indicated phantom, the results also suggest that change of measurement of the high reproducibility and good homogeneity for measurement the distance on CBCT might be ideally detected up to 4.1% of the distance on CBCT images; however, further investigation (1.5×1.96× √2 between the exemainations. would be necessary to clarify the usefulness of CBCT with FPD After the early 1990s, whole body CT used in the medical field in clinical dental practice. in conclusions, the reproducibility of have been applied in general dental practice, especially for premeasurement of the distance on CBCT images with FPD was less surgical assessment of implant placement. CT value (HU) obtained than 1.5%. Homogeneity of measurement of the distance among 5 by medical CT is considered an useful indicator in assessing bone areas (center, upper right, lower right, upper left and lower left) quantity and quality, although CT value easily change due to some on CBCT images was good. Absolute difference values of the factors like quantum noise20). However, since medical CT including measured distance between any two regions on CBCT images MDCT provides high radiation dose to the patients, resulting in were less than 2%. When the imaging area is small, non-uniformity the increase of radiation-induced cancer incidence, CBCT that of measurement of the distance on CBCT images varied randomly. provides relative low radiation dose have been developed and However, this variation was considerably small. I conclude that it rapidly spread in clinical dental practice over the world. However, can be measured the distance with good reproducibility and in CBCT with I.I. homogeneity of measurement of the distance sufficient homogeneity at any regions on CBCT with FDP. could not be maintained 10) because of complex structure contributing to fluctuation effect. To improve this problem, CBCT Acknowledgments with FPD that has simple structure to convert x-ray signal into I would like to mention my special thanks to Professor Akira digital signal have been developed. However, since little is known Taguchi, Matsumoto Dental University as a supervisor of this whether homogeneity of measurement of the distance on CBCT study. I also would like to thank to Professor Yoshinori Arai, Nihon image is improved compared with CBCT with I.I., I investigated University, and to Professors Akihiro Kuroiwa and Katsuhiro the homogeneity of measurement of the distance on CBCT image Inoue, Matsumoto Dental University, to provide the necessary with FPD. experimental equipments and material used in this study, and to The current study found a significant difference only between the Professors Toshiyuki Kawakami, Nobuo Yoshinari, Junichi 108.
(9) Noriyuki Sugino: Homogeneity on CBCT Imaging with FPD Otogoto, Kiyofumi Furusawa, Hiromasa Hasegawa and Shuichiro 12. Mischkowski RA, Pulsfort R, Ritter L, Neugebauer J, Yamashita for their excellent mentorship and support in this Brochhagen HG, Keeve E and Zöller JE. Geometric accuracy research project. This work was also cooperated by the assistant of a newly developed cone-beam device for maxillofacial of Dental School assistant professor Hiroko Kuroiwa. imaging. Oral Surg Oral Med Oral Pathol Oral Radiol Endod 104: 551-9, 2007 References 13. Suomalainen A, Vehmas T, Kortesniemi M, Robinson S and 1. Almog DM, Benson BW, Wolfgang L, Frederiksen NL and Peltola J. Accuracy of linear measurements using dental cone Brooks SL. Computerized tomography-based imaging and beam and conventional multislice computed tomography. surgical guidance in oral implantology. J Oral Implantol 32: Dentomaxillofac Radiol 37: 10-7, 2008 14-8, 2006 14. Loubele M, Van Assche N, Carpentier K, Maes F, Jacobs R, 2. Berrington de González A and Darby S. Risk of cancer from van Steenberghe D and Suetens P. Comparative localized linear diagnostic X-rays: estimates for the UK and 14 other accuracy of small-field cone-beam CT and multislice CT for countries. Lancet 363: 345-51, 2004 alveolar bone measurements. Oral Surg Oral Med Oral Pathol 3. Brenner DJ and Hall EJ. Computed tomography—an increasing Oral Radiol Endod 105: 512-8, 2008 source of radiation exposure. New Eng J Med 357: 2277-84, 15. Veyre-Goulet S, Fortin T and Thierry A. Accuracy of linear 2007 measurement provided by cone beam computed tomography 4. Arai Y, Tammisalo E, Iwai K, Hashimoto K and Shinoda K. to assess bone quantity in the posterior maxilla: a human Development of a compact computed tomographic apparatus cadaver study. Clin Implant Dent Relat Res 10: 226-30, 2008 for dental use. Dentomaxillofac Radiol 28: 245-8, 1999 16. Stratemann SA, Huang JC, Maki K, Miller AJ and Hatcher 5. Terakado M, Hashimoto K, Arai Y, Honda M, Sekiwa T and DC. Comparison of cone beam computed tomography Sato H. Diagnostic imaging with newly developed ortho cubic imaging with physical measures. Dentomaxillofac Radiol 37: super-high resolution computed tomography (Ortho-CT). 80-93, 2008 Oral Surg Oral Med Oral Pathol Oral Radiol Endod 89: 50917. Hildebolt CF, Brunsden B, Yokoyama-Crothers N, Pilgram 18, 2000 TK, Townsend KE, Vannier MW and Shrout MK. 6. Kim S, Yoshizumi TT, Toncheva G, Yoo S and Yin FF. Comparison of reliability of manual and computer-intensive Comparison of radiation doses between cone beam CT and methods for radiodensity measures of alveolar bone loss. multi detector CT: TLD measurements. Radiat Prot Dentomaxillofac Radiol 27: 245-50, 1998 Dosimetry 132: 339-345, 2008 18. Hatcher DC, Dial C and Mayorga C. Cone beam CT for pre7. Yoshida Y, Honda E, Tomotake Y, Nagao D and Ichikawa T. surgical assessment of implant sites. J Calif Dent Assoc 31: Evaluation of patient dose in imaging using a cone-beam CT 825-33, 2003 for dental use. J Soc Oral Implantol 20: 280-6, 2007 19. Honey OB, Scarfe WC, Hilgers MJ, Klueber K, Silveira AM, 8. Arai Y, Hashimoto K, Iwai K and Shinoda K. Fundamental Haskell BS and Farman AG. Accuracy of cone-beam computed efficiency of limited cone-beam x-ray CT (3DX multi image tomography imaging of the temporomandibular joint: micro CT) for practical use. Dent Radiol 40: 145-54, 2000 comparisons with panoramic radiology and linear 9. Ohtsuka M. Reduction of patient dose and improvement of tomography. Am J Orthod Dentofacial Orthop 132: 429-38, measurement accuracy in radiographic swallowing studies. 2007 Dent Radiol 44: 1-15, 2004 20. Taguchi A, Tanimoto K, Ogawa M, Sunayashiki T and Wada 10. Sugino N, Uchida K, Shiojima M. Fundamental evaluation of T. Effect of size of region of interest on precision of bone standard on cone beam computed tomography (3DX). Dent mineral measurements of the mandible by quantitative Radiol 47: 116, 2007 computed tomography. Dentomaxillofac Radiol 20: 25-9, 11. Ludlow JB, Laster WS, See M, Bailey LJ and Hershey HG. 1991 Accuracy of measurements of mandibular anatomy in cone 21. Mol A and Balasundaram A. In vitro cone beam computed beam computed tomography images. Oral Surg Oral Med tomography imaging of periodontal bone. Dentomaxillofac Oral Pathol Oral Radiol Endod 103: 534-42, 2007 Radiol 37: 319-24, 2008. 109.
(10) J.Hard Tissue Biology Vol. 18(2):101-110, 2009. 110.
(11)
図

+3

関連したドキュメント
An easy-to-use procedure is presented for improving the ε-constraint method for computing the efficient frontier of the portfolio selection problem endowed with additional cardinality
If condition (2) holds then no line intersects all the segments AB, BC, DE, EA (if such line exists then it also intersects the segment CD by condition (2) which is impossible due
This means that finding the feasible arrays for distance-regular graphs of valency 4 was reduced to a finite amount of work, but the diameter bounds obtained were not small enough
2 Combining the lemma 5.4 with the main theorem of [SW1], we immediately obtain the following corollary.. Corollary 5.5 Let l > 3 be
This paper develops a recursion formula for the conditional moments of the area under the absolute value of Brownian bridge given the local time at 0.. The method of power series
Related to this, we examine the modular theory for positive projections from a von Neumann algebra onto a Jordan image of another von Neumann alge- bra, and use such projections
Then it follows immediately from a suitable version of “Hensel’s Lemma” [cf., e.g., the argument of [4], Lemma 2.1] that S may be obtained, as the notation suggests, as the m A
Our method of proof can also be used to recover the rational homotopy of L K(2) S 0 as well as the chromatic splitting conjecture at primes p > 3 [16]; we only need to use the
