第 第
第 第4 4 4章 4 章 章 章
単層 単層 単層
単層カーボンナノチューブ カーボンナノチューブ カーボンナノチューブ カーボンナノチューブ
磁場配向膜 磁場配向膜 磁場配向膜
磁場配向膜の の の の作製 作製 作製 作製
第
第 第
第 4 4 4 4章 章 章 章 単層 単層 単層 単層 カーボンナノチューブ カーボンナノチューブ カーボンナノチューブ カーボンナノチューブ 磁場 磁場 磁場 磁場 配向 配向 配向 配向膜 膜 膜 膜 の の の の作製 作製 作製 作製
4.1 4.1 4.1
4.1 単層単層単層単層カーボンナノチューブカーボンナノチューブカーボンナノチューブカーボンナノチューブ(HiPco)(HiPco)(HiPco)(HiPco)磁場磁場磁場磁場配向配向配向膜配向膜膜膜のののの作製作製作製作製
4 4 4
4.1.1.1.1.1.1.1.1 単層単層カーボンナノチュー単層単層カーボンナノチューカーボンナノチューカーボンナノチューブブブブ(HiPco)(HiPco)(HiPco)(HiPco)分分分分散液散液散液散液ののの分散度の分散度分散度分散度についてについてについてについて
SWCNT磁場配向膜の作製にあたって,まず高分散なSWCNT分散液を作製した.バン
ドルしやすいSWCNTを高分散なSWCNTの状態のまま配向させることによってSWCNT 特有の性質を引き出せるためである.本研究では,これまで我々の研究グループで,SWCNT の高分散プロセスの最適化を行ってきた[1].今回作製したSWCNT分散液は,その研究結 果から得られた分散処理条件[超音波ホモジナイザーによる超音波分散処理:3 時間,遠心
分離処理(1.2×10⁴ G)]15時間]を用いている.実際,最適化した通りの分散度が得られてい
るかの確認のため,本研究で行った同じ分散処理条件の櫻井氏の実験のデータとの比較を 行った.
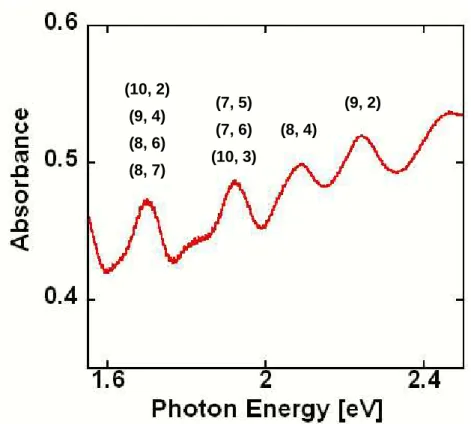
ま ず,今回 作製し た SWCNT 分 散液の光 吸収測定 結果 を Fig. 4.1 に示す .半導体 性
SWCNTの第2サブバンドに起因するシャープなピークが確認できた.これらのピークは,
HiPco試料の近赤外蛍光分光法による,カイラリティ分布測定結果[2][3]とうまく一致した
エネルギー位置に見られた.また,本研究で行った同じ分散処理条件の櫻井氏の光吸収測
定結果をFig. 4.2に示す.これも吸光度の違いはあるが,スペクトルの形状自体はほぼ同じ
ように思われる.詳細に比較するために,1.9 eV付近のピークについて,Fig. 4.1,Fig. 4.2 のグラフそれぞれについて半値幅を見積もったところ,0.074 eV ,0.077 eVであった.今
回,なおFig. 4.3に示すような方法で1.9 eV付近のピークの半値幅を求めている.以上の
ことから,今回作製したSWCNT 分散液は,我々のグループで最適化した通りの,もしく はそれと同等以上の分散度が得られたといえる.
Fig.
Fig.
Fig.
Fig. 444.14.1.1.1 Absorption spectra ofAbsorption spectra ofAbsorption spectra ofAbsorption spectra of a dispersiona dispersiona dispersion ofa dispersionofofof SWCNT(HiPco)SWCNT(HiPco)SWCNT(HiPco) usedSWCNT(HiPco)usedusedused ininin thisinthisthis studythisstudystudystudy withwithwithwith ((((n,,,, m)))) indicesindicesindices ofindicesofofof semsemsemsemiconductingiconductingiconducting SWCNTiconductingSWCNTSWCNTSWCNT....
Fig.
Fig.
Fig.
Fig. 444....24222 Absorption spectra ofAbsorption spectra ofAbsorption spectra ofAbsorption spectra of a dispersiona dispersiona dispersiona dispersion ofofof SWCNT(HiPco)of SWCNT(HiPco)SWCNT(HiPco)SWCNT(HiPco) usedusedused inused ininin thethethe previousthe previousprevious previous study
study study study[1]....
(9, 2) (8, 4)
(7, 5) (7, 6) (10, 3) (10, 2)
(9, 4) (8, 6) (8, 7)
Fig.
Fig.
Fig.
Fig. 4444....3333 The method of The method of calculationThe method of The method of calculationcalculationcalculation for a full for a full for a full for a full----width of halfwidth of halfwidth of half----maximumwidth of halfmaximummaximummaximum ofofof aof aaabsorption bsorption bsorption bsorption spectra of
spectra of spectra of
spectra of a dispersiona dispersiona dispersiona dispersion ooooffff SWCNT(HiPco)SWCNT(HiPco)SWCNT(HiPco)SWCNT(HiPco)....
4 4 4
4.1..1..1.2.1.222 単層単層カーボンナノチューブ単層単層カーボンナノチューブカーボンナノチューブカーボンナノチューブ(HiPco)(HiPco)(HiPco)(HiPco)磁場磁場磁場磁場配向配向配向膜配向膜膜膜についてについてについてについて
Fig. 4.4にSWCNT試料としてHiPcoサンプルを用いて作製したSWCNT(HiPco)磁場配
向膜の写真を示す.この磁場配向膜は,映りこんだルームライトの反射光から,滑らかな 膜であることがわかる.Fig. 4.5(a)にこの磁場配向膜のFig. 4.5(b)のように示す膜の中心部 及びその近傍における光吸収測定結果を示す.Fig. 4.5(a)の結果から中心部及びその近傍は ほぼ同じ光吸収スペクトルが得られたことから,膜は均一であることが示唆された.以上 から,石英基板上に滑らかで均一な膜の作製に成功した.以下にSWCNT(HiPco)磁場配向 膜の可視域偏光吸収測定結果および偏光ラマン散乱測定結果を示し,SWCNT の配向度に ついて議論する.
2 2.1 2.2
1.8 2.0
Absorbance
Photon Energy [eV]
Baseline
Full-width of half-maximum
Fig.
Fig.
Fig.
Fig. 4444....4 4 4 Appearance of a dried SW4 Appearance of a dried SWAppearance of a dried SWAppearance of a dried SWCCCNTCNTNTNT(HiPco)(HiPco)(HiPco)(HiPco)----gelatin composite film. Reflection of the gelatin composite film. Reflection of the gelatin composite film. Reflection of the gelatin composite film. Reflection of the light shows the smoothn
light shows the smoothn light shows the smoothn
light shows the smoothness and uniformity of the film.ess and uniformity of the film.ess and uniformity of the film. ess and uniformity of the film.
Fig.
Fig.
Fig.
Fig. 444....5 45 5 (a)Absorption spectra of the SW5 (a)Absorption spectra of the SW(a)Absorption spectra of the SW(a)Absorption spectra of the SWCCCNTCNTNTNT(HiPco)(HiPco)(HiPco)----gelatin film(HiPco)gelatin filmgelatin film at the points (No.1~5 gelatin film at the points (No.1~5 at the points (No.1~5 at the points (No.1~5 points in
points in points in
points in Fig. Fig. Fig. Fig. 4444....5555 (b)) (b)) (b)) (b))....
0.7 0.8 0.9
1.4 1.6 1.8 2.0 2.2
No.1 No.2 No.3 No.4 No.5
Absorbance
Photon Energy [eV]
1 2 5 4 3
(a)
(b)
5 mm 5 mm
4 4 4
4.1..1..1.3.1.333 単層単層カーボンナノチューブ単層単層カーボンナノチューブカーボンナノチューブカーボンナノチューブ(HiPco)(HiPco)(HiPco)(HiPco)磁磁磁磁場場場場配向配向配向膜配向膜膜膜のののの偏光吸収偏光吸収偏光吸収偏光吸収測定測定測定測定
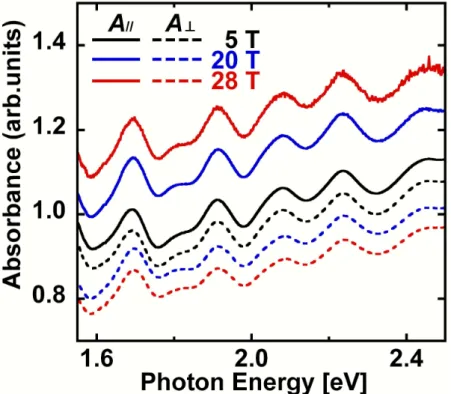
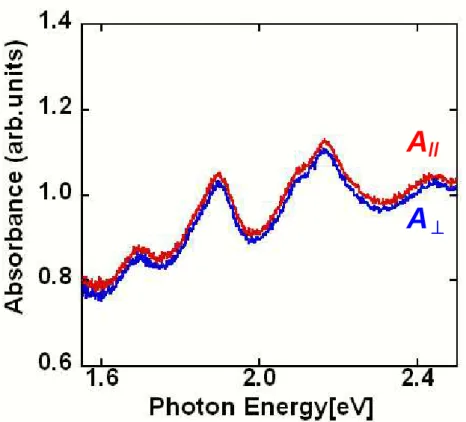
Fig. 4.6にゲル化時の印加磁場5 T,20 T,28 Tで作製されたSWCNT磁場配向膜の偏
光 吸 収 測 定 結 果 を 示 す . こ れ ら の 結 果 か ら , カ イ ラ リ テ ィ の 異 な る 何 種 類 か の 半 導 体 SWCNTの第2サブバンドに起因するシャープなピーク(1.7 eV,1.9 eV,,2.1 eV,2.2 eV 付近)が確認できた.5 Tで作製されたSWCNT磁場配向膜内のSWCNTの分散度を調査 するために4.1.1節と同様の解析方法によって1.9 eV付近のピークの半値幅を求めた.磁 場印加方向に対して偏光方向が平行な場合の吸光度(A//)のピークでは,0.075 eV,垂直な場 合の吸光度(A⊥) のピークでは,0.077 eVであった.SWCNT分散液の半値幅が0.074 eV であったことから考えると,2.3.2節において行った,ホモジナイザーによる超音波分散処 理および遠心分離機による処理によって高い分散度がほぼ保持された,高分散SWCNT磁 場配向膜が作製できたと言える.また,ゲル化時の印加磁場が増大に伴い, A//と A⊥の差 が拡大していくとともに,A⊥に見られる吸収ピークが減少する一方,A//に見られる吸収ピ ークが増大していく傾向が確認できた.これは印加磁場の増大に伴い,SWCNT が磁場印 加方向に揃っていくことを表した結果である.
5 T,20 T,28 Tの吸光度を比べてみると,5 Tのみ他と比べて低いことがわかる.これ は5 Tのみ別の厚さ(0.5 mm)のスペーサーを用いて作製したセルを用いて,磁場配向膜 を作製したためである.また,20 T,28 Tの試料も測定の関係上,サンプルをスライスし て測定を行ったため,すべて試料が等しい膜厚ではない.よってサンプルごとの厚みの違 いによる吸光度の違いをキャンセルするために,無偏光な吸収の成分:(A// +2A⊥)/3 (at
1.91 eV)でそれぞれの吸光度を規格化した.その結果をまとめたものをFig. 4.7に示す.こ
れを見ると吸光度を規格化したため,ゲル化時の印加磁場の増大に伴い,A//とA⊥の差が拡 大していく様子がよく理解できる.
(a)
(b)
A//
A⊥⊥⊥⊥
A//
A⊥⊥⊥⊥
5 T
20 T
Fig.
Fig.
Fig.
Fig. 4444....6666 Absorption spectra of the SWAbsorption spectra of the SWAbsorption spectra of the SWCAbsorption spectra of the SWCCCNTNTNT(HiPco)NT(HiPco)(HiPco)(HiPco)----gelatin films for the incident light gelatin films for the incident light gelatin films for the incident light gelatin films for the incident light polari
polari polari
polarized parallel (zed parallel (zed parallel (zed parallel (AAAA////////) or perpendicularly () or perpendicularly () or perpendicularly () or perpendicularly (AAAA⊥⊥⊥⊥) to the magnetic fields of (a)5 T, (b)20 T ) to the magnetic fields of (a)5 T, (b)20 T ) to the magnetic fields of (a)5 T, (b)20 T ) to the magnetic fields of (a)5 T, (b)20 T and (c)28 T applied during the sol
and (c)28 T applied during the sol and (c)28 T applied during the sol
and (c)28 T applied during the sol----gel transition.gel transition.gel transition.gel transition.
Fig.
Fig.
Fig.
Fig. 4444....7 7 7 7 Normalized aNormalized aNormalized absorption spectra of the SWNormalized absorption spectra of the SWbsorption spectra of the SWbsorption spectra of the SWCCCCNTNTNTNT(HiPco)(HiPco)(HiPco)----gelatin films for the (HiPco)gelatin films for the gelatin films for the gelatin films for the incident light polari
incident light polari incident light polari
incident light polarized parallel (zed parallel (zed parallel (zed parallel (AAAA////////) or perpendicularly () or perpendicularly () or perpendicularly () or perpendicularly (AAAA⊥⊥⊥⊥) to the magnetic fields of 5 T, ) to the magnetic fields of 5 T, ) to the magnetic fields of 5 T, ) to the magnetic fields of 5 T, 20 T and 28 T applied during the sol
20 T and 28 T applied during the sol 20 T and 28 T applied during the sol
20 T and 28 T applied during the sol----gel transition.gel transition.gel transition.gel transition.
(c)
A//
A⊥⊥⊥⊥
28 T
4 4 4
4.1..1..1.4.1.444 単層単層カーボンナノチューブ単層単層カーボンナノチューブカーボンナノチューブカーボンナノチューブ(HiPco)(HiPco)(HiPco)(HiPco)磁場磁場磁場磁場配向配向配向配向膜膜膜の膜ののの偏光偏光偏光偏光ラマンラマンラマンラマン測定測定測定測定
磁場配向膜中の SWCNTの配向を偏光吸収測定以外の方法でも確認するために,偏光ラ マン測定を行った.結果をFig. 4.8に示す.1591 cm-1に見られるピークは,G-bandであ り,グラファイト構造に起因したピークである.1330 cm-1 に見られるピークは,D-band であり,アモルファスカーボン等の不純物やグラファイト構造の欠陥に起因したピークで ある.これらの 2 つのピークもゲル化時の印加磁場の増大に伴い,磁場印加方向に対して 偏光方向が垂直な場合のラマン強度(I⊥)より平行な場合のラマン強度(I//)が大きくなった.
これは,偏光吸収測定の場合と同じく,印加磁場の増大に伴い,磁場配向膜中の SWCNT が磁場印加方向に揃っていき,SWCNTの配向性が向上していることを表した結果である.
またこの結果は他の研究結果とも一致している[4][5][6][7].
5 T
Fig.
Fig.
Fig.
Fig. 4444....8 8 8 8 Polarized Raman sPolarized Raman sPolarized Raman sPolarized Raman spectra of the SWpectra of the SWpectra of the SWpectra of the SWCCCNTCNTNTNT(HiPco)(HiPco)(HiPco)----gelatin films for the (HiPco)gelatin films for the gelatin films for the gelatin films for the VVVVVVVV geometry in the cases of the incident light polarized parallel (
geometry in the cases of the incident light polarized parallel ( geometry in the cases of the incident light polarized parallel (
geometry in the cases of the incident light polarized parallel (IIII////////) and perpendicularly ) and perpendicularly ) and perpendicularly ) and perpendicularly ((((IIII⊥⊥⊥⊥) to the direction of magnetic fields of (a) 5 T, (b) 20 T and (c) 28 T applied during the ) to the direction of magnetic fields of (a) 5 T, (b) 20 T and (c) 28 T applied during the ) to the direction of magnetic fields of (a) 5 T, (b) 20 T and (c) 28 T applied during the ) to the direction of magnetic fields of (a) 5 T, (b) 20 T and (c) 28 T applied during the sol
sol sol
sol----gel transition. gel transition. gel transition. gel transition.
28 T 20 T
4 4 4
4.1..1..1.5.1.555 単層単層カーボンナノチューブ単層単層カーボンナノチューブカーボンナノチューブカーボンナノチューブ(HiPco)(HiPco)(HiPco)(HiPco)磁場磁場磁場磁場配向配向配向配向膜膜膜の膜ののの配向度配向度配向度配向度についてについてについてについて
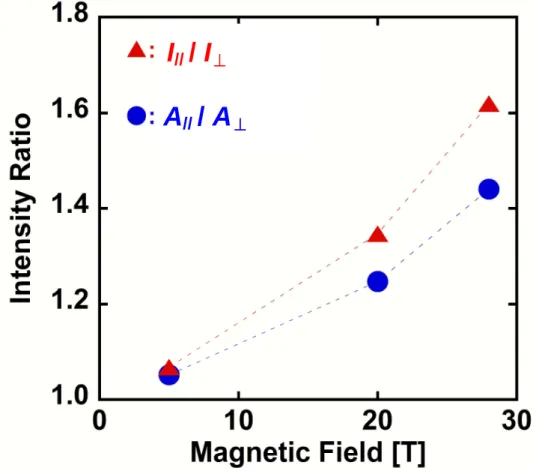
磁場配向膜中の SWCNT の配向をさらに議論するために,偏光吸収測定によって得られ た吸光度と偏光ラマン測定によって得られたラマン強度(G-bandの1591 cm-1),それぞれ の磁場印加方向に対して偏光方向が垂直な場合に対する平行な場合の 2 色比を考えた.そ のゲル化時の印加磁場に対する2色比をまとめたグラフがFig. 4.9である.ゲル化時の印 加磁場に対して,吸光度,ラマン強度それぞれの2色比(A// / A⊥,I// / I⊥)のいずれも2次関 数的に増加していることがわかる.2次関数的に増加していることについては,磁場配向エ ネルギーが磁場の強さの 2 乗に比例していることに関係があると思われるが,このことに ついてはさらなる研究が必要であろう.また,ラマン強度の2色比の方が,吸光度の2色 比よりも大きいことは,理にかなっている.なぜなら,光吸収強度はcos2φ に比例し,ラマ ン強度はcos4φに比例するためである(VV配置の場合)[8].ここでφは,SWCNTのチューブ 軸と入射光の成す角である.
Fig.
Fig.
Fig.
Fig. 444....9 49 9 Intensity ratios of absorption at 1.91 eV and Raman scattering for the G9 Intensity ratios of absorption at 1.91 eV and Raman scattering for the GIntensity ratios of absorption at 1.91 eV and Raman scattering for the GIntensity ratios of absorption at 1.91 eV and Raman scattering for the G----mode mode mode mode in the parallel configuration to those in the perpendicular configuration versus the in the parallel configuration to those in the perpendicular configuration versus the in the parallel configuration to those in the perpendicular configuration versus the in the parallel configuration to those in the perpendicular configuration versus the magnetic field applied during the sol
magnetic field applied during the sol magnetic field applied during the sol
magnetic field applied during the sol----gel transition. gel transition. gel transition. gel transition.
A// / A⊥⊥⊥⊥
I// / I⊥⊥⊥⊥
さらに議論を進めるために2.3.7.2節において説明したオーダーパラメーターを導入する.
このオ-ダーパラメーターを考えることによって,可視域光吸収測定結果から試料中の多
数のSWCNTが平均で何度の印加磁場方向に対して傾いているかという具体的な配向の様
子を評価することが可能となった.
(3 cos 1)
2 1 2
2 >−
<
+ =
= −
⊥
⊥ θ
A A
A A
∥
∥
α (4.1)
α:光学異方性
θ:SWCNTと印加磁場方向の間の角度
上記の式を用いて,今回は1.9 eV付近のピークに対応するカイラリティを持ったSWCNT の配向に関して調査するため,試料のゲル化時の印加磁場に対する膜の光学異方性を求め た.その結果をFig. 4.10に示す.Fig. 4.10に示すように,膜の光学異方性は印加磁場の増 大に伴い,28 Tで0.13まで向上した.また具体的に1.9 eV付近のピークに対応するカイ ラリティを持ったSWCNT が平均で何度の印加磁場方向に対して傾いているかを上記の光 学異方性より算出した結果を,Fig. 4.11に示す.これによると5 Tにおいて54.0度,20 T において51.7度,28 Tにおいて49.7度の角度でSWCNTが印加磁場方向に対して傾いて いるかわかった.また全く配向してランダムな場合は,54.7度となる.
さらに1.9 eV付近のピークに対応するカイラリティを持ったSWCNTの配向に関してよ
り詳細に理解するため,ベースラインを差し引いた正味の吸光度(B//, B⊥)を用いて下記の式 より,膜中のSWCNTの配向度として評価した.
(3 cos 1)
2 1 2
2 >−
<
+ =
= −
⊥
⊥ θ
B B
B B
∥
∥
β (4.2)
β:膜中のSWCNTの配向度
このようにベースラインを差し引いた正味の吸光度を用いるのは,吸収スペクトルは炭素 質の残留物(アモルファスカーボン等)やπプラズモンに由来する非偏光バックグラウンド を含むためであり,これらの影響を受けない本来のSWCNTの配向度を求めるためである.
またその正味の吸光度の求め方をFig. 4.12に示す.以上のような方法で求めた試料のゲル 化時の印加磁場に対する膜中のSWCNTの配向度をFig. 4.13に示す.Fig. 4.13に示すよ うに,膜中のSWCNTの配向度は,印加磁場の増大に伴い,28 Tで0.19まで向上した.
また具体的に1.9 eV付近のピークに対応するカイラリティを持ったSWCNTが平均で何度 の印加磁場方向に対して傾いているかを,Fig. 4.14に示す.これによると5 Tにおいて53.8 度,20 Tにおいて49.8度,28 Tにおいて47.4度の角度でSWCNTが印加磁場方向に対し
て傾いているかわかった.このように非偏光バックグラウンドを差し引いた正味の吸光度 を用いて膜中のSWCNTの配向度を評価を行なった結果,Fig. 4.10及びFig. 4.11の結果 と比較して,実際はよくSWCNTが配向している様子がわかった.
また Islamらの研究によって,SWCNT 合成の触媒である鉄などの金属が不純物として
SWCNTに含有している場合,低磁場領域においてSWCNTの配向を強く促すことがわか
っている[9].我々の研究においてその鉄触媒がどの程度,寄与したかは,判断するのは難 しい.1.2×104 Gで遠心分離処理を15時間行ってはいるが,完全に触媒で使用された鉄を 除去することは非常に困難なことから,ある程度,低磁場において鉄による配向の影響も 受けたと推察できる.不純物の鉄を除去することだけを考えるのではなく,その量をコン トロールしてやることで,低磁場下でSWCNTを効率よく配向させる有効な手段として利 用する価値があると思われる.
Fig.
Fig.
Fig.
Fig. 4444....10101010 Optical anisotropies of the SW Optical anisotropies of the SWC Optical anisotropies of the SW Optical anisotropies of the SWCCCNTNTNT(HiPco)NT(HiPco)(HiPco)----gelatin composite films at the (HiPco)gelatin composite films at the gelatin composite films at the gelatin composite films at the absorption peak energy of 1.9 eV with respect to the magnetic field applied during the absorption peak energy of 1.9 eV with respect to the magnetic field applied during the absorption peak energy of 1.9 eV with respect to the magnetic field applied during the absorption peak energy of 1.9 eV with respect to the magnetic field applied during the sol
sol sol
sol----gel tgel tgel transition. gel transition. ransition. ransition.
Fig.
Fig.
Fig.
Fig. 444....1141111 11 Average angle Average angle Average angle Average angle θθθθ estimated from o estimated from o estimated from o estimated from optical anisotropies of the ptical anisotropies of the ptical anisotropies of the ptical anisotropies of the SW
SW SW
SWCCCCNTNTNTNT(HiPco)(HiPco)(HiPco)(HiPco)----gelatin composite films at the absorption peak energy of 1.9 eV with gelatin composite films at the absorption peak energy of 1.9 eV with gelatin composite films at the absorption peak energy of 1.9 eV with gelatin composite films at the absorption peak energy of 1.9 eV with respect to the magnetic field applied during the sol
respect to the magnetic field applied during the sol respect to the magnetic field applied during the sol
respect to the magnetic field applied during the sol----gel transition. gel transition. gel transition. gel transition.
Fig.
Fig.
Fig.
Fig. 4444....12121212 The method of The method of The method of The method of calculationcalculationcalculationcalculation for net a for net a for net a for net absorbsorbsorbance(Bbsorbance(Bbance(Bbance(B////////, B, B, B, B⊥⊥⊥⊥) from ) from polarized) from ) from polarizedpolarized polarized a
a a
absorption spectra of the SWbsorption spectra of the SWbsorption spectra of the SWCbsorption spectra of the SWCCCNTNTNT(HiPco)NT(HiPco)(HiPco)(HiPco)----gelatin filmsgelatin filmsgelatin filmsgelatin films....
B⊥⊥⊥⊥
B//
Baseline Baseline
Fig.
Fig.
Fig.
Fig. 4444....131313 13 Orientation degree Orientation degree Orientation degree Orientation degree of the SWof the SWof the SWof the SWCCCCNTNTNT(HiPco)NT(HiPco)(HiPco)(HiPco)----gelatin composite films gelatin composite films gelatin composite films gelatin composite films calcucalcucalculatcalculatlatlated ed ed ed from
from from
from net anet anet anet absorbsorbsorbsorbancebancebancebance of 1.9 eV with respect to the magnetic field applied during the of 1.9 eV with respect to the magnetic field applied during the of 1.9 eV with respect to the magnetic field applied during the of 1.9 eV with respect to the magnetic field applied during the sol
sol sol
sol----gel transition. gel transition. gel transition. gel transition.
Fig.
Fig.
Fig.
Fig. 4444....141414 14 Average angle Average angle Average angle Average angle θθθθ estimated from orientation degree estimated from orientation degree of the estimated from orientation degree estimated from orientation degree of the of the of the SW
SW SW
SWCCCCNTNTNTNT(HiPco)(HiPco)(HiPco)(HiPco)----gelatin composite films gelatin composite films gelatin composite films gelatin composite films calculatcalculatcalculatcalculated fromed fromed from net aed fromnet anet anet absorbsorbsorbsorbancebancebancebance of 1.9 eV with of 1.9 eV with of 1.9 eV with of 1.9 eV with respect to the magnetic field applied during the sol
respect to the magnetic field applied during the sol respect to the magnetic field applied during the sol
respect to the magnetic field applied during the sol----gel transition. gel transition. gel transition. gel transition.
0.00 0.05 0.10 0.15 0.20
0 10 20 30
Orientation degree
Magnetic Field [T]
47 48 49 50 51 52 53 54 55
0 10 20 30
Average Angleθθθθ [degree]
Magnetic Field [T]
4.2 4.2 4.2
4.2 単層単層単層単層カーボンナノチューブカーボンナノチューブカーボンナノチューブカーボンナノチューブ(CoMoCAT)(CoMoCAT)(CoMoCAT)(CoMoCAT)磁場磁場磁場磁場配向配向配向膜配向膜膜膜のののの作製作製作製作製
SWCNTの特性はカイラリティによって変化する.現時点では,HiPco合成プロセスをは
じめ,すべてのSWCNT 合成プロセスにおいて,様々なカイラリティのチューブから成る 混合物として製造される.我々が作製するSWCNT磁場配向膜はSWCNTの基礎物性研究 分野において非常に活用が期待されている.その基礎物性研究においてはできるだけ,カ イラリティの分布が狭い試料を用いることに大きなメリットがある.そこで,カイラリテ ィ分布が非常に狭いことで知られる CoMoCAT 合成プロセス[10]で作製された試料を用い た,高分散・高配向磁場配向膜の作製を行った.
4.2.1 4.2.1 4.2.1
4.2.1 単層単層カーボンナノチューブ単層単層カーボンナノチューブカーボンナノチューブカーボンナノチューブ(CoMoCAT)(CoMoCAT)(CoMoCAT)(CoMoCAT)磁場磁場磁場磁場配向膜配向膜配向膜の配向膜ののの作製条件作製条件作製条件作製条件
CoMoCAT合成プロセスで作製されたSWCNTを用いて,4.1節と同様な実験を行った.
基本的には同じ手順で磁場配向膜を作製したが,以下の点においては異なる.
・ SWCNT分散液について
溶媒:重水 → 純水
SWCNT濃度:0.2 wt.% → 0.05 wt.%
・ 遠心分離処理について
遠心加速度:1.2×10⁴ G → 2.0×10⁴ G 遠心分離処理時間:15時間 → 12時間
・ 印加磁場
5 T,20 T,28 T→無磁場,1 T,4 T,7 T,10 T,12 T,15 T,18 T,22 T,24 T,26 T
4 4 4
4....2222....2222 単層単層カーボンナノチューブ単層単層カーボンナノチューブカーボンナノチューブカーボンナノチューブ(CoMoCAT)(CoMoCAT)(CoMoCAT)(CoMoCAT)分散液分散液分散液分散液ののの分散度の分散度分散度について分散度についてについてについて
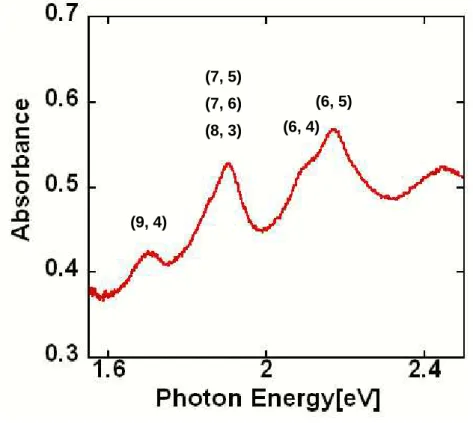
今 回 作 製 し た SWCNT(CoMoCAT)分 散 液 の 光 吸 収 測 定 結 果 を Fig. 4.15 に 示 す .
CoMoCAT試料はカイラリティ分布が狭いことが特徴であり,特に(6,5)と(7,5)のカイラ
リティのSWCNTが全体の38%を占めることが分かっている[10].実際,(7,5) と(6,5)
のSWCNTのもの思われるシャープなピークが,1.9 eVと2.2 eV付近に観測できるため,
ある程度の分散はできていると判断できる.しかし分散度についての詳細な議論は,4.1.1 節で行ったようなSWCNT(HiPco)分散液で比較したようなデータが無いため,半値幅の比
較 に よ る 議 論 は こ こ で はで き な い . そ れ で も 1.9 eV 付 近 の ピ ーク 位 置 をよ く 見 る と ,
CoMoCAT試料の代表的なカイラリティである(7,5)の第2サブバンドギャップである
1.92 eV[11]ではなく,1.89 eVであった.分散不十分で凝集しているチューブ同士の相互作
用により吸収ピークがレッドシフトすることは知られているが,さらに分散剤によるレッ ドシフトも考慮しなければならず,この場合,1.86 eV,1.91 eVに第2サブバンドギャッ プのある (8,3)や(7,6)のカイラリティをもつSWCNT(これらは試料全体の約20%を占め る)も試料に含有しているため,それらの吸収ピークの重ね合わせた効果によるものとも区 別がつかない.よってこのことからも分散の度合いは議論することは難しい.
Fig.
Fig.
Fig.
Fig. 4444.1.1.1.15555 Absorption spectra ofAbsorption spectra ofAbsorption spectra ofAbsorption spectra of a dispersiona dispersiona dispersion ofa dispersionofof SWCNT(CoMoCAT)ofSWCNT(CoMoCAT)SWCNT(CoMoCAT)SWCNT(CoMoCAT) usedusedusedused inininin thisthisthisthis studystudystudystudy with
with with
with ((((n,,,, m)))) indicesindicesindicesindices ofofofof semiconductingsemiconductingsemiconducting SWCNTsemiconductingSWCNTSWCNT..SWCNT......
4 4 4
4....2222....3333 単層単層カーボンナノチューブ単層単層カーボンナノチューブカーボンナノチューブカーボンナノチューブ(CoMoCAT)(CoMoCAT)(CoMoCAT)(CoMoCAT)磁場磁場磁場磁場配向配向配向配向膜膜膜の膜ののの偏光吸収偏光吸収偏光吸収偏光吸収測定測定測定測定
Fig. 4.16にまず,ゲル化時に磁場を印加しないで作製されたSWCNT磁場配向膜の偏光
吸収測定結果を示す.なお,この結果は,4.1.3節で行った規格化を同様に行った.結果は
A A SWCNT
(6, 5) (7, 5)
(7, 6) (8, 3)
(9, 4)
(6, 4)
散度が(ゼッカン)膜となってもその分散度がどの程度保持されたかを確認した.1.9 eV付近 の(7,5)の影響が強い吸収ピークについて,Fig. 4.15,Fig. 4.16のグラフそれぞれについ
て4.1.1節で行なった同様の方法で半値幅を見積もったところ,0.095 eV ,0.100 eVであ
った.この結果から,SWCNT 分散液の分散度がゼッカン膜となってもその分散度はほぼ 保持されていたことが確認できた.
次にFig. 4.17にゲル化時の印加磁場(a)1 T,(b)4 T,(c)7 T,(d)10T,(e)12 T,(f)15 T, (g)18 T,(h)22 T,(i)24 T,(j)26 Tで作製されたSWCNT磁場配向膜の偏光吸収測定結果 を示す.なお,これらの結果も,4.1.3で行った規格化を同様に行っていた。これらの結果
から,4.1.3節のHiPco試料の場合と同様に,7 Tまでの比較的低磁場領域と24 Tにおい
ては,多少傾向が異なるが,全体の傾向としては,ゲル化時の磁場が増加するにつれて,
A//と A⊥の差が拡大していくとともに,A⊥に見られる吸収ピークが減少する一方,A//に見
られる吸収ピークが増大していく傾向が確認できた.これは印加磁場が大きくなるにつれ
てSWCNTが磁場印加方向に揃っていくことを表した結果である.
Fig.
Fig.
Fig.
Fig. 4444.1.1.16.1666 Normalized a Normalized absorption spectra of the SW Normalized a Normalized absorption spectra of the SWbsorption spectra of the SWCbsorption spectra of the SWCCCNTNTNT(CoMoCAT)NT(CoMoCAT)(CoMoCAT)(CoMoCAT)----gelatin films for gelatin films for gelatin films for gelatin films for the incident light polarized parallel (
the incident light polarized parallel ( the incident light polarized parallel (
the incident light polarized parallel (AAAA////////) or perpendicularly () or perpendicularly () or perpendicularly () or perpendicularly (AAAA⊥⊥⊥⊥) to ) to no) to ) to nono magnetic fields no magnetic fields magnetic fields magnetic fields during the sol
during the sol during the sol
during the sol----gel transition.gel transition.gel transition. gel transition.
A//
A⊥⊥⊥⊥
(a)
(b)
A//
A⊥⊥⊥⊥
A⊥⊥⊥⊥
A//
1 T
4 T
(c)
(d)
A⊥⊥⊥⊥
A//
A//
A⊥⊥⊥⊥
7 T
10 T
(e)
(f)
A//
A⊥⊥⊥⊥
A⊥⊥⊥⊥
A//
12 T
15 T
0.6 0.8 1 1.2 1.4
1.6 2 2.4
Absorbance (arb.units)
Photon Energy[eV]
(g)
(h)
A⊥⊥⊥⊥
A//
A//
A⊥⊥⊥⊥
18 T
22 T
Fig.
Fig.
Fig.
Fig. 4444....17 17 17 17 Normalized aNormalized aNormalized absorption spectra of the SWNormalized absorption spectra of the SWbsorption spectra of the SWCbsorption spectra of the SWCCCNT(CoMoCAT)NT(CoMoCAT)NT(CoMoCAT)----gelatin films for NT(CoMoCAT)gelatin films for gelatin films for gelatin films for the incid
the incid the incid
the incident light polarized parallel (ent light polarized parallel (ent light polarized parallel (Aent light polarized parallel (AAA////////) or perpendicularly () or perpendicularly () or perpendicularly () or perpendicularly (AAAA⊥⊥⊥⊥) to the magnetic fields of ) to the magnetic fields of ) to the magnetic fields of ) to the magnetic fields of (a)1 T
(a)1 T (a)1 T
(a)1 T,,,,(b)4 T(b)4 T(b)4 T(b)4 T,,,,(c)7 T(c)7 T(c)7 T(c)7 T,,,,(d)10T(d)10T(d)10T(d)10T,,,,(e)12 T(e)12 T(e)12 T(e)12 T,,,,(f)15 T(f)15 T(f)15 T(f)15 T,,,,(g)18 T(g)18 T(g)18 T(g)18 T,,,,(h)22 T(h)22 T(h)22 T(h)22 T,,,,(i)24 T(i)24 T(i)24 T(i)24 T,,,,and (j)26 Tand (j)26 Tand (j)26 Tand (j)26 T applied during the sol
applied during the sol applied during the sol
applied during the sol----gel transition.gel transition.gel transition.gel transition.
(i)
(j)
A//
A⊥⊥⊥⊥
A⊥⊥⊥⊥
A//
24 T
26 T
4 4 4
4....2222....4444 単層単層カーボンナノチューブ単層単層カーボンナノチューブカーボンナノチューブカーボンナノチューブ((((CoMoCATCoMoCATCoMoCAT))))CoMoCAT磁場磁場磁場磁場配向配向配向配向膜膜膜の膜ののの配向度配向度配向度配向度についてについてについてについて
4.1.5 節 と 同 様 に ,1.9 eV 付 近 の ピ ー ク に 対 応 す る カ イ ラ リ テ ィ を 持 っ た
SWCNT(CoMoCAT)の配向に関して調査するため,試料のゲル化時の印加磁場に対する光
学異方性を求めた.その結果をFig. 4.18に示す.Fig. 4.18に示すように,光学異方性は印 加磁場の増大に伴い,26 Tで0.085まで向上した.また具体的に1.9 eV付近のピークに対 応するカイラリティを持ったSWCNTが平均で何度の印加磁場方向に対して傾いているか を上記の光学異方性より算出した結果を,Fig. 4.19に示す.これによると26 Tにおいて 51.4度の角度でSWCNTが印加磁場方向に対して傾いているかわかった.
さらに 4.1.5節と同様に,非偏光バックグラウンドの影響を受けない本来の SWCNT の
配向度を試料のゲル化時の印加磁場に対してプロットした結果を Fig. 4.20 に示す.Fig.
4.20に示すように,膜中のSWCNTの配向度は印加磁場の増大に伴い,26 Tで0.16まで 向上した.また具体的にSWCNT が平均で何度の印加磁場方向に対して傾いているかを,
Fig. 4.21に示す.これによると26 Tにおいて48.4度の角度でSWCNTが印加磁場方向に
対して傾いているかわかった.HiPco 試料の場合と同様に,非偏光バックグラウンドの影 響を受けない本来のSWCNTの配向度を用いて膜中のSWCNT(CoMoCAT)の配向度を評価 を 行 な っ た 結 果 ,Fig. 4.18 及 び Fig. 4.19 の 結 果 と 比 較 し て , 実 際 は よ く
SWCNT(CoMoCAT)が配向している様子がわかった.
またFig. 4.18及びFig. 4.20において,SWCNT(CoMoCAT)磁場配向膜の光学異方性及 び配向度についてさらに詳しく見ていくと,1Tで光学異方性が0.0079,配向度で0.0165 と大きく立ち上がっていることがわかる.このことは,4.1.5節における考察で述べたよう
に,SWCNT合成の際,使用されるコバルト等の触媒金属が不純物としてSWCNTに含有
している場合,低磁場領域においてSWCNT の配向を強く促す現象が起こることがわかっ ている.今回の場合,比較的低い磁場(1 T~4 T)を用いた磁場配向膜を作製したため,以 上のような現象が確認できたと思われる.
また,4.1節の実験で作製したHiPco試料を用いた磁場配向膜と今回の CoMoCAT試料 を用いた磁場配向膜を,非偏光バックグラウンドの影響を受けない本来のSWCNTの配向 度で比較してみると,Fig. 4.13及びFig. 4.20に示すように印加磁場に対する配向度の増加 傾向はほぼ同様な増加傾向であった.磁場配向エネルギーの式から,磁場によってナノチ ューブはそのチューブが長く,チューブ径が大きく,バンドルしているほど配向しやすい ことがわかる.分散度は,試料が異なるので半値幅による比較はできないので,議論する ことは難しいが,分散処理手順はほぼ同じであり,また,HiPco 試料と CoMoCAT試料で 同じカイラリティのSWCNTを多く含んだ試料で比べているため,平均直径も大きな差は ないと思われる.またチューブの長さについてはHiPco試料とCoMoCAT試料共に不明で あるが,上記のことを踏まえるとそれぞれの試料のチューブの長さはほぼ同程度ではない かと推察できる.