GEOGRAPHICAL REPORTS
OF TOKYO METROPOLITAN UNIVERSITY 50 (2015) 29–35
THE RESTORATION SITUATION OF INTER-CITY PUBLIC TRANSPORTATION SERVICE LEVEL AFTER THE GREAT EAST JAPAN EARTHQUAKE
IN THE SANRIKU REGION
Hitoshi YAGAI*
Abstract The railways and roads in the Sanriku region have been damaged by the Great East Japan Earthquake that occurred on 11 March 2011. From that time on, it has been very difficult to move between neighboring cities. This paper measures the restoration situation of inter-city traveling time (waiting time + required transit time) by comparing the situation before and after the earthquake. As a result, we find that the inter-city public transportation service level after the earthquake has been recovered to the level before the earthquake, not only in the resumed railway section, but also in the section operated as alternative highway buses and temporary Bus Rapid Transit (BRT), so it became clear that the highway buses and BRT are effective for disaster recovery.
Key words: disaster recovery efforts, service level, inter-city traveling time, public transportation, BRT
1. Introduction
The Great East Japan Earthquake that occurred on 11 March 2011 caused severe damage especially to the Sanriku coastal area as a result of the earthquake and major tsunami. Because of this disaster, the railways and roads in the Sanriku region have been damaged, and it was very difficult to move in the Sanriku coastal area.
After this earthquake, the government promptly started to implement the “Kushinoha (teeth of a comb) Strategy” to carry relief goods from major inland cities to major coastal cities (Fig. 1).
Following this strategy, the railways and roads were repaired between major inland cities to major coastal cities first, and then in the coastal area.
Because railway restoration takes a lot of time and money, we consider that it is very important to maintain the service level for transportation (Ieda 2011) and bus operation is effective as an alternative to railways (Nakamura 2011). In the closed section under the agreement between the local government and railway companies, the JR Kesennuma Line resumed in December 2012 and the JR Ofunato Line resumed in April 2014 as temporary BRT. The Sanriku Railway Kitariasu Line and Minamiriasu Line resumed in April 2014. As of September 2014, the JR Yamada Line,
* The Institute of Behavioral Sciences.
- 29 -
JR Senseki Line and JR Ishinomaki Line operate alternative buses on certain sections (Fig. 2b).
This paper calculates the restoration situation of the public transportation service level by comparing the situation (1) before the earthquake (January 2011), (2) after the earthquake (September 2011 when the emergency measures were completed) and (3)now (September 2014) to use the inter-city traveling time (waiting time + required transit time) as an index in the Sanriku region. The aim of this paper is to evaluate the effects of the recovery of railways, alternative bus operations and temporary BRT operations in terms of the service level of public transportation.
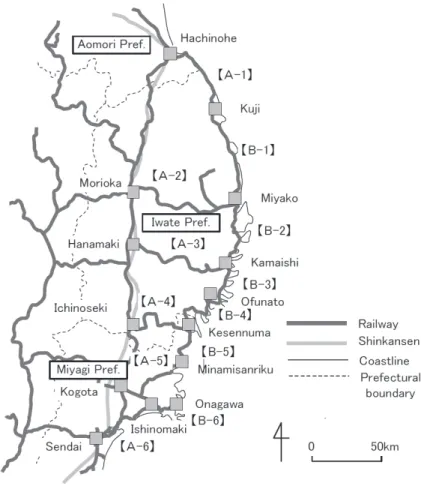
Fig. 1 Study area and sections.
2. Methods
Cities and point of time surveyed
This paper deals with the sections between 14 neighboring cities, which are key railway hubs in the Sanriku region. There are total of 12 sections, which consist of 6 sections (A-1 to A-6) connecting major inland cities and major coastal cities and 6 sections (B-1 to B-6) within major coastal cities (Fig. 2a).
- 30 -
The following are the points of time surveyed: (1) before the earthquake (January 2011), (2) after the earthquake (September 2011 when the emergency measures were basically completed) and (3) now (September 2014). Fig. 2b shows the situation of the resumed railway after the earthquake.
We use the published time table as of January 2011 and September 2014 (JTB Publishing ed.
2011, 2014). For September 2011, we use the time table provided via the internet by the transportation companies, given that temporary/irregular train and bus schedules were mainly used in that period.
(a) (b)
Fig. 2 Railway network in the Sanriku region (a) and resumed railway after the earthquake (b).
- 31 -
The idea of traveling time
Based on the idea of time geography, the reachable area and time period by a certain transportation method are restricted by the capability constraints e.g., the time table and traveling speed. The reachable domain can be drawn as a time-space prism (Thrift 1977; Sugiura 1989).
The traveling time from a city to a neighboring city at a point of time is the accessibility of the starting point as the traveling time of the shortest path from origin to destination in the time-space prism.
As the author applied the idea of the accessibility to the evaluation of the area in a city (Yagai 1988), this paper uses inter-city traveling service level. This accessibility is thought to be impacted by measures taken by the government, the community and transportation companies to respond to damaged public transportation networks after the earthquake, and can be considered as one index to evaluate the disaster recovery strategy.
Table 1 Measuring method of the traveling time
【B-2】Miyako→Kamaishi
Method for measuring the traveling time
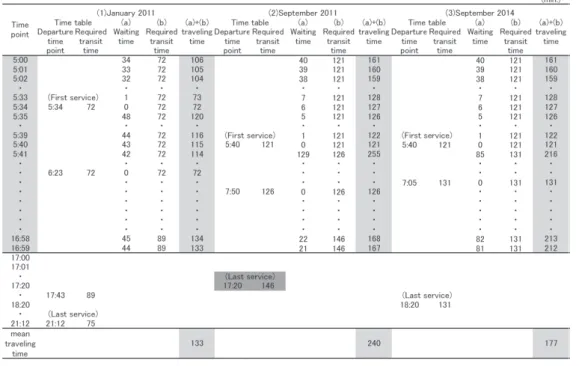
Public transportation includes railways and buses connecting between neighboring cities. The timetable of the inbound direction is used. The traveling time is the total of the waiting time to the next departure time and the required transit time.
The traveling time is calculated from 5:00 a.m. to the departure time of the last service in one minute intervals. In order to compare the 3 time points, the calculation lasts until the earliest
- 32 -
departure time among the three last services. The traveling time for each section is the mean from 5:00 to one minute to the hour before the last departure time in one minute intervals. For example, if the last departure time is 17:20, the traveling time is the mean from 5:00 to 16:59. As of September 2011, for the sections (B-1, B-4) for which service would be closed before the evening, the traveling time is not calculated only at the time point (Table 1).
3. Results
The restoration situation of public transportation is shown by the ratio of the traveling time before (January 2011) and after the earthquake (Table 2). The sections (A-1 to A-6) connecting major inland cities and major coastal cities were restored to the service level before the earthquake as of September 2011. The degree of the restored service level of the sections (B-1 to B-6) within major coastal cities is different because of the means of transportation.
Table 2 The restoration situation of the inter-city traveling time index
Railroad resumed sections ((2) September 2011: A-2, A-3, A-4, (3) September 2014: A-1, B-1, B-3)
The service of the sections connecting major inland cities and major coastal cities recovered to the pre-quake level as of (2) September 2011 thanks to the resumed railway service (A-2, A-3,
- 33 -
A-4). The service level of the sections for which the railroad resumed by (3) September 2014 also recovered (A-1, B-1). For the B-3 (Kamaishi-Ofunato) section, the recovery ratio remains at 1.30, because of the longer transit time due to some reduced speed sections and the number of trains being reduced to 70% of the pre-quake level.
Temporary resumed sections as BRT ((3) September 2014: A-5, B-4, B-5)
In the sections which resumed temporarily (A-5, B-4, B-5), the services have almost recovered to the pre-quake level. BRT is effective to shorten traveling time, because of the waiting time shortened by the short service interval (30 minutes, 1 hour) compared to the former railway services (1-2 hours).
Not resumed sections (A-6, B-2, B-6)
In the sections in which alternative buses operate, the service level has not recovered yet because of the long traveling time due to fewer services. But in the A-6 (Ishinomaki-Sendai) section, the service level maintains the level before the earthquake because the highway bus operates every 20-30 minutes instead of railways.
In the B-2 (Miyako-Kamaishi) section where there is no restoration plan, the restored ratio recovered to 1.33 as of September 2014 because of the increased number of alternative bus operation services since September 2011. In the B-6 (Onagawa-Ishinomaki) section, alternative buses operate in some sections, and the resumed ratio recovered to 1.08 because of the shortened alternative bus section and the time table in tune with railways.
4. Conclusion
The railways and roads which were damaged by the Great East Japan Earthquake are being restored by the special efforts of the national government, local governments, railway companies and bus companies. The traveling time (waiting time + required transit time) is calculated from 5:00 a.m. to the departure time of the last service in one minute intervals. We measured the restoration situation by comparing the inter-city public transportation service level before and after the earthquake, using the mean traveling time.
As a result, the sections from the major inland cities to the major coastal cities (A-1 to A-6) resumed railway operations and the service level recovered. In the A-6 (Ishinomaki-Sendai) section, alternative highway bus services maintain the pre-quake level in spite of partial railway service suspension.
In the section (B-1 to B-6) between major coastal cities damaged by tsunami, the railway resumed section has almost recovered to the service level before the earthquake. The temporary BRT sections (A-5, B-4, B-5) maintain the service level before the earthquake, and a certain section maintains a better level thanks to the shortened operation interval, although longer transit time is required. It became clear that BRT is effective to maintain the service level in the section operated as alternative highway buses, as the service level has not recovered yet with railway service suspension.
BRT in the Sanriku region is effective to improve the service level. One reason is the use of the former railway tunnel section shortening the traveling distance compared to the tortuous roads, because of the special topographical distinction of riasushiki kaigan (sawtooth coastline). The other reason is the shorter operation interval (30 minutes, 1 hour) compared to the former railway
- 34 -
services (1-2 hours).
It became clear that highway buses and BRT can maintain the inter-city public transportation service level, in the case the public transportation network is cut off and there are no plans for railway restoration.
Acknowledgement
I thank Professor Yoshio Sugiura, for introducing me to the idea of time geography to analyze urban transportation and leading me warmly.
References
Ieda, H. 2011. To revive the public transportation service in the coastal disaster area: rationally choosing from various alternatives. Transportation & Economy 71(8): 57-60.*
JTB Publishing ed. 2011. JTB Jikokuhyo (JTB Time Table) January 2011. 87(1). Tokyo: JTB Publishing .*
JTB Publishing ed. 2014. JTB Jikokuhyo (JTB Time Table) September 2014. 90(9) Tokyo: JTB Publishing .*
Nakamura, F. 2011. To learn from earthquake disasters in ensuring mobility: an expectation of the bus system as strongly recuperative transportation infrastructure. Transportation & Economy 71(8): 61-63.*
Sugiura, Y. 1989. Ricchi to kukantekikodo (Location and Spatial Behavior). Tokyo: Kokonshoin.*
Thrift, N. 1977. An Introduction to Time Geography. Concepts and Techniques in Modern Geography No. 13. Norwich: Geo Abstracts.
Yagai, H. 1988. The daily rhythm from the number of public transportation services in Sendai city.
The Human Geography (Jimbun-chiri) 40(6): 74-88.*
(*: in Japanese)
- 35 -