anthropometric and segmental body composition variables using computed tomography
著者 Demura Shinichi, Sato S., Noguchi T., Nakata Y.
journal or
publication title
Sport Sciences for Health
volume 2
number 1
page range 16‑22
year 2007‑05‑01
URL http://hdl.handle.net/2297/6601
Original Article
Title: Prediction of Visceral Fat Area by Computed Tomography from Anthropometric and Segmental Body Composition Variables
Authors: Shinichi Demura,
1Susumu Sato,
2*Takanori Noguchi,
1Yoshio Nakata,
35
10
15
20
1
Graduate school of Natural Science and Technology, Kanazawa University Kakuma, Kanazawa, Ishikawa 920-1192 Japan.
2
Kanazawa Institute of Technology
Ohgigaoka 7-1, Nonoichi, Ishikawa, 921-8501, Japan.
3
Institute of Health and Sport Sciences, University of Tsukuba, Tennohdai 1-1-1, Tsukuba, Ibaraki 305-8574 Japan.
Running head: Prediction of VFA from anthropometry and segmental body composition Key Words: subcutaneous fat thickness, segmental percent fat, dual-energy x-ray absorptiometry
*Corresponding author: Susumu Sato,
Life-long Sports Core, Kanazawa Institute of Technology, Ohgigaoka 7-1, Nonoichi, Ishikawa 921-8501 Japan.
Phone: +81-76-248-1100 ( ext. 2386 ) , Fax: +81-76-294-6704.
e-mail: [email protected]
Abstract
The purpose of this study was to estimate the area of visceral fat at the L4-L5 level (VFA
L4-5) measured by computed tomography (CT) from anthropometric and segmental percent fat (%SF) variables. Subjects were 73 adults: 50 males and 23 females aged 24 to 78 years. Cross-validation was examined with another 38 adults: 25 males and 13 females aged 21 to 80 years. The anthropometric variables used were height, weight, waist circumference, hip circumference, sagittal diameter, and subcutaneous fat thickness (SFT) at 14 sites. SFT and %SF were measured by ultrasound and dual-energy x-ray absorptiometry (DXA), respectively. A combination of suitable predictors of VFA
5
10
15
20
L4-5
was derived by stepwise multiple regression analysis using these variables. A prediction equation was obtained that used seven predictors: sagittal diameter, waist circumference, three subcutaneous thickness variables (subscapula, chest 1 and abdomen), %SF
trunkand %SF
leftleg(R
= 0.902, R
2= 0.813, SEE = 17.5 cm
2). In a Bland-Altman procedure, systematic error was not found in the original group but was only found in females in the cross-validation group. The percentage of the SEE of the prediction equation for the mean VFA
L4-5value was 22.5% in the original group and 20.1% in the cross-validation group. Furthermore, the percentages of SD values of the error for the mean VFA
L4-5value were 21.1% in the original group and 22.2% in the cross-validation group.
These values were comparable or superior to those in previous studies. These results provide a useful prediction equation for VFA
L4-5from anthropometry and segmental body composition variables.
Key Words: subcutaneous fat thickness, segmental percent fat, dual-energy x-ray absorptiometry
Introduction
Abdominal visceral fat is strongly related to the risk of various diseases such as coronary artery disease, coronary heart disease and diabetes mellitus. Considering the fact that metabolic syndrome is widespread and increasingly found in younger people, more practical and non-expensive procedures are required to estimate abdominal visceral fat in a field setting. To date, only computed tomography (CT) and magnetic resonance imaging (MRI) are capable of directly measuring abdominal visceral fat (Despres et al., 1996), but these methods are costly. Thus, the prediction method of abdominal visceral fat, that can directly and inexpensively measure abdominal visceral fat and be used in a clinical or field setting, is required. Several studies have examined suitable anthropometric substitutions in an attempt to find substitutes. These studies attempted to predict abdominal visceral fat from anthropometric and dual-energy x-ray absorptiometry (DXA) measurements (Bertin et al., 2000; Busetto et al., 1992; Clasey et al., 1999; Jensen et al., 1995; Park et al., 2002; Snijder et al., 2002; Suh et al., 2002), and suggesting that DXA measurements, such as abdominal fat mass, subcutaneous fat width at the umbilical level, and transverse internal diameter, were suitable predictors.
5
10
15
20
25
Accumulation of abdominal visceral fat was reported to relate to not only general obesity level but
also body fat distribution patterns, such as abdominal obesity or lower body obesity. Segmental body
composition variables can be used to assess body fat distribution, and the importance of assessment
of them has been recognized. However, the validity of these segmental body composition variables
as predictors of abdominal visceral fat was not sufficiently examined. These segmental body
composition variables can be expected to have the possibility of being useful predictors of abdominal
visceral fat when combining with anthropometry. If abdominal visceral fat can be accurately
predicted from these segmental body composition variables, it would contribute to improving the
simplicity of abdominal visceral fat prediction, because bioelectrical impedance systems, which can
estimate segmental body composition, have been recently developed (Pietrobelli et al., 2004;
Bedogni et al., 2002; Cha et al., 1997). These bioelectrical impedance systems are inexpensive compared to imaging techniques, and they can provide a great advantage to application in a field setting.
This study aimed to examine whether VFA
L4-5can be estimated from anthropometric and segmental body composition measurements.
5
Methods Subjects
The subjects were 73 adults: 50 males and 23 females aged 21 to 80 years. Their mean physical characteristics were: males: 45.5 ± 12.2 years, 171.0 ± 6.0 cm, 67.7 ± 11.4 kg; and females: 51.8 ± 15.9 years, 155.2 ± 8.0 cm, 53.3 ± 7.7 kg. Further information on their physical characteristics is shown in Table 1. For an examination of cross-validation, 38 volunteer subjects (25 males and 13 females) were recruited. Their mean characteristics were: males: 42.2 ± 16.3 years, 170.8 ± 7.0 cm, 67.8 ± 8.3 kg and BMI = 23.2 ± 2.5 m
10
15
20
2
/kg; and females: 43.3 ± 14.2 years, 157.0 ± 5.3 cm, 54.1 ±
7.2 kg and BMI = 22.0±3.1 m
2/kg. [Table 1 about here]
We explained the aim and design of the study to each subject before obtaining their written informed consent. This study was approved by the Human Subject Ethical Committee of Kanazawa University and the Human Investigation Review Committee of the University of Tsukuba. All subjects had measurements conducted by anthropometry, subcutaneous fat thickness, CT, and DXA methods. Before starting the measurements, the subjects were asked to fast for two hours, to avoid exercise, and to excrete. During measurements, the subjects wore only swimsuits and a light cotton shirt.
Anthropometry
This study used anthropometry of height, weight, waist circumference, hip circumference and
25
sagittal diameter. Height and weight were measured by a standard procedure. Waist and hip circumferences were determined with a flexible plastic tape measure, while subjects were standing, to the nearest 0.1 cm at the end of expiration. Waist and hip circumferences were obtained at the umbilical level and the level of the largest circumference, respectively. The sagittal diameter, the distance between the abdomen (umbilicus) and the back, was measured as the distance between the blades of the caliper at the end of expiration, while subjects were in a supine position.
5
Ultrasound
This study measured subcutaneous fat thickness by ultrasound using an EU-2002B (ELK Corp., Osaka, Japan). A suitably trained ultrasound tester measured the thickness of each site once. In line with previous studies (Komiya et al., 2000, 1992, 1986), subcutaneous fat thickness was measured at 14 sites: the right cheek, chin, chest 1 ( diagonal fold just superior and lateral to the nipple ) , chest 2 ( vertical fold on the midaxillary line at the level of the xiphoid process ) , abdomen, suprailiac, triceps, subscapula, back 1 ( vertical fold just adjacent to and level with the vertebra prominence ) , back 2 ( vertical fold just adjacent to the spinal column and level with and just below the arcus costalis ) , thigh 1 ( vertical fold on the anterior aspect of the thigh midway between the superior aspect of the patella and anterior superior iliac spine ) , thigh 2 ( vertical fold on the posterior aspect of the thigh ) , knee, and calf ( vertical fold on the posterior aspect of the calf at the level of maximum circumference, subject seated with lower leg dangling ) .
10
15
20
DXA scan
This study determined percent fat of each segment (right arm, left arm, right leg, left leg and trunk)
by a dual-energy x-ray absorptiometry system (DPX-L; Lunar Radiation Corp., Madison, WI; whole
body scanning, software version 1.3Z). In a DXA scan, bone mineral content, fat mass and bone-free
lean tissue mass were measured from the differences in absorption rates when penetrated by two
25
x-rays, one high-energy (80-100 keV) and the other low-energy (40-50 keV). A trained radiology technician performed the measurements on subjects who were wearing only a swimsuit and a light cotton shirt to minimize clothing absorption. DXA measurements were performed following standard procedures according to the manufacturer’s guidelines while the subject was lying in a supine position on a table. Whole body scanning time was 20 min, and total x-ray irradiation absorbed by a subject was 5 mrems or lower, which corresponds to 10% of a standard chest X-ray film.
5
CT scan
This study assessed abdominal visceral fat by visceral fat area at the L4-L5 levels (VFA
L4-5) using CT scans (Somatom AR.C; Siemens, Erlangen, Germany) performed on subjects in a supine position.
The visceral fat area and subcutaneous fat area were calculated using a software program (FatScan;
N2system, Osaka, Japan) (Yoshizumi et al., 1999). First, a region of the subcutaneous fat layer was defined by tracing its contour on each scan, and then the range of CT values (in Hounsfield units) for fat tissue was calculated. Total fat area was determined by delineating the surface having a mean CT value plus or minus 2 standard deviations, and the VFA
10
15
L4-5
was measured by drawing a line within the muscle wall surrounding the abdominal cavity. The subcutaneous fat area was then calculated by subtracting the VFA
L4-5from the total fat area.
Statistics 20
25
To predict VFA
L4-5measured by the CT method, stepwise multiple linear regression analysis was
conducted using sex, age, height, weight, body mass index (BMI), waist circumference, sagittal
diameter, WHR, subcutaneous fat thicknesses at 14 sites, segmental percent fat at 5 segments and
percent body fat as predictors. For each selected independent variable, single regression analysis was
then applied to confirm the advantage of combining these variables. Furthermore, to examine the
systematic error between the observed and predicted values, errors (observed value minus predicted value) and observed values were plotted based on the Bland-Altman technique. The limits of agreement defined as mean ± 2SD of the error were also calculated.
Cross-validation of the obtained equation was examined for the cross-validation group. Multiple regression analysis using the same independent variables was carried out for the cross-validation group. To examine the prediction accuracy and systematic error of the prediction equation obtained from the original group, a Bland-Altman plot was conducted for the estimation error when applying the prediction equation to the cross-validation group.
5
10 Results
Development of the prediction equation for VFA
L4-5Table 2 shows the results of the stepwise multiple regression analysis. A prediction equation was obtained using the following predictors: two anthropometric variables (sagittal diameter and waist circumference), three subcutaneous fat thickness variables (subscapula, chest 1 and abdomen), and two segmental percent fat variables (trunk and left leg). [Table 2 about here]
15
20
25
VFA
L4-5= 5.758X
1+ 1.688X
2- 1.303X
3+ 0.738X
4- 2.007X
5+ 4.495X
6- 4.904X
7- 152.227 (Eq.1) X
1: sagittal diameter (cm), X
2: waist circumference (cm), X
3: subcutaneous fat (chest 1) (mm), X
4: subcutaneous fat (abdomen) (mm), X
5: subcutaneous fat (subscapula) (mm),
X
6: segmental percent fat (left leg) (%), X
7: segmental percent fat (trunk) (%)
The R, R
2and standard estimation error (SEE) values were 0.902, 0.813 and 17.5 cm
2,
respectively. The percentage of the SEE for the mean value of VFA
L4-5was 22.5%. Furthermore, we
conducted single regression analysis using each selected variable as an independent variable and
VFA
L4-5as a dependent variable (Table 2). Significant correlations were found in all seven
independent variables. The highest single correlation was shown in sagittal diameter, and the lowest was shown in subcutaneous fat on the chest. By combining these independent variables, the coefficient of determination and SEE were improved about 13% and 4.3 cm
2, respectively.
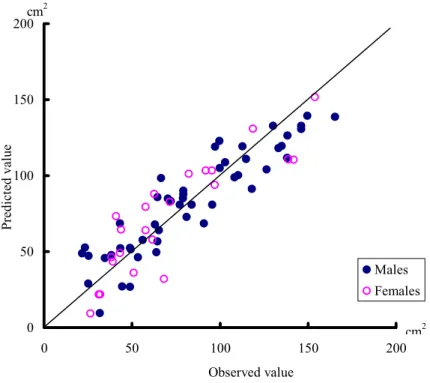
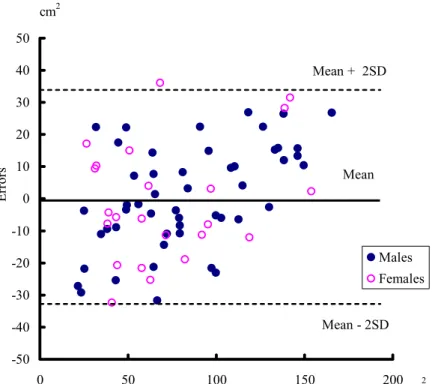
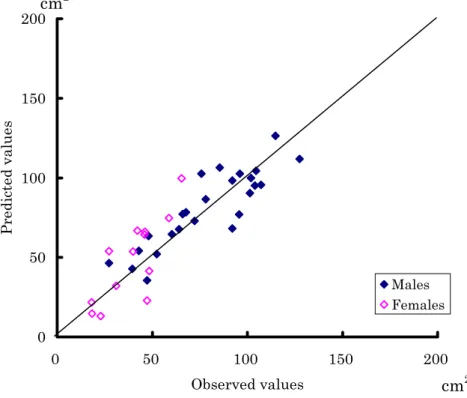
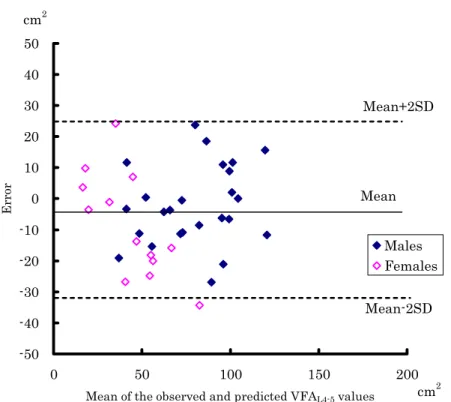
A scatter plot of the observed and predicted values is shown in Figure 1. Figure 2 shows a Bland-Altman plot between the error and the mean of observed and predicted values. The mean ± SD of the error was 0.0 ± 16.4 cm
5
10
2
and the limits of agreement were ± 32.8 cm
2. The percentage of the SD values of the error for the mean VFA
L4-5value was 21.1%. Systematic error was not found.
The prediction errors were within the range of the limits of agreement, except for one subject (one male: VFA
L4-5= 68.1 cm
2, error = 36.1 cm
2). [Figure 1 and Figure 2 about here]
Cross-validation of the prediction equation
To cross-validate the prediction equation, multiple regression analysis with same independent and dependent variables was conducted with the cross-validation group. As a result, the same seven independent variables were selected, and the R, R
2and SEE values were 0.911, 0.830 and 13.61 cm
2. Single regression analyses were conducted for each independent variable, and significant relationships were found except for subcutaneous fat thicknesses on the chest and abdomen.
Combining these independent variables, the coefficient of determination and SEE were improved by 13.6% and 3.5%, respectively. The correlation coefficient and SEE between the observed and predicted values, when applying the prediction equation obtained from the original group (Eq. 1) to the cross-validation group, were 0.876 and 14.5 cm
15
20
25
2
, respectively (Figure 3). [Figure 3 about here]
Bland-Altman plots for the observed and predicted values when applying Eq.1 to the
cross-validation group are shown in Figure 4. The mean and standard deviation of the error were
-4.49 ± 14.50 cm
2and the limits of agreement ranged from -33.49 to 24.50 cm
2. The percentage of
the SD value of the error for the mean VFA
L4-5value was 22.2%. Systematic error was not found in
the total sample, but was found in the female group. [Figure 4 about here]
Discussion
Since the late 1990s, studies have been made on the estimation of total abdominal fat mass or VFA
L4-5from anthropometry and DXA measurements (Clasey et al., 1999; Jensen et al., 1995; Park et al., 2002; Snijder et al., 2002; Suh et al., 2002). In previous studies, however, predictors for estimating VFA
L4-5have not been consistent. Park et al. (2002) and Suh et al. (2002) reported that WHR was a useful predictor, while Clasey et al. (1999) indicated that WHR was a poor predictor of visceral fat mass. WHR has been widely used as a practical index to assess abdominal obesity.
However, it has been reported that the correlation between WHR and abdominal visceral fat is not always high (Ferland et al., 1989; Pouliot et al., 1994; Ross et al., 1992; Seidell et al., 1988; Sjostrom et al., 1988).
5
10
15
20
25
Furthermore, it was reported that the relationships between VFA
L4-5and anthropometric measurements (BMI, waist circumference, WHR) and percent fat measured by DXA were different among levels of obesity (Suh et al., 2002; Despres et al., 1991) and among age groups (Despres et al., 1996). The suitability of sagittal diameter and waist circumference for predicting VFA
L4-5has been reported in previous studies (Despres et al., 1991; Pouliot et al., 1994; Ross et al., 1992;
Steven-Simon et al., 2001). In addition, Steven-Simon et al. (2001) reported that subcutaneous fat thickness at the costal, iliac and subscapular and the sum of thee three subcutaneous fat thickness values was significantly related to VFA
L4-5measured by CT.
In this study, seven useful predictors were determined: sagittal diameter, waist circumference,
three subcutaneous fat thickness variables (chest 1, abdomen and subscapula) and two segmental
percent fat variables (trunk and left leg). These variables were also selected in the cross-validation
group. Among these variables, segmental percent fat of the trunk is expected to relate to the amount
of abdominal fat, and segmental percent fat of the leg and the trunk may closely relate to the
characteristics of body fat distribution pattern. Furthermore, the subcutaneous fat on the chest,
abdomen and subscapula were selected. Subcutaneous fat thick ness on the central body may closely
relate to abdominal fat or general obesity level However, these subcutaneous fat variables showed poor contributions compared with other predictors in single regression analyses using each variable as an independent variable. In the cross-validation group, since subcutaneous fat on the chest and abdomen showed non-significant regression coefficients, further examinations may be required on the contributions of these variables in the prediction of VFA.
5
10
15
20
25
This study examined the prediction equation composed to these predictors from the points of amounts of explained variability, estimation error and systematic error. The prediction equation composed of these seven variables could explain 81% of the variance of VFA
L4-5, and the SEE was 17.5 cm
2. Despres et al. (1991), Ferland et al., (1989) reported an equation that can explain about 70% of variance of VFA
L4-5from only anthropometry measurements. Furthermore, Owens et al., (1999) and Suh et al. (2002) proposed equations which can explain 80% and 75% of variance in visceral adipose tissue measured by CT combining DXA measurements with anthropometry, respectively. It is, therefore, considered that the coefficient of determination obtained in this study was comparable or superior to those in previous studies.
The SEE value of Eq. 1 was 17.5 cm
2in the original group, and the percentage for the mean value of VFA
L4-5in the original group (77.8 cm
2) was 22.5%. The SEE value, when developing a prediction equation from the same seven independent variables for the cross-validation group, was 13.6 cm
2in the cross-validation group, and its percentage for the mean VFA
L4-5value in the cross-validation group (65.1 cm
2) was 20.1 %. In previous studies, Owens et al. (1999), who examined a prediction equation for abdominal visceral fat from anthropometry measurements, interpreted that the error of the prediction equation was small because the percentage of the SEE of the equation for the mean abdominal visceral fat value (23.9%) was less than 25%.
The percentages of the standard deviation of the error (observed value minus predicted value) for
the mean value of VFA
L4-5were 21.1 % (16.4 cm
2) in the original group and 22.2 % (14.5 cm
2) in
the cross-validation group. Bertin et al. (2000) predicted VFA
L4-5by DXA combined with
anthropometry measurements (sagital diameter, subcutaneous fat width, transverse internal diameter, height), and the standard error of difference (reference minus predicted values) was 19.5%. Armellini et al. (1993, 1997) examined prediction of VFA
L4-5from some anthropometry measurements, such as sagittal diameter, waist to hip ratio, abdominal subcutaneous thickness, waist circumference and weight, and they reported the standard error of the differences were 23.6% (Armellini et al., 1993) and 29% (Armellini et al., 1997), respectively. Thus, these indicate that the prediction accuracy of the equation obtained in this study is within an allowable range for the estimation of VFA
5
10
15
20
25
L4-5
.
In the Bland-Altman plot, there was no systematic error in the original group. Although the subjects in our original group tended to be somewhat overweight, subjects with various obesity level or ages were included in both the male and female groups: BMI: 23.1 ± 3.4 (range 15.7 to 34.6) in males, and 22.2 ± 3.4 (range 16.2 to 29.8) in females; percent total body fat: 24.5 ± 7.1% (range 8.1 to 36.3%) in males, and 30.4 ± 7.2% (range 14.8 to 43.1%) in females; age range: 24 to 78 years. It is, therefore, considered that the prediction equation of this study can be applied to samples with various characteristics. However, when applying Eq. 1 to the cross-validation group, the mean error was -4.49 cm
2, and Eq. 1 tended to overestimate VFA
L4-5compared with CT measurement. Systematic error was not found in the total cross-validation group, but was found only in female subjects. The VFA
L4-5levels of the female sample in the cross-validation group were lower than those of the original group. Further examination based on a sample with various VFA
L4-5levels may be required.
The prediction equation obtained in this study uses seven predictors, of which three are
subcutaneous fat variables and two are segmental percent fat variables. Although the measurements
of subcutaneous fat thickness and sagittal diameter require skill and experience, they are very
practical compared with the costs and specificity of measurements by CT or MRI. The segmental
percent fat can be also measured by the BI systems, which were recently developed with acceptable
accuracy (Pietrobelli et al., 2004; Sakamoto et al., 2000; Bedogni et al., 2002). Although further
study will be required to confirm whether segmental percent fat values measured by a BI device can
be used as an acceptable alternative to DXA measurements, this study provides strong evidence of the possibility that VFA
L4-5can be estimated by several variables measurable in a field setting.
Finally, since this study used Japanese adults only, the generalization of the prediction equations obtained in this study is limited to the Japanese population. Further examinations considering other populations will be required.
5
10
15
20
25
Conclusion
We examined an equation for predicting VFA
L4-5from anthropometric and segmental body composition variables that can be measured in a field setting. The prediction equation obtained explained 81% of the variance of VFA
L4-5measured by CT, while the SEE value (17.5 cm
2) was small. There was no systematic error in the predicted values. Cross-validation of the prediction equation was also confirmed. This study provides strong evidence of the possibility that VFA
L4-5can be estimated by several variables that can be measured in a field setting.
References
Armellini F, Zamboni M, Robbi R, Todesco T, Rigo L, Bergamo-Andreis IA, Bosello O. (1993) Total and intra-abdominal fat measurements by ultrasound and computed tomography.
International Journal of Obesity 17: 209-214.
Armellini F, Zamboni M, Harris T, Micciolo R, Bosello O. (1997) Sagittal diameter minus subcutaneous thickness. An easy-to-obtain parameter that improves visceral fat prediction.
Obesity Research 5: 315-320.
Bedogni, G., Malavolti, M., Severi, S., Poli, M., Mussi, C., Fantuzzi, A. L. & Battistini, N. (2002).
Accuracy of an eight-point tactile-electrode impedance method in the assessment of total body water. European Journal of Clinical Nutrition, 56, 1143-1148.
Bertin, E., Marcus, C., Ruiz, J. C., Eschard, J. P. & Leutenegger, M. (200). Measurement of visceral
adipose tissue by DXA combined with anthropometry in obese humans. International Journal of Obesity, 24, 263-270.
Busetto, L., Baggio, M. B., Zurlo, F., Carraro, R., Digito, M. & Enzi, G. (1992). Assessment of abdominal fat distribution in obese patients: anthropometry versus computed tomography.
International Journal of Obesity, 16, 731-736.
5
10
15
20
25
Cha, K., Shin, S., Shon, C., Choi, S. & Wilmore, W. (1997). Evaluation of segmental bioelectrical impedance analysis (SBIA) for measuring muscle distribution. Journal of Internatinal Council for Health, Physical Educaton, Sports & Dance, ASIA, pp. 11-14.
Clasey, J. L., Bouchard, C., Teates, C. D., Riblett, J. E., Thorner, M. O., Hartman, M. L.& Weltman, A. (1999). The use of anthropometric and dual-energy x-ray absorptiometry (DXA) measures to estimate total abdominal and abdominal visceral fat in mean women. Obesity Research, 7, 256-264.
Despres, J. P., Ross, R. & Lemieux, S. (1996). Imaging Techniques Applied to the measurement of human body composition. In: A. F. Roche, S. B. Heymsfield, & T. G. Lohman (Eds.), Human body composition. (pp. 149-166). Human Kinetics.
Despres, J. P., Prud’homme, D., Pouliot, M. C., Tremblay, A. & Bouchard, C. (1991). Estimation of deep abdominal adipose tissue anthropometric measurements in men. American Journal of Clinical Nutrition, 54, 471-477.
Ferland, M. Despres, J. P., Tremblay, A., Pinault, S., Nadeau, A., Moorjani, S., Lupien, P. J., Theriaut, G. & Bouchard, C. (1989). Assessment of adipose tissue distribution by computed axial tomography in obese women: association with body density and anthropometric measurements.
British Journal of Nutrition, 61, 139-148.
Jensen, M. D., Kanaley, J. A., Reed, J. E. & Patrick, F. S. (1995). Measurement of abdominal and
visceral fat with computed tomography and dual-energy x-ray absorptiometry. American
Journal of Clinical Nutrition, 61, 274-278.
Komiya, S., Eto, C., Otoki, K., Teramoto, K., Shimizu, F. & Shimamoto, H. (2000). Gender differences in body fat of low- and high-body-mass children: relationship with body mass index.
European Journal of Applied Physiology, 82, 16-23.
Komiya, S., Muraoka, Y., Zhang, F. S. & Masuda, T. (1992). Age-related change in body fat distribution in middle-aged and elderly Japanese. Journal of Anthropology Society Nippon, 100, 161-169. (In Japanese)
5
10
15
20
25
Komiya, S. & Chiwata, T. (1986). Comparison of skinfold and body water assessment for predicting changes in body comparison. Japanese Journal of Physical Fitness and Sports Medicine, 35, 39-46. (In Japanese)
Lemieux, S., Prud’homme, D., Bouchard, C., Tremblay, A. & Depres, J. P. (1993). Sex differences in the relation of visceral adipose tissue accumulation to total body fatness. American Journal of Clinical Nutrition, 58, 463-467.
Owens, S., Litaker, M., Allison, J., Riggs, S., Ferguson, M. & Gutin, B. (1999). Prediction of visceral adipose tissue from simple anthropometric measurements in youths with obesity. Obesity Research, 7, 16-22.
Park, Y. W., Heymsfield, S. B. & Gallagher, D. (2002). Are dual-energy x-ray absorptiometry regional estimates associated with visceral adipose tissue mass? International Journal of Obesity, 26, 978-983.
Pietrobelli, A., Rubiano, F., St-Onge, M. P. & Heymsfield, S.B. (2004). New bioimpedance analysis system: improved phenotyping with whole-body analysis. European Journal of Clinical Nutrition, 58, 1479-1484.
Pouliot, M. C., Destpres, J. P., Lemieux, S., Moorjani, S., Bouchard, C., Tremblay, A., Nadeau, A. &
Lupien, P. J. (1994). Waist circumference and abdominal sagittal diameter: Best simple
anthropometric indexes of abdominal visceral adipose tissue accumulation and related
cardiovascular risk in men and women. American Journal of Cardiology, 73, 460- 468.
Ross, R., Leger, L., Morris, D., de Guise, J., Guardo, R. (1992). Quantification of adipose tissue by MRI: Relationship with anthropometric variables. Journal of Applied Physiology, 72, 787-795.
Sakamoto, Y., Miura, J., Ohomori, M., Ikeda, Y., Nishizawa, M. (2000). Clinical availability of segmental bioelectrical impedance analysis in the assessment of segmental body composition.
Journal of occupational health, 42, 252. (In Japanese) 5
10
15
20
25
Seidell, J. C., Oosterlee, A., Deurenberg, P., Hautvast, J. G. & Ruijs, J. H. (1988). Abdominal fat depots measured with computed tomography: effects of degree of obesity, sex, and age.
European Journal of Clinical Nutrition, 42, 805-815.
Sjostrom, L. & Kvist, H. (1988). Regional body fat measurements with CT-scan and evaluation of anthropometric predictions. Acta Medica Scandinavia, suppl, 723, 169-177.
Snijder, M. B., Visser, M., Dekker, J. M., Seidell, J. C., Fuerst, T., Tylavsky, F., Cauley, J., Lang, T., Nevitt, M. & Harris, T. B. (2002). The prediction of visceral fat by dual-energy x-ray absorptiometry in the elderly: a comparison with computed tomography and anthropometry.
International Journal of Obesity, 26, 984-993.
Suh, Y. S., Kim, D. H., Lee, I. K. (2002). Usefulness of lumbar AP Spine DXA for measuring the percentage of perilumbar regional fat and predicting visceral fat in obese postmenopausal women. Nutrition, 18, 84-85.
Steven-Simon, C., Thureen, P., Stamm, E., Scherzinger, A. (2001). A comparison of four techniques for measuring central adiposity in postpartum adolescents. Journal of Maternal-Fetal Medicine, 10, 209-213.
Yoshizumi, T., Nakamura, T., Yamane, M., Islam, A. H., Menju, M., Yamasaki, K., Arai, T., Kotani,
K., Funahashi, T., Yamashita, S. & Matsuzawa, Y. (1999). Abdominal fat: standardized
technique for measurement at CT. Radiology, 211, 283-286.
Table 1 Physical characteristics of the study participants
Unit Mean SD Mean SD Mean SD Mean SD
Age yr. 45.5 12.2 51.8 15.9 42.2 16.3 43.3 14.2
Height cm 171.0 6.0 155.2 8.0 170.8 7.0 157.0 5.3
Weight kg 67.7 11.4 53.3 7.7 67.8 8.3 54.1 7.2
BMI kg/m2 23.1 3.4 22.2 3.4 23.2 2.5 22.0 3.1
Sagittal diameter cm 18.7 2.1 15.6 1.6 18.3 1.7 15.4 2.3
Waist circumference cm 82.8 9.6 79.8 9.0 80.8 6.3 82.7 7.7
Hip circumference cm 92.6 6.4 89.1 5.6 93.1 4.6 89.7 6.9
Total fat area (TFA) cm2 221.4 98.7 216.4 89.1 196.8 62.8 227.8 87.8 Visceral fat area (VFA) cm2 92.3 36.2 51.6 27.5 78.5 26.5 39.4 14.9 Subcutaneous fat area (SFA) cm2 129.0 69.1 164.9 69.2 118.2 44.5 188.5 76.1
Waist hip ratio (WHR) 0.90 0.06 0.91 0.07 0.87 0.04 0.94 0.10
Subcutaneous fat Cheek mm 3.8 0.9 4.4 1.7 3.5 0.7 4.8 1.3
thickness (SFT) Chin mm 4.3 1.6 4.2 1.3 4.1 1.0 5.0 1.3
Chest1 mm 7.6 3.6 7.5 3.2 6.9 2.3 8.4 2.5
Chest2 mm 7.2 3.7 7.8 3.6 6.0 1.8 8.1 2.5
Abdomen mm 14.3 9.3 12.4 8.3 9.7 4.8 13.4 5.8
Suprailiac mm 7.6 5.7 9.0 4.3 6.0 2.3 11.5 6.5
Back1 mm 6.4 3.0 7.8 2.3 7.2 4.8 10.2 2.0
Back2 mm 5.0 1.9 6.4 2.6 6.1 5.5 7.9 2.8
Triceps mm 6.1 2.1 8.0 2.3 5.9 1.4 9.4 3.3
Subscapula mm 6.2 2.1 6.6 2.2 6.3 1.6 8.0 2.6
Knee mm 6.1 2.5 6.9 2.4 7.9 6.5 8.8 3.3
Thigh1 mm 4.6 2.0 6.6 2.4 4.6 1.3 7.4 3.0
Thigh2 mm 6.0 2.0 6.7 2.5 5.9 1.3 8.0 2.8
Calf mm 6.1 2.3 6.4 2.1 6.8 2.3 7.9 2.8
Segmental percent Left arm % 17.1 6.4 27.1 8.0 15.1 4.4 30.3 8.0
fat (%SF) Left leg % 22.6 5.8 31.0 5.7 21.3 5.1 36.4 8.6
Right arm % 17.0 6.4 26.8 7.9 14.9 4.4 30.1 8.0
Right leg % 22.5 5.8 31.0 5.7 21.3 5.1 36.4 8.6
Trunk % 29.4 9.3 32.9 9.7 25.9 7.4 35.7 8.8
Total body percent fat (%TBF) % 24.5 7.1 30.4 7.2 22.1 5.6 33.9 7.9 Variables
Original Group (n=73) Cross-validation Group (n=38) Males(n=50) Females(n=23) Males(n=25) Females(n=13)
5
5
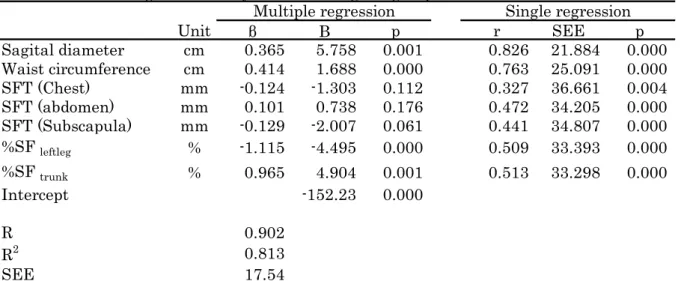
Table 2 Result of regression analyses for the original group
Unit
βB p r SEE p
Sagital diameter cm 0.365 5.758 0.001 0.826 21.884 0.000 Waist circumference cm 0.414 1.688 0.000 0.763 25.091 0.000
SFT (Chest) mm -0.124 -1.303 0.112 0.327 36.661 0.004
SFT (abdomen) mm 0.101 0.738 0.176 0.472 34.205 0.000
SFT (Subscapula) mm -0.129 -2.007 0.061 0.441 34.807 0.000
%SF
leftleg% -1.115 -4.495 0.000 0.509 33.393 0.000
%SF
trunk% 0.965 4.904 0.001 0.513 33.298 0.000
Intercept -152.23 0.000
R 0.902
R
20.813
SEE 17.54
Note. β: Standardized regression coefficient, B: regression coefficient, %SF: segmental percent fat SFT: subcutaneous fat thickness
Multiple regression Single regression
Single regression analysis was conducted for each independent variable seleced by
stepwise multiple regression analysis.
5
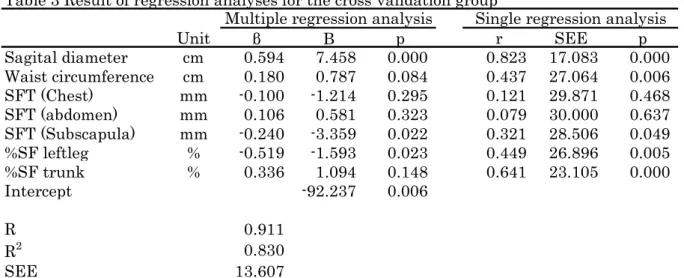
Table 3 Result of regression analyses for the cross-validation group
Unit
βB p r SEE p
Sagital diameter cm 0.594 7.458 0.000 0.823 17.083 0.000 Waist circumference cm 0.180 0.787 0.084 0.437 27.064 0.006
SFT (Chest) mm -0.100 -1.214 0.295 0.121 29.871 0.468
SFT (abdomen) mm 0.106 0.581 0.323 0.079 30.000 0.637
SFT (Subscapula) mm -0.240 -3.359 0.022 0.321 28.506 0.049
%SF leftleg % -0.519 -1.593 0.023 0.449 26.896 0.005
%SF trunk % 0.336 1.094 0.148 0.641 23.105 0.000
Intercept -92.237 0.006
R 0.911
R
20.830
SEE 13.607
Note. β: Standardized regression coefficient, B: regression coefficient, %SF: segmental percent fat SFT: subcutaneous fat thickness
Multiple regression analysis Single regression analysis
As the result of stepwise multiple regression analysis for the cross-validation group, the
selected independent variables were equal to those of the original group. Single
regression analysis was conducted for each independent variable seleced by stepwise
multiple regression analysis.
5
0 50 100 150 200
0 50 100 150 200
Observed value
Males Females cm2
cm2
Predicted value
Figure 1 Scatterplots between observed and predicted
VFA
L4-5values for the original group
5
-50 -40 -30 -20 -10 0 10 20 30 40 50
0 50 100 150 200
Mean of the observed and predicted VFAL4-5 values
Males Females Mean
Mean + 2SD
Mean - 2SD
Errors
cm2 cm2
Figure 2 Bland-Altman plots of the observed and predicted
VFA
L4-5values for the original group
5
0 50 100 150 200
0 50 100 150 200
Observed values
Predicted values
Males Females
cm
2cm
2Figure 3 Scatterplots between observed and predicted VFA
L4-5values for the original group
5
-50 -40 -30 -20 -10 0 10 20 30 40 50
0 50 100 150 200
Mean of the observed and predicted VFAL4-5 values
Error
Males Females Mean
Mean+2SD
Mean-2SD
cm2 cm2