DOI: http://dx.doi.org/10.14246/irspsd.3.3_25
Copyright@SPSD Press from 2010, SPSD Press, Kanazawa
On relations of the consciousness of garbage truck drivers and their experiences of unsafe driving behaviors
Ryosuke Ando
1*and Yasuhiro Mimura
11 Research Dept., TTRI (Toyota Transportation Research Institute)
* Corresponding Author, Email: [email protected] Received 9 May, 2014; Accepted 17 December, 2014
Key words: Traffic Safety, Garbage Collection, Community Roads, Drivers’ Personalities
Abstract: In 2011, the authors published an analytical paper in order to understand the driving behaviors of garbage trucks on the basis of the data collected by drive recorders. As further study, this paper focuses on finding significant correlations between driver consciousness and their unsafe driving experiences. The methodology includes many statistical tools such as statistical tests, analyses of variance, factor analysis, the principle component analysis, and so on. The results show that truck drivers have a lower probability of looking aside and of becoming irritated when driving the garbage trucks than private car drivers. They feel it is more difficult to drive on community roads in residential areas than on trunk roads. The statistical analyses show there were significant correlations between the drivers’
personalities, their consciousness, and the experienced traffic accidents. In particular, the event “near accident with oncoming cars when passing each other” is statistically significant with respect to the negation overtaking of the other cars, the awareness of driving on community roads and the convenience of driving the garbage trucks.
1. INTRODUCTION
Recently, in order to reduce the number of traffic accidents in residential areas, limitations for vehicle thoroughfares and access into certain areas have been considered as effective measures. To approach these goals, tools such as raised bollards and speed restrictive zoning such as Zone 30 or Zone 20 have been introduced in many countries around the world. However, some special vehicles such as ambulances, garbage trucks and the other emergency and utility vehicles cannot be limited because of their special purposes.
In Toyota City, Japan, the study site of this research, the population is about 420,000. The total area is about 918 km
2, 4% of which is roads and 6% residential area. The total household garbage amounted to 84,566 tons in the 2008 fiscal year, that being from April 2008 through March 2009 (Waste Reduction Promotion Division, 2009). 72 garbage trucks were used for the collections of the household garbage in April 2009. Usually, two workers are paired for the collection of the garbage. Each garbage truck may have five or six round trips every day between the garbage treatment facility and the residential areas.
25
To review the existing studies, Matsuto et al. (1987) tried to model
‘station-type’ collection in order to search for the best collection routes.
Two groups of researchers (Aoshima et al., 1987 and Matsunaka et al., 2006) discussed how to locate the waste treatment facilities by considering the collection routes and transportation plans. Recently, the authors published a paper (Ando and Mimura, 2011) on such an analysis having tried to understand the driving behaviors of the garbage trucks on the basis of the data collected by the drive recorders. However, there is little study regarding the issue of garbage collection transportation safety.
On the basis of the above background, this study aims to identify the relationship between driver consciousness and unsafe driving experiences.
For this study, the viewpoint regarding driver consciousness is hinted at by studies conducted by the Japan Safe Driving Center (1995, 1996, and 1997).
They have made it known that driver safety is normally related todriver’
consciousness. However, the correlations with drivers’ unsafe driving experiences have not been studied. Considering the limited number of unsafe driving experiences had by a limited number of drivers, additional factors are combined and considered. By referring to the psychological studies on environment issues (Kanno et al., 1998, and Oishi et al., 2003) the Semantic Differential (SD) method is used in this study.
A questionnaire survey was conducted in February 2011 in Toyota City, Japan. 96 drivers and assistants for the collection of household garbage, whose trucks can be specified, have been chosen as the target people. The survey sheets were distributed at seminars organized by the administration office and collected several days later. As a result, 64 effective responses have been collected. Therefore the response rate is 67%. Among the respondents, 39 individuals were truck drivers. In the survey, the drivers’
personalities, consciousness of their driving, the road and work environment, and the vehicle and safety are all considered. The analysis considers discernible reasons for traffic accidents and the approach considers the following three viewpoints: vehicle, environment and driver.
2. OUTLINE OF THE SURVEY RESULTS
The items and the indicators include everyday driving behavior, with respect to both truck driving and private car driving, the amount of house garbage to be collected, consciousness in the road traffic environment, the work environment, evaluation of the truck, the individuals and so forth.
Figure 1, on the following page, summarizes the results of the driving behaviors. A Wilcoxon signed-rank test shows that driving behaviors 6 and 9 are significantly different at the 5% level between driving the private car and the garbage truck. The drivers have higher probabilities of looking aside and becoming irritated when driving their private cars.
Figure 2, below, shows the considerations of the drivers when they are
driving their private cars and the garbage trucks. A Wilcoxon signed-rank
test shows that considerations 1, 7 and 10 are significantly different at the
5% level between the driving of private cars and the garbage trucks. Due to
the occurrence of considerations 7 and 10, the drivers noted that they feel
calmer when driving the garbage trucks. At the same time however, they do
not feel calmer if driving the garbage truck, even when employing the same
considerations.
Note: Driving behavior 1=Not keeping enough safe distance between the car just ahead in order to prevent the interruption of another car, 2=Parking at a no-parking area, 3=Not stopping even where there is a stop sign, 4=Assuming it is safe to turn left or right just by following the car ahead, 5=Not feeling nervous when changing lane because of the assumption other cars will give way, 6=Looking aside sometimes during driving, 7=Being careless sometimes even during driving, 8=Being calm always when driving, 9=Being irritated always during driving.
Point 2=Exactly, 1=Yes, -1=No, -2=Never.
※significant at the 5% level with Wilcoxon signed-rank test.
Figure 1. Normal driving behavior.
Note: Consideration 1=Enjoying driving even with no intended destination, 2=All drivers are in the same boat in the sense that driving may be bothersome, 3=A car is only a transport tool, 4=A traffic accident is a result of luck, 5=Driving is purposeful in life, 6=Danger cannot be avoided if driving, 7=Feeling unhappy when overtaken by someone, 8=Considering pedestrians/bicycles is a nuisance, 9=Tending to go fast when driving parallel with someone, 10=Getting angry with the car just ahead if it is slowing down, 11=There is a correlation between the violation of traffic regulations and traffic accidents, 12=Near misses always happen to all drivers, 13=Not dangerous when driving at a speed that is about 10km/h over the limitation.
Point 2= Agree, 1=Somewhat agree, -1=Somewhat disagree, -2=Disagree.
※significant at the 5% level with Wilcoxon signed-rank test.
Figure 2. Considerations on driving.
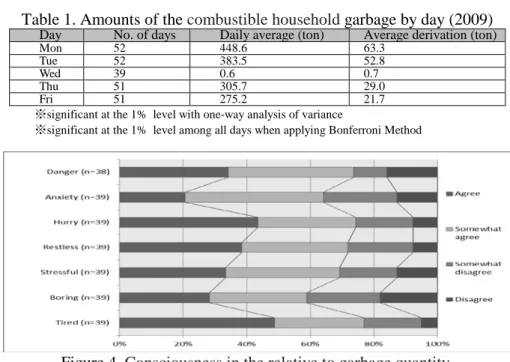
Figure 3 tells us what the drivers think about the quantities of the combustible garbage from the houses. The quantities on Mondays and Tuesdays have been felt to be more than on the other days. This is almost consistent with what was summarized in Table 1. An important result to note is what is shown in Figure 4. That is, the drivers feel more tired and hurried when transporting the larger quantities of garbage, which may be a cause of drivers being restless, dangerous and stressed.
Figure 3. Feelings on amounts of household garbage by day.
Table 1. Amounts of the combustible household garbage by day (2009)
Day No. of days Daily average (ton) Average derivation (ton)
Mon 52 448.6 63.3
Tue 52 383.5 52.8
Wed 39 0.6 0.7
Thu 51 305.7 29.0
Fri 51 275.2 21.7
※significant at the 1% level with one-way analysis of variance
※significant at the 1% level among all days when applying Bonferroni Method
Figure 4. Consciousness in the relative to garbage quantity.
Figure 5, where the points are defined the same as in Figure 2, compares the consciousness of the drivers on both trunk and community roads. A Wilcoxon signed-rank test shows that all items are significantly different at the 1% level between the trunk roads and the community roads.
That is, the drivers feel driving difficultly and anxiety on the community roads is higher than on the trunk roads.
Figure 5. Consciousness on both trunk road and community road.
Figure 6. Consciousness regarding garbage collection work.
Regarding the consciousness during their work, Figure 6 tells us that the drivers do not expect to work overtime, and feel tired or dangerous, however, most of them do not feel they have to work long hours, nor do they become bored or stressed. As for the garbage trucks, the vehicles have been evaluated as being useful, powerful and easily driven, as shown in Figure 7.
On the other hand, the trucks have not been thought to be quiet, fast or new.
Figure 7. Consciousness of garbage trucks.
3. ANALYSIS OF FACTORS RELATED TO UNSAFE EXPERIENCES
In this section, the analysis is carried out among factors such as the personality of the drivers and their consciousness on the road environment and the vehicle, along with their unsafe experiences in the past. The methodology includes many statistical tools such as factor analysis, principle component analysis and so on.
Table 2. Factor (F) loading in case of driving private cars
Variable F 1 F 2 F 3 F 4 F 5 F 6 F 7
B 1 0.15 0.11 0.07 0.30 0.07 0.62 0.15
B 2 0.05 0.36 0.26 0.67 0.24 0.20 0.17
B 3 0.08 -0.02 0.13 0.67 -0.03 0.20 0.27
B 4 0.02 0.50 0.22 0.18 0.11 0.20 -0.06
B 5 0.07 0.21 0.01 0.57 0.04 0.13 0.39
B 6 0.25 0.20 0.18 -0.02 0.94 0.19 0.09
B 7 0.37 0.13 0.22 -0.02 0.80 0.35 0.40
B 8 -0.69 -0.15 -0.28 -0.07 -0.18 -0.06 0.07
B 9 0.68 0.20 0.27 0.08 0.36 0.34 0.13
C 1 -0.05 0.72 0.04 0.04 0.37 0.12 0.19
C 2 0.28 0.28 0.92 0.25 0.24 0.20 0.37
C 3 -0.07 -0.68 0.45 -0.04 0.14 -0.02 0.18
C 4 0.04 0.09 0.34 0.25 0.22 0.33 0.92
C 5 0.16 0.69 0.01 0.28 0.13 0.17 0.20
C 6 -0.01 -0.16 0.53 -0.64 0.32 -0.11 0.08
C 7 0.24 0.20 0.10 0.21 0.18 0.29 0.44
C 8 0.69 -0.06 0.26 -0.17 0.24 0.12 0.39
C 9 -0.07 0.40 0.15 0.02 0.58 0.79 0.35
C 10 0.81 0.01 0.05 0.14 0.17 -0.01 0.11
C 11 0.03 0.10 0.25 0.34 0.09 0.37 0.54
C 12 0.19 -0.22 0.69 -0.03 0.07 0.15 0.19
C 13 0.11 0.09 0.27 0.08 0.28 0.86 0.49
Eigenvalue 4.99 2.86 2.37 1.96 1.59 1.30 1.20
Contribution
(%) 22.68 13.02 10.78 8.90 7.23 5.89 5.44
※Definition of Behavior (B) 1~9 and Consideration (C) 1~13 are the same as used in Figures 1 and 2.
※Figures in the greyed cells mean the absolute value of the factor loading is 0.5 or greater.
At first, regarding the personalities of the drivers, an analysis has been
made (Ando and Mimura, 2011) by referring to the research reports
published by the Japan Safe Driving Center (1995, 1996 and 1997). In order
to express the distances across the answer categories, the ordinal scale has
been converted to an interval scale by applying the Sigma Level. The factor
analysis using the interval scale is then implemented. The factors showing an eigenvalue of 1.0 or greater are estimated in terms of Iterative Principal Axis Factoring.
The results when driving private cars are summarized in Table 2, above. Seven factors have been selected. The accumulated contribution is 73.94%. To easily define the factors, an oblique rotation (Promax Rotation) was applied. Thus the seven factors can be defined by referring to the output of the Japan Safe Driving Center’s research as follows:
Factor 1: aggressive
Factor 2: value appreciation for driving Factor 3: accept danger
Factor 4: accept violation
Factor 5: random rambling, look aside Factor 6: go ahead of the other cars Factor 7: deprecate the accidents
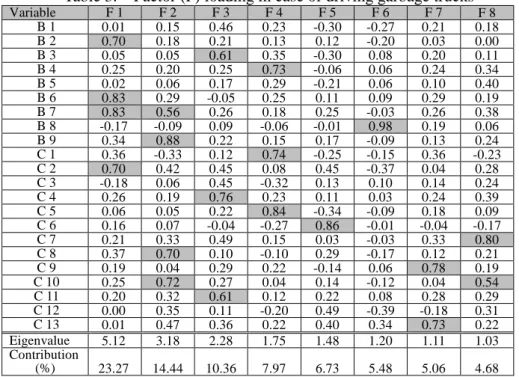
In addition, the results when driving garbage trucks are summarized in Table 3. Eight factors have been selected and their accumulated contribution is 77.99%. As with the private cars, the oblique rotation was applied, thus the eight factors can be defined as the following:
Factor 1: random rambling, look aside Factor 2: aggressive
Factor 3: deprecate the accidents Factor 4: value appreciation for driving Factor 5: accept danger
Factor 6: calm driving
Factor 7: go ahead of the other cars
Factor 8: negation being led by the other cars
Table 3. Factor (F) loading in case of driving garbage trucks
Variable F 1 F 2 F 3 F 4 F 5 F 6 F 7 F 8
B 1 0.01 0.15 0.46 0.23 -0.30 -0.27 0.21 0.18
B 2 0.70 0.18 0.21 0.13 0.12 -0.20 0.03 0.00
B 3 0.05 0.05 0.61 0.35 -0.30 0.08 0.20 0.11
B 4 0.25 0.20 0.25 0.73 -0.06 0.06 0.24 0.34
B 5 0.02 0.06 0.17 0.29 -0.21 0.06 0.10 0.40
B 6 0.83 0.29 -0.05 0.25 0.11 0.09 0.29 0.19
B 7 0.83 0.56 0.26 0.18 0.25 -0.03 0.26 0.38
B 8 -0.17 -0.09 0.09 -0.06 -0.01 0.98 0.19 0.06
B 9 0.34 0.88 0.22 0.15 0.17 -0.09 0.13 0.24
C 1 0.36 -0.33 0.12 0.74 -0.25 -0.15 0.36 -0.23
C 2 0.70 0.42 0.45 0.08 0.45 -0.37 0.04 0.28
C 3 -0.18 0.06 0.45 -0.32 0.13 0.10 0.14 0.24
C 4 0.26 0.19 0.76 0.23 0.11 0.03 0.24 0.39
C 5 0.06 0.05 0.22 0.84 -0.34 -0.09 0.18 0.09
C 6 0.16 0.07 -0.04 -0.27 0.86 -0.01 -0.04 -0.17
C 7 0.21 0.33 0.49 0.15 0.03 -0.03 0.33 0.80
C 8 0.37 0.70 0.10 -0.10 0.29 -0.17 0.12 0.21
C 9 0.19 0.04 0.29 0.22 -0.14 0.06 0.78 0.19
C 10 0.25 0.72 0.27 0.04 0.14 -0.12 0.04 0.54
C 11 0.20 0.32 0.61 0.12 0.22 0.08 0.28 0.29
C 12 0.00 0.35 0.11 -0.20 0.49 -0.39 -0.18 0.31
C 13 0.01 0.47 0.36 0.22 0.40 0.34 0.73 0.22
Eigenvalue 5.12 3.18 2.28 1.75 1.48 1.20 1.11 1.03 Contribution
(%) 23.27 14.44 10.36 7.97 6.73 5.48 5.06 4.68
※Definition of Behavior (B) 1~9 and Consideration (C) 1~13 are the same as t used in Figures 1 and 2.
※Figures in the greyed cells mean the absolute value of the factor loading is 0.5 or greater.
Regarding the garbage quantity, the roads and the work environments, a principal factor analysis has been similarly conducted.
The result for the community roads, as shown in Table 4, considers the
consciousness variables. The factors with eigenvalues 1.0 or greater are the
first and the second. The accumulated contribution of these two factors is 72.24%. The first factor mainly expresses the feeling when driving. The second factor represents the understanding of the pedestrian and vehicle traffic.
Table 4. Principal component analysis of consciousness on community roads
Variable
Principal Component
1 Principal Component 2
Driving difficultly 0.82 0.19
Feel danger 0.81 0.27
Feel anxiety 0.69 0.56
Few pedestrians -0.56 0.78
Few car traffic -0.50 0.80
Feel discomfort 0.53 0.12
Eigenvalue 2.66 1.68
Contribution percentage (%) 44.28 27.97
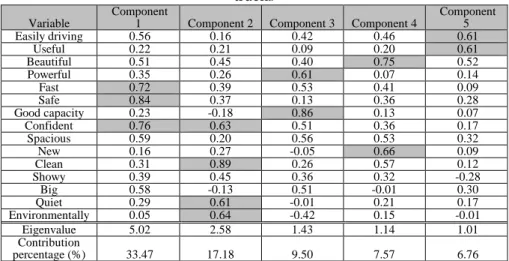
For the vehicles, in order to express the distances across the answer categories, the ordinal scale has been converted to an interval scale by applying the Sigma Level. The factor analysis using the interval scale is then implemented. The factors with an eigenvalue 1.0 or greater are obtained.
Table 5 shows the resulting five factors. The accumulated contribution is 74.49%. The oblique rotation allows the naming of the five factors as follows:
Factor 1: safety and anxiety Factor 2: clean
Factor 3: functional Factor 4: appearance Factor 5: convenient
Table 5. Principal component analysis of consciousness of the garbage trucks
Variable
Component
1 Component 2 Component 3 Component 4
Component 5
Easily driving 0.56 0.16 0.42 0.46 0.61
Useful 0.22 0.21 0.09 0.20 0.61
Beautiful 0.51 0.45 0.40 0.75 0.52
Powerful 0.35 0.26 0.61 0.07 0.14
Fast 0.72 0.39 0.53 0.41 0.09
Safe 0.84 0.37 0.13 0.36 0.28
Good capacity 0.23 -0.18 0.86 0.13 0.07
Confident 0.76 0.63 0.51 0.36 0.17
Spacious 0.59 0.20 0.56 0.53 0.32
New 0.16 0.27 -0.05 0.66 0.09
Clean 0.31 0.89 0.26 0.57 0.12
Showy 0.39 0.45 0.36 0.32 -0.28
Big 0.58 -0.13 0.51 -0.01 0.30
Quiet 0.29 0.61 -0.01 0.21 0.17
Environmentally 0.05 0.64 -0.42 0.15 -0.01
Eigenvalue 5.02 2.58 1.43 1.14 1.01
Contribution
percentage (%) 33.47 17.18 9.50 7.57 6.76
※Figures in the greyed cells mean the absolute value of the factor loading is 0.6 or greater.
The experiences of the previous three years have been scored as 0 or 1.
Regarding the near miss experiences, the 15 types (refer to Table 9), listed
by referring to existing research outputs (Ando and Mimura, 2011), have
been shown and the results in the most recent year were scored as 0, 1, 2
(having occurred 2 or 3 times), or 3 (having occurred 4 or more times),
respective with each type. The total scores of each respondent have then
been summed up. Finally, the correlations among the summed scores, the
drivers’ personalities, the consciousness of the environment and vehicles are
discussed in terms of the factor analysis.
Table 6 shows the results of the correlation analysis between the personalities and the unsafe experiences. The Mann-Whitney U Test shows that the negation overtaking of other cars is significant with the experience of near miss at the 1% level of significance.
Table 6. Correlations among drivers’ personalities and their unsafe driving experiences
Experiences of traffic
accidents Experiences of near misses
More Less P Value More Less P Value
Aimless・looking
aside when driving 0.06 (18) 0.26 (19) 0.091 5.22 (18) 3.28 (18) 0.565 Aggressive 0.05 (19) 0.28 (18) 0.067 5.72 (18) 2.78 (18) 0.100 Ignoring of
experienced
accidents 0.17 (18) 0.16 (19) 0.943 3.94 (17) 4.53 (19) 0.576 Emphasizing the
enjoyment of
driving a car 0.06 (18) 0.26 (19) 0.091 3.78 (18) 4.72 (18) 0.886 Approval for
dangerous behavior 0.16 (19) 0.11 (18) 0.682 3.28 (18) 5.22 (18) 0.643 Calm driving 0.17 (18) 0.11 (19) 0.590 2.88 (17) 5.47 (19) 0.096
Tendency to
overtake 0.11 (18) 0.16 (19) 0.682 3.39 (18) 5.11 (18) 0.565 Negation overtaking
of other cars 0.11 (19) 0.17 (18) 0.590 6.26 (19) 2.00 (17) 0.002**
Approval for violation of traffic
regulations 0.11 (18) 0.16 (19) 0.682 4.00 (18) 4.50 (18) 0.380
※( )=Sample number
※** :1% significance when doing the Mann-Whitney U Test
Table 7 show the results of the correlation tests with respect to the consciousness on community roads and unsafe experiences. The awareness of driving on the community roads shows a 5% significant difference between the ‘more’ and the ‘less’ experiences of near misses when the Mann-Whitney U Test is applied. The drivers who perceived more safety problems when driving on the community roads had had more experiences of near misses.
Table 7. Correlations among the consciousness on community roads and the drivers’ unsafe experiences
Experiences of traffic
accidents Experiences of near miss
More Less P Value More Less P Value
Awareness of driving on
community roads 0.16 (19) 0.17 (18) 0.943 6.42 (19) 2.88 (17) 0.024*
Consciousness of less traffic flows on
community roads 0.17 (18) 0.16 (19) 0.943 4.65 (17) 4.84 (19) 0.555
※( )=Sample number
※* :5% significance when applying the Mann-Whitney U Test
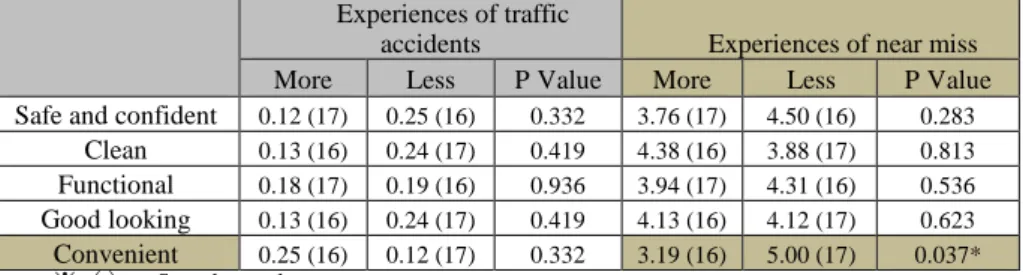
Furthermore, regarding the correlations among the consciousness of the garbage trucks and the unsafe experiences, the results are summarized in Table 8. Of the five viewpoints on the trucks, ‘convenient’ results in 5%
significance with the near miss experiences when applying the Mann-
Whitney U Test. The drivers who consider the trucks to not be convenient
tend to have more near miss experiences.
Table 8. Correlations among the consciousness on garbage trucks and the drivers’ unsafe experiences
Experiences of traffic
accidents Experiences of near miss
More Less P Value More Less P Value
Safe and confident 0.12 (17) 0.25 (16) 0.332 3.76 (17) 4.50 (16) 0.283 Clean 0.13 (16) 0.24 (17) 0.419 4.38 (16) 3.88 (17) 0.813 Functional 0.18 (17) 0.19 (16) 0.936 3.94 (17) 4.31 (16) 0.536 Good looking 0.13 (16) 0.24 (17) 0.419 4.13 (16) 4.12 (17) 0.623 Convenient 0.25 (16) 0.12 (17) 0.332 3.19 (16) 5.00 (17) 0.037*
※( )=Sample number
※* :5% significance when applying the Mann-Whitney U Test
As a summary of the above analysis, the traffic accidents experienced cannot be concluded as having statistically significant correlations with the drivers’ personalities, the consciousness on the community roads and the garbage trucks. However, the near miss experiences have statistically significant relations with some of the drivers’ personalities, the consciousness on the community roads and the garbage trucks.
On the basis of these results, further discussion is conducted on the correlations of the near miss experiences in more detail and the items selected that are statistically significant are presented in Table 6 through Table 8.
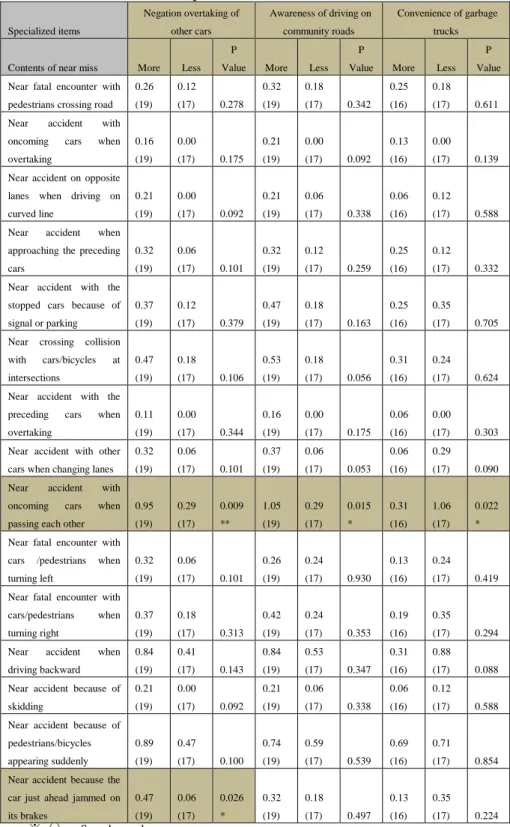
Table 9, below, is the summary of the results when applying the Mann- Whitney U Test. The item “near accident with oncoming cars when passing each other” is statistically significant with respective to the negation overtaking of the other cars at the 1% level of significance and the awareness of driving on the community roads and the convenience of the garbage trucks at the 5% level. This item is the most representative near miss event, having correlations with specific behaviors. Another statistically significant near miss event is the item “near accident because the car just ahead jammed on its brakes”. This is correlated with the negation overtaking of the other cars at the 5% level.
4. CONCLUSIONS
In the process of promoting the measure of Zone 30 in Japan, one serious
issue is how to deal with the garbage trucks, because it is impossible to limit
these trucks from accessing the community roads. To discuss this issue
concretely, this study was undertaken to understand the driving behaviors of
truck drivers. On the basis of a questionnaire conducted in Toyota City, a
statistical analysis has been carried out. The results show that truck drivers
have a lower probability of look aside and being irritated when driving the
garbage trucks than the private car drivers. They feel it is more difficult to
drive on the community roads in the residential areas than on the trunk
roads. Furthermore, the statistical analyses showed there are many
correlations among the drivers’ behaviors, their consciousness of the
environments and the vehicles, and the experienced traffic accidents and
near misses, and so forth. In particular, the event “near accident with
oncoming cars when passing each other” is statistically significant with
respect to the negation overtaking of other cars, the awareness of driving on
the community roads and the convenience of the garbage trucks.
Although further studies should be extended to more cities, the results in this study have given many hints for discussing the traffic safety measures on community roads.
Table 9. Concrete description of experienced near-misses in terms of personal behaviors
Specialized items
Negation overtaking of other cars
Awareness of driving on community roads
Convenience of garbage trucks
Contents of near miss More Less P
Value More Less P
Value More Less P Value Near fatal encounter with
pedestrians crossing road 0.26 (19)
0.12 (17) 0.278
0.32 (19)
0.18 (17) 0.342
0.25 (16)
0.18 (17) 0.611 Near accident with
oncoming cars when overtaking
0.16 (19)
0.00 (17) 0.175
0.21 (19)
0.00 (17) 0.092
0.13 (16)
0.00 (17) 0.139 Near accident on opposite
lanes when driving on curved line
0.21 (19)
0.00 (17) 0.092
0.21 (19)
0.06 (17) 0.338
0.06 (16)
0.12 (17) 0.588 Near accident when
approaching the preceding cars
0.32 (19)
0.06 (17) 0.101
0.32 (19)
0.12 (17) 0.259
0.25 (16)
0.12 (17) 0.332 Near accident with the
stopped cars because of signal or parking
0.37 (19)
0.12 (17) 0.379
0.47 (19)
0.18 (17) 0.163
0.25 (16)
0.35 (17) 0.705 Near crossing collision
with cars/bicycles at intersections
0.47 (19)
0.18 (17) 0.106
0.53 (19)
0.18 (17) 0.056
0.31 (16)
0.24 (17) 0.624 Near accident with the
preceding cars when overtaking
0.11 (19)
0.00 (17) 0.344
0.16 (19)
0.00 (17) 0.175
0.06 (16)
0.00 (17) 0.303 Near accident with other
cars when changing lanes 0.32 (19)
0.06 (17) 0.101
0.37 (19)
0.06 (17) 0.053
0.06 (16)
0.29 (17) 0.090 Near accident with
oncoming cars when passing each other
0.95 (19)
0.29 (17)
0.009
**
1.05 (19)
0.29 (17)
0.015
*
0.31 (16)
1.06 (17)
0.022
* Near fatal encounter with
cars /pedestrians when turning left
0.32 (19)
0.06 (17) 0.101
0.26 (19)
0.24 (17) 0.930
0.13 (16)
0.24 (17) 0.419 Near fatal encounter with
cars/pedestrians when turning right
0.37 (19)
0.18 (17) 0.313
0.42 (19)
0.24 (17) 0.353
0.19 (16)
0.35 (17) 0.294 Near accident when
driving backward
0.84 (19)
0.41 (17) 0.143
0.84 (19)
0.53 (17) 0.347
0.31 (16)
0.88 (17) 0.088 Near accident because of
skidding
0.21 (19)
0.00 (17) 0.092
0.21 (19)
0.06 (17) 0.338
0.06 (16)
0.12 (17) 0.588 Near accident because of
pedestrians/bicycles appearing suddenly
0.89 (19)
0.47 (17) 0.100
0.74 (19)
0.59 (17) 0.539
0.69 (16)
0.71 (17) 0.854 Near accident because the
car just ahead jammed on its brakes
0.47 (19)
0.06 (17)
0.026
*
0.32 (19)
0.18 (17) 0.497
0.13 (16)
0.35 (17) 0.224
※()=Sample number
※** :1% significance when applying the Mann-Whitney U Test; * :5% significance when applying the Mann-Whitney U Test.
REFERENCES
Aoshima, N., Kitao, T., Katada, T. and Kusano, K. (1987). “Study on relation between efficient municipal solid waste collection transportation system and the environmental impact”,Proceedings of Symposium on Environmental Problems of JSCE,15,1-6.
Ando, R. and Mimura, Y. (2011). “An analysis on traffic safety using drive recorder”, in:
Zhao Yang (eds.), Proceedings of 2011 International Conference on Technological Advancements in Civil Engineering (ICTACE 2011), Chennai, India, IEEE, Piscataway, 1- 5.
Japan Safe Driving Center. (1995). Research reports on the relations between the drivers’
consciousness and their near-miss experiences 1, Tokyo.
Japan Safe Driving Center. (1996). Research reports on the relations between the drivers’
consciousness and their near-miss experiences 2, Tokyo.
Japan Safe Driving Center. (1997). Research reports on the relations between the drivers’
consciousness and their near-miss experiences 3, Tokyo.
Kanno, T., Fukuyama, M., Oku, T., Sasaki, H. and Nagamachi, M. (1998). “A study of images and amenity of grassland landscape using SD method”, Grassland Science,44(2),
127-137.
Matsunaka, R., Taniguchi, M. and Itagaki, D. (2006). “A study on the optimal plans of collecting and transporting combustible waste considering locations of disposal facilities”,Infrastructure Planning Review of JSCE,23,147-153.
Matsuto, T., Koyama, K. and Tanaka, N. (1987). “Study on modelling procedure of station- type-collection of municipal solid waste”,Journal of JSCE,377( IV-6), 61-69.
Oishi, Y., Kanehama, S., Hiyane, A. and Taguchi, H. (2003). “Comparison of forest image and mood: psychological examination in a forest environment using profile of mood states and semantic differential method”, J. Jpn. For. Soc.,85(1),70-77.
Waste Reduction Promotion Division. (2009). 2009 Waste collection in Toyota City. Toyota City.