About Governance Structures?
The Journal of Social Science 56 [2005]
pp. 5-27
I. Introduction
Corporate financial scandals have left investors worried, wondering if corporations around the world have misused their hard earned money. There were calls for a better system of corporate governance to prevent corporations from misusing shareholder funds through questionable practices. Corporations in Asia were accused of committing gross excesses in their borrowing and investments, fueling speculative real estate bubbles. In some cases, large controlling shareholders were alleged to have siphoned corporate wealth to the detriment of the corporation, minority shareholders and creditors.
(1)Governments around the world reacted to these financial scandals to reassure investors that there would be improvements in the way corporations are managed and regulated.
(2)In a bid to assuage investor’s fears, a plethora of codes of best governance practices and laws were introduced, aimed at improving transparency and accountability, along with stricter enforcement of rules.
Malaysia too, introduced a code on corporate governance, established a minority shareholder watchdog group and mandated continuing education program for board directors.
1. Research motivation
This paper is written against a background of corporate collapse and regional financial turmoil in 1997 and the measures taken to strengthen corporate governance structures. It explores two key elements: The ownership
What Corporate Ownership Tells Us About Governance Structures?
Sundaran Annamalai *
About Governance Structures?
structure and corporate governance mechanisms, in particular internal corporate governance mechanisms. Investigating the link between them is premised on the possibility that internal governance mechanism will be arranged in response to regulatory requirements but without weakening the position of the controlling shareholders in decision making in the company. Accordingly the question that helps to shape and focus the discussion is “How do ownership characteristics affect internal corporate governance mechanisms?”
2. Research framework
The research framework is largely based on the Agency Theory. In large listed firms, ownership is dispersed and managers effectively control the firm. These dispersed shareholders who are de jure owners of the corporation generally do not monitor the performance of the managers because of the free- rider problem, a situation that arises because each individual shareholder holds such a small share of the corporation that he would not invest the time and money to monitor management decisions. Managers become the agents of these widely dispersed owners (principals).
Managers as agents have de facto control with respect to decisions regarding the use of corporate assets and the strategic direction of the corporation. With this control, Managers (agents) are more likely to make decisions that serve management interest rather than that of the owners (principals). The self-serving behavior of the manager is the Agency Cost that is borne by all shareholders.
The problems arising from this separation, and the mechanisms to address these problems are the essence of most discussions on corporate governance.
Berle and Means, in their influential work, discuss the separation between ownership and control as “the owners without appreciable control and control without appreciable ownership”.
(3)With dispersed ownership, the managers’
control of the firm became entrenched. Jensen and Meckling formalized the
concept as a problem that arises between an agent (manager) and the principal
(shareholders).
(4)Adam Smith, much earlier highlighted the problem of entrusting
one’s money to another when he wrote that managers of other peoples money
About Governance Structures?
cannot be expected to watch over it with the same anxious vigilance, one would expect from owners and that “negligence and profusion, therefore must always prevail, more or less, in the management of the affairs of such a company.”
(5)Despite Berle and Means’ description of a dispersed shareholders in modern corporations, ,La Porta et al documented the shareholding in 27 richest countries and found that 64 percent of large firms have controlling shareholders.
(6)In East Asia, 75% of the listed companies have owners controlling 50% or more of the shares.
(7)A study of the top 100 companies in Malaysia during the period 1974-1977 showed that the top 5 per cent of shareholders owned 63.03 percent of shares and the top 10 percent held 75.73 percent of the shares.
(8)Recent studies, indicate that pyramidal structure of ownership remains common.
(9)This pattern of concentrated corporate ownership is still evident. A World Bank study found family control in 67 per cent of listed Malaysian companies. Large controlling shareholder raises corporate governance issues.
(10)The preponderance of majority-controlled firms may be due to a number of factors. There is a strong need to maintain control of a firm within a family.
Even though a firm expands in size and operation, and the family seeks external equity, control is still exercised through nominee and pyramidal structures. With substantial ownership stakes, large owners have the incentive and ability to monitor managers.
(11)Concentrated ownership is not without risk. The investment is un-diversified and subject to non-systemic risk. There is a tradeoff in the private benefits of control and the risk of having un-diversified shareholding. The existence of the widespread use of pyramid structures to maintain control and other evidence suggest that the benefits of concentrated holding may exceed the cost.
In Malaysia, the rise of state and state-linked corporate ownership can be traced to the imbalanced in ownership patterns prior to 1970, where ownership patterns were concentrated and skewed towards foreigners and ethnic Chinese.
Whereas, corporate ownership by the majority of the population, namely
the Malays and other indigenous peoples, henceforth collectively referred
About Governance Structures?
to as Bumiputra amounted to only about 1.5 percent.
(12)As a result, the New Economic Policy (NEP) was formulated in 1970 to provide a framework for development planning, specifically to address social and economic disparities in the country and increase Bumiputra participation in the economy. As a result, the involvement of state and state-linked organization in commerce is extensive both in terms reach and magnitude. For example as of end of 2001, government linked institutions as a group own about 37% of the shares in listed companies.
(13)Companies controlled by the state-linked institutions are some of the largest in terms of capitalization in the KLSE.
Thus, ownership patterns point towards concentrated ownership by family groups and also a strong presence of state and state-linked ownership in Malaysia. In these circumstances, large owners have significant influence on management or even may be part of management, so that the classical separation of owners and management is blurred. From an agency perspective, would large shareholders with strong influence on management make decisions in the best interest of all shareholders? With the presence of large shareholders, corporate governance is then concerned with protecting the interest of minority shareholders against managers and controlling owners/shareholders.
Given these differences, we explore the relationship between ownership and board characteristics (corporate governance) in a sample of companies listed on the Malaysian stock exchange. Board characteristics are internally determined in the company and the choice reflects the wishes of the management/controlling shareholders. These choices of governance attributes are likely to further the interest of management/controlling shareholders rather than diluting it. The influence of management/controlling shareholders has major implications on corporate governance practice in the firm.
3. Study significance and rational
Macro-level studies have investigated legal protections accorded to
investors and how they have affected the development of capital markets around
the world.
(14)Many other studies have linked corporate governance structures
About Governance Structures?
and board composition with company performance.
(15) , (16)Countries with better corporate governance standards have better developed capital markets.
(17)At the firm level, strategy-consulting firm McKinsey & Co. found that investors are willing to pay a premium of up to 30% for firms with good corporate governance.
(18)Given the significant concentrated shareholdings by families and the state in Malaysia, it is likely that the governance structures in such companies would ensure that the influence of these major shareholders are not compromised.
This study is an attempt to contribute to research on the relationship between ownership characteristics and corporate governance structures in Malaysia. The rich interplay of ownership and governance structures in the context of concentrated ownership, government-linked and foreign ownership adds to the literature that examines ownership and governance structures. In addition, it also provides insights that could help policy makers and regulators to enhance governance mechanisms and understand the dynamics of ownership characteristics.
II. Research Hypothesis, Model and Methodology
The research model encompasses two major elements: ownership and corporate governance. The relationship between these two elements is the focus of the study.
Large owners by virtue of their voting power are represented in the Board
of Directors (BOD). With Board positions, they can influence business strategies
and company operations. When large owners are also founding owners or
members of founding families, they may also constitute part of the management
team. Thus, the influence of large owners goes far beyond mere ownership of
shares and has a real influence on every aspect of company management and
corporate governance. Therefore, owners with large stakes are likely to have
board structures that seek to preserve their influence. Since there are large family,
foreign and state ownership, there could be potential conflict in the objectives of
these different owners. These differences may influence in the manner internal
About Governance Structures?
corporate governance structures are arrived at in a firm.
The theoretical and conventional wisdom favored by policy makers to have independent directors and to require separating the Board chairman and the chief executive officer is tested whether in the presence of large family, foreign and state share holding makes a difference in the way Boards are structured.
The relationship between governance and ownership variables were tested with a generic regression model in the form given below.
Governance = f ( ownership, control variables, ε
i)
where ε
iis the error term and control variables are company size, age of company and industry categories.
1. Share Ownership
Ownership comes with the right to vote and hence the ability to influence company policy through the appointment of members of the Board of Directors.
Large shareholding provides the incentive for owners to use their influence to maximize value, exert control and to protect their interest in the company. It is well known that control rights attached to holding a large block of shares attract a premium. This premium is usually associated with private benefits of control, which is the ability to extract rents at the expense of other shareholders.
Concentrated shareholding as a corporate structure is considered to be a response for poor shareholder and investor protection. Where the law is weak or enforcement of investor protection is weak, the natural reaction is to seek a form of corporate structure that enables the shareholder to protect his interest.
Concentrated shareholding provides that protection.
2. Corporate Governance Structures
(a) Board Chairman and the Chief Executive Officer (CEO)
Internal corporate governance mechanisms are designed to ensure that that
there are enough checks and balances to ensure that decision-making leads to
shareholder value maximization. It includes having a separate Board chairman
and CEO and a larger fraction of independent directors and proper functioning
About Governance Structures?
of Board committees (audit, remuneration, nomination).
Combining both roles in one-person tantamounts to allowing the CEO to evaluate his own performance and undermines the oversight function of the board with the Chairman as its head. With a separate Chairman and CEO, the Board acting collectively can remove the CEO and senior management for non- performance. Combining the roles in one individual concentrates power and creates conflict of interest. The separation of the Board Chairman and the CEO reduces the possibility of self-dealing by members of the management team.
(19)With separation of the Board chairman and the CEO, it is likely that these value decreasing transactions would be more closely scrutinized to ensure that they are above-board and the interest of all shareholders is protected. Where a listed company is still managed by its founder, it is likely to find him holding the position of the executive chairman combining board and management position.
Among family controlled businesses it is also common to have the patriarch taking on Board chairmanship, while members of his family hold executive positions. Thus, while there may be nominal separation of the two positions, functionally they act as one.
Minority shareholders can, in theory, propose their own candidates.
However, free-rider problems, cost of aggregating minority votes and the ease in which majority shareholders can out vote the minority shareholders make such a move impractical. Therefore, even though shareholders have the right to elect Board members, this right is often illusory.
(20)Ineffective boards have been cited as the reason for loss of competitiveness when they fail to respond to changes in the product market, technology and organizational innovations and global competition for products and services.
(21)(b) Independent Directors
Independent directors on company Boards are believed to be an integral
component of internal control and monitoring mechanism. Independent
directors are required as members of the Audit, Remuneration, and Nomination
committees. In theory, independent directors do not represent any major
shareholder group or have any relationship with management or the company.
About Governance Structures?
Truly independent directors have the potential to play a crucial role in monitoring management performance and maintain overall Board impartiality in evaluating company strategies and performance. Conventional wisdom is that independent directors will bring about a more proactive and assertive voice to the Board. These two beliefs probably form the basis for the suggestion by many think-tanks and codes of corporate governance around the world to increase the number of independent Board members.
(c) Control Variables
Past studies have used total assets as a control variable for size. These include studies by Holderness, Kroszner and Sheehan
(22)and Agrawal and Knoeber
(23)and Booth et al.
(24)In keeping with past research, total assets as a proxy for size are used. It is also well known that companies in different industry sectors have different risk and return profiles. Most studies define industries by using various levels of industry classification numbers. Industry differences are controlled using industry categorization provided by the KLSE. In addition, the age of the company may also have an impact on the distribution of shareholding.
Older companies, having gone through many business cycles, may have a wider shareholder distribution. We use the age of incorporation as a proxy for company age rather than the year of listing.
III. Methodology
1. Measurement of Ownership
Public listed companies are required to publish an analysis of the top 30 shareholders and the share distribution in their annual reports.
(25)As a result, it is possible to have better information on the ownership structure of public listed companies. Wherever possible, direct ownership of shares by individuals is identified. This is supplemented with information on indirect ownership held through nominee companies and other corporate holdings, and trust is added to obtain the percentage share held by the five largest shareholders.
Ownership by the state is obtained by adding all shares held by government trust
agencies, federal and state government investment arms, state trust agencies and
About Governance Structures?
federal pension funds. Foreign ownership levels were obtained from Investors Digest, which publishes foreign shareholdings in all public listed companies in Malaysia.
(26)Three ownership measures were calculated. These are: the percentage held by the largest shareholder; total shares held by the largest 5 shareholders; Hirch Herfindhal Index (HHI) measure.
2. Governance Measures
Two internal governance control measures are used. They are Board independence and the separation of CEO and the Board Chairman. Independent directors are identified as such in the annual reports. Independent directors are measured as absolute numbers in the first instance and also as a ratio to the Board size. The separation of the Board Chairman and the CEO is measured as a dummy variable. If there is a separation, the variable takes the value of 1 and 0 otherwise. Where the Board chairman and the CEO are closely related, the company is coded as having a unified CEO and Board Chairman.
3. Data Collection
Two samples were assembled. The first sample was for the year 1996. This sample would reflect the relatively buoyant economy prior to the financial crisis in late 1997. The second sample was collected for the year 2001. During these intervening years, many companies were restructured, and rules and regulations in relation to corporate governance were adopted by the Kuala Lumpur Stock Exchange. The sample for 2001 would reflect the performance of the companies after restructuring and reorganization and implementation of some of the corporate governance measures.
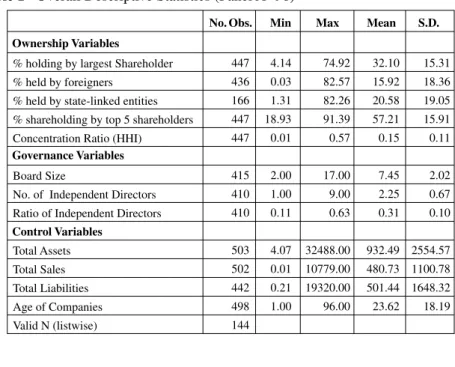
4. Descriptive Statistics
In 1996, the mean holding by the largest shareholder was 32.1 percent, mean
shareholding by foreigners 15.92 percent and state-linked shareholding was
20.26. Mean Board size was 7.45 and mean number of independent directors
was 2.35 (table 1-Panel A). In 2001, the mean shareholding by the largest
About Governance Structures?
shareholder, government and foreign shareholding was 37.57 percent, 9.86 percent and 12.67 percent respectively. Mean board size was 7.62 and the mean number of independent directors was 2.56.(table1- Panel B)
The holding by the top shareholder had significantly increased between the intervening years. This could be a result of actual increases in the holding by the top shareholder, or could also be a result of regulations introduced in 2000 requiring shareholders to reveal their direct and indirect shareholding held via holding, nominee or other means. The percentage held by the top 5 shareholders and likewise the concentration ratio also show a significant increase, probably for similar reasons. Foreign shareholding had significantly decreased during the period. The reduced holding suggests foreign shareholders may have liquidated their holdings during the crisis and had not made a significant return to the market.
(27)State-linked shareholding does not show any significant shareholding differences.
In as far as the ownership variables are concerned, it appears that financial theory correctly predicts the behaviors of various classes of shareholders.
Foreign shareholders holding relatively smaller holdings are rather flexible in their holding pattern and exit the market relatively easily. However, block holders (top shareholders) and stake-linked entities were probably not in a position to exit the market and were left holding significant holdings in a declining market.
On governance variables, Board size had reduced though not very
significantly. However, the mean number of independent directors had increased
significantly. The increase in the mean size of the number of independent
directors may be attributed to the recommendations of the Malaysian Code
of Corporate Governance, that at least one third of the directors should be
independent directors. An alternative explanation is that loss making companies
are more likely to appoint more independent directors as part of the restructuring
that was still ongoing in the year 2001. In tandem with the increase in the
number of independent directors and the reduction in board size, the ratio of
independent directors also shows a significant increase. In 1996, 30.96 % of the
About Governance Structures?
companies in the sample had separate Board Chairman and the Chief Executive Officer. This increased to 37.01% in 2001 indicating increasing adherence to the guidelines of the Malaysian Code of Corporate Governance that advocates a separation between these two positions.
IV. Empirical Findings
The separation between the Board Chairman and the CEO is a binary variable taking the value of 1 if it is split and 0 otherwise. We use a binary logistics regression model to capture the relationship between Chairman/CEO duality and performance and ownership attributes. We test the relationship between ownership and log odds that the post of the Chairman and CEO will be split using logistic regression model. The results are presented in Table2 –Panel A and B. The presentation and interpretation of relevant statistics for a binary logistics regression follows the suggestion by Brace et al.
(28)The full model using 1997 data is not reliable which suggest that the ownership types cannot adequately predict likelihood of having a split Board chairman and CEO. Consistent with the lack of model fit, the summary statistics obtained from the binary logistics regression explains a low percentage variance in the likelihood of the incidence of Chairman/CEO duality as given by the Cox and Snell and Nagelkerke R
2values (5.8 percent and 8.1 percent respectively) in (table 2- Panel A ). The regression coefficients of ownership were also not significant. In other words, knowing the ownership attributes it is not possible to say one way or another whether there will be a separation in the Board chairmanship and the CEO.
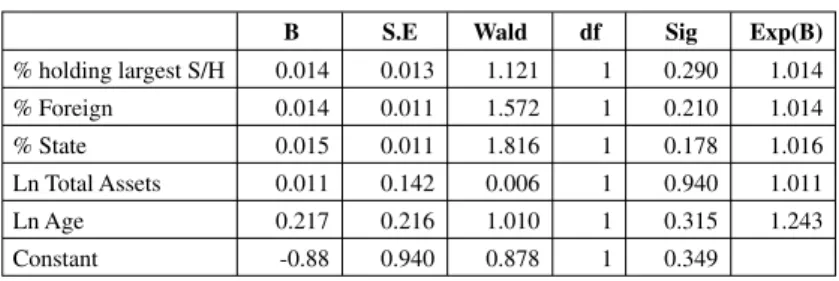
Similar binary logistics regression was performed using the data from the 2001 sample. The results are presented in table 2-Panel B. The results show that the binary logistics regression using 2001 data is again not significant (p=0.0128) and that the model explains 3.5 to 4.8 percent of the variation in the dependent variable. (Cox & Snell and Nagelkerke R
2are 0.035 and 0.048 respectively).
Though the model as a whole is not significant, the coefficient of state-linked
ownership ( β = 0.019) is significantly ( p= 0.001) associated with the likelihood
About Governance Structures?
of having Chairman/CEO separation. An increase in 1 percent by stake-linked ownership increases the odds of having duality by a factor of 1.02 given by the factor Exp (B) column. This relationship is easily explained by the fact that where government ownership is large enough to appoint Board members, it is more likely to have a separation between the Chairman and CEO.
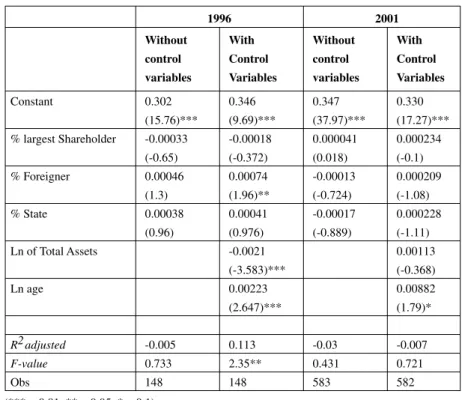
We continue to test the relationship between governance and ownership. In this series, the ratio of independent directors and Board size as the dependent variable. Table 3 and table 4 present the regression estimates. The Table 5 shows that there is no significant relationship between the ratio of independent Board directors and the ownership characteristics. All the β coefficients of ownership variables are not statistically significant. We offer a tentative explanation. At whatever level of ownership or type of ownership, the ratio of independent directors is invariant. This could be due to a standing rule of the KLSE that at least one third of the Board members should be independent. Most of the companies comply with this requirement as shown by the mean ratio of independent directors which was 0.31 in 1996 and 0.36 in 2001. As a result of this regulatory requirement it is not possible to observe significant relationship between the ratio of independent directors and ownership type. An extension of this explanation implies whoever is in control of the corporation is only interested in complying with the minimum requirements of the rules. Corporate governance rules become an exercise in ticking the correct boxes to show compliance with the rules.
The relationship between Board size and ownership was tested using OLS regression equation. The results of the regression are presented in Table 4.
The regressions estimates do not indicate any significant relationship
between ownership variables and Board size in 1996 once the control variables
are added. However, by 2001, Board size is positively related to state and foreign
ownership. Only foreign and government-linked ownership have a positive
relationship with Board size in 2001 but not in 1996. This could be due to the
poor performance of companies and hence, additional directors were appointed
to help in the recovery process. The relationship between foreign shareholding
About Governance Structures?
and government-linked shareholding with board size can also be explained by the fact that they largely invest in bigger companies. And since there is a correlation between large companies and Board size, we may be observing a relationship arising from company size. This explanation is probable because the coefficient of the size control variable is significant (t = 6.006 in 1996 and t = 5.39 in 2001).
V. Discussions
The analysis above indicate the following general relationships. The average holding by the largest shareholder was 32.1 per cent in 1996 and 37.6 per cent in 2001. Consistent with the findings of Claessens, Djankov and Lang, we found that 62 percent of the companies in our sample for 1996 and 76 percent of the companies in 2001 have controlling shareholders with over 25 per cent holdings.
(29)By 2001 there was significant increase in mean concentration measures. Probably large shareholders were unable to dispose of their holdings or picked up undervalued shares in a declining market. Foreign shareholding reduced after the crisis, indicating foreign confidence in the KLSE equity market had not recovered.
The number of independent directors increased significantly between 1997 and 2001. The proportion of Boards having separate Chairman and CEO also increased during the same period. Board size decreased during the period. It is probable that the appointment of independent directors (at minimum two or one- third of the board size) and the decision to separate the Chairman and CEO are made in compliance with rules imposed by regulators.
The data from 1997 indicates that the type of ownership shows no significant
relationship to the likelihood of having a board duality. However, by the year
2001 the coefficient of state ownership is significantly associated with the
likelihood of having board duality. This indicates that where the state’s holding
is large enough, it is more likely to have a separation between the Chairman
and CEO. It is also an indication that the state has responded positively to the
recommendations of the Malaysian Code of Corporate Governance to have a
About Governance Structures?
separate Board Chairman and CEO and also project an image of accountability that the state is committed to promote. In addition there is also some evidence that state ownership is linked with larger Board size.
It is clear that there is a higher number of independent directors and there is a tendency to separate the Board Chairman and the CEO especially in companies where there is a high level of state ownership. It could be expected in time to come compliance of these two measures will be very high. Companies are more likely to comply than to explain non-compliance in the annual report.
Regulators could derive satisfaction from a high level of compliance.
However, it will auger well for regulators to dwell into the quality and actual workings of the Board Chairman and the independent directors. The appointments of independent directors is sometimes perceived to be made to enhance company prestige by having high profile politicians and ex-bureaucrats on the Board. Since the appointments of independent directors and Board Chairman are largely internal decisions made by those who control the company, it is unlikely that the controlling shareholder makes these appointments with the expectation that they would actually act “independently.” As a result independent directors and the separation of the CEO and Board Chairman may have little influence in the operations of the company. The implication is that controlling owners strategically placed in management or the Board, drive decision-making.
Governance structures such as the separation of the Board Chairman and CEO and the presence of independent Board members, while theoretically neat and elegant, can be manipulated in the interest of the controlling shareholder.
Our tentative assertion is that in an environment where there is concentrated ownership, corporate governance is subsumed to the will of the largest owner.
Corporate governance mechanism would then be instruments that do the bidding of the controlling owners.
VI. Conclusion
What are the policy implications of these findings? It is clear that knowing
the ownership characteristics generally does not give any clue as to how the
About Governance Structures?
internal governance structures may be arranged in a company except that is some evidence that state-linked companies are more likely to have a separation between the board chairman and the CEO. Nevertheless, there is a clear trend is for companies to comply with regulatory requirements on the number of independent directors and the separation of Board Chairman and the CEO.
However, what does higher compliance mean to an average shareholder? In keeping with the mandate of corporate governance rationale, it should lead to increasing shareholder value. Therefore, these internal governance structures need to be more meaningful and not merely compliance bound box-ticking exercises.
More thought and effort should be placed on the actual workings of the Board. It has to start with an active search for Board members with the required expertise- an exercise that mirrors the search for CEOs; an incentive system that is geared towards obtaining commitment to add shareholder value; and internal procedures that allows free flow of information from and to management. It is the individual Board members working collectively with adequate oversight that can drive management towards increasing shareholder value.
* I am indebted to and thank the following for their encouragement and guidance in the course of developing the concept and research on corporate governance:
Professors Nobuya Takezawa, Kano Yamamoto, Norihiko Suzuki, Temario
Rivera and Noaya Takezawa. This paper forms part of my PhD dissertation.
About Governance Structures?
Notes
Lemmon L. Micha el and Karl V. Lins, p. 1445-1476.
In the USA, the Sarbanes-Oxely Act was passed in 2002 to improve the quality, integrity and accuracy of financial statement of the corporation.
Berle A. Adolf and Gardiner Means, p.121
Jensen. Michael & William H. Meckling, p. 305-360.
Smith, Adam , p.362.
La Porta, R. Lopez-de-Silanes, F., Shleifer, A., (1999) p.471-517.
Claessens, Stijn , Simeon Djankov and Larry Lang, (Jan, 2000) p. 6.
Lim Mah Hui, p. 29.
Gomez, T.
Claessens, Stijn, Simeon Djankov and Larry H.P Lang, (Jan, 2000).
Shleifer, Andrei and Robert W. Vishny, p. 737-783.
7
thand 8
thMalaysia Plan Documents, Prime Ministers Department Investors Digest, February 2002.
La Porta, Rafael, et al. No. 57, (2002) : p. 1147-1170.
Weir Charlie, and David Liang, p. 86-94.
Hermalin, E. Benjamin and Michael S. Weisbach, p.101-112.
La Porta, Rafael, Florencio Lopez-de-Silanes, Andrei Shleifer, ((1997) 52, p.1131-1150.
The McKinsey Quarterly.
Fama, Eugene and Michael C. Jensen, p.301-326.
Monks., A.G. Robert and Nell Minnows, p.17.
Michael C. Jensen, No. 3, p. 833.
Holderness, Clifford, Randall. S. Kroszner and Denis Sheehan, p.435-469.
Agrawal and Knoeber, p. 337-397.
Booth, James, Marcia Millon Cornet and Hassan Tehranian, p.1973-196.
Appendix 9C-05 of the Listing Requirements of the KLSE as at January 2001.
Investors Digest, January 1997 and June 2002,
During the Asian Crisis, Malaysia was removed from the Morgan Stanley Capital Index. This affected flow of foreign funds too.
Brace, Nicola, Richard Kemp and Rosemary Snelgar, p. 269-276.
Claessens, Stijn , Simeon Djankov, and Larry Lang, (Oct, 2000) p.81-112.
(1) (2)
(3)
(4)
(5)
(6)
(7)
(8)
(9)
(10)
(11)
(12)
(13)
(14)
(15)
(16)
(17)
(18)
(19)
(20)
(21)
(22)
(23)
(24)
(25)
(26)
(27)
(28)
(29)
About Governance Structures?
Table 2 Panel A (96) -Binary Logistic Regression Estimates with Chair- man/CEO Duality as Dependent Variable and Ownership as Indepen- dent Variable
Model Summary
Panel B (01)- Binary Logistics Regression Estimates with Chair- man/CEO Duality as Dependent Variable and Ownership As Indepen- dent Variable, 2001
Model Summary
% holding largest S/H
% Foreign
% State Ln Total Assets Ln Age Constant
% holding largest S/H
% Foreign
% State Ln Total Assets Ln Age Constant
% holding by largest Shareholder
% held by foreigners
% held by state-linked entities
% shareholding by top 5 shareholders Concentration Ratio (HHI)
Board Size
No. of Independent Directors Ratio of Independent Directors
Total Assets Total Sales Total Liabilities Age of Companies Valid N (listwise)
447 436 166 447 447
415 410 410
503 502 442 498 144
4.14 0.03 1.31 18.93 0.01
2.00 1.00 0.11
4.07 0.01 0.21 1.00
74.92 82.57 82.26 91.39 0.57
17.00 9.00 0.63
32488.00 10779.00 19320.00 96.00
32.10 15.92 20.58 57.21 0.15
7.45 2.25 0.31
932.49 480.73 501.44 23.62
15.31 18.36 19.05 15.91 0.11
2.02 0.67 0.10
2554.57 1100.78 1648.32 18.19
Ownership VariablesGovernance Variables
Control Variables
No. Obs. Min Max Mean S.D.
592.00 620.00 620.00 592.00 592.00
598.00 594.00 593.00
620.00 616.00 577.00 621.00 539.00
4.16 0.00 0.00 6.82 0.00
3.00 1.00 0.11
4.60 0.00 0.18 1.00
92.15 80.16 87.42 97.98 0.85
16.00 7.00 0.67
54584.00 14362.00 38158.00 101.00
37.57 12.67 9.86 61.98 0.20
7.62 2.56 0.34
1064.82 501.02 532.09 23.25
15.87 18.62 18.21 16.60 0.12
1.93 0.77 0.09
3186.55 1298.21 2144.84 18.21
Ownership VariablesGovernance Variables
Control Variables
No. Obs. Min Max Mean S.D.
Table 1 Overall Descriptive Statistics (Panel A ’96)
% holding by the largest shareholder
% held by foreigners
% held by state-linked entities
% held by top 5 shareholders Concentration Index (HHI)
Board Size
No. of independent directors Ratio of independent directors
Total assets Total sales Total liabilities Age of companies Valid N (listwise)
Panel B (01)
182.661 0.058 0.081
Cox & Snell R Square Nagelkerke R Square -2 log likelihood
755.47 0.035 0.048
0.014 0.014 0.015 0.011 0.217 -0.88
0.013 0.011 0.011 0.142 0.216 0.940
1.121 1.572 1.816 0.006 1.010 0.878
1 1 1 1 1 1
0.290 0.210 0.178 0.940 0.315 0.349
1.014 1.014 1.016 1.011 1.243
B S.E Wald df Sig Exp(B)
Variables in the binary logistics equation
Cox & Snell R Square Nagelkerke R Square -2 log likelihood
-0.047 0.055 0.019 0.200 0.011 -0.1769
0.006 0.005 0.059 0.116 0.073 0.463
0.685 1.294 10.79 2.971 0.023 0.146
1 1 1 1 1 1
0.408 0.255 0.001 0.085 0.879 0.7024
0.995 1.006 1.020 1.222 1.011
B S.E Wald df Sig Exp(B)
Variables in the binary logistics equation
About Governance Structures?
Table 3 Regression Estimates with Board independence as the dependent vari- able –1996 and 2001
Ratio of Independent directors as dependent variable
Table 4 Regression Estimates with Board size as dependent variable –1996 and 2001
Board size as dependent variable
Constant
% largest Shareholder
% Foreigner
% State Ln of Total Assets Ln age
R2adjusted F-value
Obs
0.302 (15.76)***
-0.00033 (-0.65) 0.00046 (1.3) 0.00038 (0.96)
-0.005 0.733 148
0.346 (9.69)***
-0.00018 (-0.372) 0.00074 (1.96)**
0.00041 (0.976) -0.0021 (-3.583)***
0.00223 (2.647)***
0.113 2.35**
148
0.347 (37.97)***
0.000041 (0.018) -0.00013 (-0.724) -0.00017 (-0.889)
-0.03 0.431 583
0.330 (17.27)***
0.000234 (-0.1) 0.000209 (-1.08) 0.000228 (-1.11) 0.00113 (-0.368) 0.00882 (1.79)*
-0.007 0.721 582
1996Without control variables
With Control Variables
2001 Without control variables
With Control Variables
(***p<0.01, **p<0.05, *p<0.1)
(t-statistics are reported in parenthesis, beneath the parameter estimates)
Constant
% largest Shareholder
% Foreigner
% State Ln of Total Assets Ln age
R2 adjusted F-value
Obs
7.36 (16.77)*** -0.00253 (-0.216) 0.0195 (2.42)** 0.0125 (1.35)
0.027 2.34** 148
4.69 (5.99)*** -0.00032 (-0.029) 0.0083 (1.008) 0.0018 (0.195) 0.744 (6.006)*** -0.359 (1.94)**
0.218 3.4*** 148
7.12 (34.9)*** 0.00278 (0.556) 0.0183 (4.434)*** 0.0176 (4.12)***
0.056 12.53*** 588
5.90 (14.16) -0.00097 (-0.192) 0.01562 (3.702)*** 0.0133 (3.017)*** 0.357 (5.39)*** -0.209 (0.052)**
0.103 5.792*** 587
1996Without control variables
With Control Variables
2001 Without control variables
With Control Variables
(***p<0.01, **p<0.05, *p<0.1)
(t-statistics are reported in parenthesis, beneath the parameter estimates)
Table 2 Panel A (96) -Binary Logistic Regression Estimates with Chair- man/CEO Duality as Dependent Variable and Ownership as Indepen- dent Variable
Model Summary
Panel B (01)- Binary Logistics Regression Estimates with Chair- man/CEO Duality as Dependent Variable and Ownership As Indepen- dent Variable, 2001
Model Summary
% holding largest S/H
% Foreign
% State Ln Total Assets Ln Age Constant
% holding largest S/H
% Foreign
% State Ln Total Assets Ln Age Constant
% holding by largest Shareholder
% held by foreigners
% held by state-linked entities
% shareholding by top 5 shareholders Concentration Ratio (HHI)
Board Size
No. of Independent Directors Ratio of Independent Directors
Total Assets Total Sales Total Liabilities Age of Companies Valid N (listwise)
447 436 166 447 447
415 410 410
503 502 442 498 144
4.14 0.03 1.31 18.93 0.01
2.00 1.00 0.11
4.07 0.01 0.21 1.00
74.92 82.57 82.26 91.39 0.57
17.00 9.00 0.63
32488.00 10779.00 19320.00 96.00
32.10 15.92 20.58 57.21 0.15
7.45 2.25 0.31
932.49 480.73 501.44 23.62
15.31 18.36 19.05 15.91 0.11
2.02 0.67 0.10
2554.57 1100.78 1648.32 18.19
Ownership VariablesGovernance Variables
Control Variables
No. Obs. Min Max Mean S.D.
592.00 620.00 620.00 592.00 592.00
598.00 594.00 593.00
620.00 616.00 577.00 621.00 539.00
4.16 0.00 0.00 6.82 0.00
3.00 1.00 0.11
4.60 0.00 0.18 1.00
92.15 80.16 87.42 97.98 0.85
16.00 7.00 0.67
54584.00 14362.00 38158.00 101.00
37.57 12.67 9.86 61.98 0.20
7.62 2.56 0.34
1064.82 501.02 532.09 23.25
15.87 18.62 18.21 16.60 0.12
1.93 0.77 0.09
3186.55 1298.21 2144.84 18.21
Ownership VariablesGovernance Variables
Control Variables
No. Obs. Min Max Mean S.D.
Table 1 Overall Descriptive Statistics (Panel A ’96)
% holding by the largest shareholder
% held by foreigners
% held by state-linked entities
% held by top 5 shareholders Concentration Index (HHI)
Board Size
No. of independent directors Ratio of independent directors
Total assets Total sales Total liabilities Age of companies Valid N (listwise)
Panel B (01)
182.661 0.058 0.081
Cox & Snell R Square Nagelkerke R Square -2 log likelihood
755.47 0.035 0.048
0.014 0.014 0.015 0.011 0.217 -0.88
0.013 0.011 0.011 0.142 0.216 0.940
1.121 1.572 1.816 0.006 1.010 0.878
1 1 1 1 1 1
0.290 0.210 0.178 0.940 0.315 0.349
1.014 1.014 1.016 1.011 1.243
B S.E Wald df Sig Exp(B)
Variables in the binary logistics equation
Cox & Snell R Square Nagelkerke R Square -2 log likelihood
-0.047 0.055 0.019 0.200 0.011 -0.1769
0.006 0.005 0.059 0.116 0.073 0.463
0.685 1.294 10.79 2.971 0.023 0.146
1 1 1 1 1 1
0.408 0.255 0.001 0.085 0.879 0.7024
0.995 1.006 1.020 1.222 1.011
B S.E Wald df Sig Exp(B)
Variables in the binary logistics equation
About Governance Structures?
Table 3 Regression Estimates with Board independence as the dependent vari- able –1996 and 2001
Ratio of Independent directors as dependent variable
Table 4 Regression Estimates with Board size as dependent variable –1996 and 2001
Board size as dependent variable
Constant
% largest Shareholder
% Foreigner
% State Ln of Total Assets Ln age
R2adjusted F-value
Obs
0.302 (15.76)***
-0.00033 (-0.65) 0.00046 (1.3) 0.00038 (0.96)
-0.005 0.733 148
0.346 (9.69)***
-0.00018 (-0.372) 0.00074 (1.96)**
0.00041 (0.976) -0.0021 (-3.583)***
0.00223 (2.647)***
0.113 2.35**
148
0.347 (37.97)***
0.000041 (0.018) -0.00013 (-0.724) -0.00017 (-0.889)
-0.03 0.431 583
0.330 (17.27)***
0.000234 (-0.1) 0.000209 (-1.08) 0.000228 (-1.11) 0.00113 (-0.368) 0.00882 (1.79)*
-0.007 0.721 582
1996Without control variables
With Control Variables
2001 Without control variables
With Control Variables
(***p<0.01, **p<0.05, *p<0.1)
(t-statistics are reported in parenthesis, beneath the parameter estimates)
Constant
% largest Shareholder
% Foreigner
% State Ln of Total Assets Ln age
R2 adjusted F-value
Obs
7.36 (16.77)***
-0.00253 (-0.216) 0.0195 (2.42)**
0.0125 (1.35)
0.027 2.34**
148
4.69 (5.99)***
-0.00032 (-0.029) 0.0083 (1.008) 0.0018 (0.195) 0.744 (6.006)***
-0.359 (1.94)**
0.218 3.4***
148
7.12 (34.9)***
0.00278 (0.556) 0.0183 (4.434)***
0.0176 (4.12)***
0.056 12.53***
588
5.90 (14.16) -0.00097 (-0.192) 0.01562 (3.702)***
0.0133 (3.017)***
0.357 (5.39)***
-0.209 (0.052)**
0.103 5.792***
587
1996Without control variables
With Control Variables
2001 Without control variables
With Control Variables
(***p<0.01, **p<0.05, *p<0.1)
(t-statistics are reported in parenthesis, beneath the parameter estimates)
About Governance Structures?
Selected References :
Agarawal, Anup and Chales R. Knoeber. “Firm Performance and Mechanisms to Control Agency Problems between Managers and Shareholders”. The Journal of Financial and Quantitative Analysis, Vol. 31, No. 3. (September 1996) : 377-397.
Berle, A. Adolf and Gardiner Means. The Modern Corporation and Private Property. New York:
Macmillan, 1932 (reprint April 1947).
Booth R. James, Marcia Millon Cornet and Hassan Tehranian. “Board of Directors, Ownership and Regulation”. Journal of Banking and Finance. 26 (2002) : 1973-1996.
Claessens, Stijn, Simeon Djankov and Larry Lang. “The Separation of Ownership and Control in East Asian Corporations”. Journal of Financial Economics. No. 58 (Oct 2000) : 81-112.
_. “East Asian Corporations: Heroes or Villains?” Discussion Paper No 409. World Bank.
(January 2000).
Denis, J. David and Diane K. Denis. “Majority Owner-Managers and Organizational Efficiency”.
Journal of Corporate Finance. No. 1 (1994) : 91-118.
Fama, E and Michael Jensen. “ Separation of Ownership and Control”. Journal of Law and Economics. No.26 (June 1983) : 301-326.
Gomez, E., Terence and Jomo K.S. Malaysia’s Political Economy-Politics, Patronage and Profits.
2
ndEd.. Cambridge: Cambridge University Press. 1999.
Hermalin, E. Benjamin and Michael S. Weisbach. “Effects of Board Composition and Direct Incentive on Firm Performance”. Financial Management. (Winter 1991) : 101-112.
Holderness, Clifford, Randall. S. Kroszner and Denis Sheehan. “Were the good old days that good, Changes in Managerial Stock Ownership since the Great Depression”. Journal of Finance, No.
54, No2, (April 1999) : 435-469.
Jensen, Michael. “The Modern Industrial Revolution, Exit, and the Failure of Internal Control Systems.” The Journal of Finance, Vol. XLVIII, No.3 (July 1993) : 833.
Keasey, Kevin, Steve Thompson and Mike Wright, eds. Corporate Governance. (Vol. I –IV). The International Library of Critical Writings in Economics 106. Cheltenham: Edward Elgar Publishing Ltd. 1999.
La Porta, Rafael. Florencio Lopez-De-Silanes, Andrei Shleifer and Robert W. Vishny, “Investor Protection and Corporate Valuation”. Journal of Finance, Vol. 57, No. 3 (2002): 1147-1170.
_, “Investor Protection and Corporate Governance”. Journal of Financial Economics Vol. 58.
(2000) : 3-27.
_, Florencio Lopez-de-Silanes and Andrei Shleifer. “Corporate Ownership Around the World”. Journal of Finance, 54, No.2 ( 1999) : 471-517.
_. “ Law and Finance”. Journal of Political Economy, 106. No. 6 (December 1998) :1113-1155.
_. “Legal Determinants of External Finance”. The Journal of Finance. Vol. 52, No. 3 (1997) :
1131-1150.
Value: Evidence from the East Asian Financial Crisis”. The Journal of Finance. Vol. LVIII.
No.4 (August 2003) : 1445-1467.
Lim, Mah Hui. Ownership and Control of the One Hundred Largest Corporations in Malaysia.
Kuala Lumpur: Oxford University Press, 1981.
Malaysian Code on Corporate Governance. Malaysian Institute of Corporate Governance. Kuala Lumpur: Malayan Law Journal Sdn. Bhd, January, 2001.
McKinsey Global Investor Opinion Survey on Corporate Governance. McKinsey & Company, 2002.
Monks., A.G. Robert and Nell Minnows. Corporate Governance. 2
ndEd. Oxford, UK: Blackwell Publishers Ltd., 2001.
Shleifer, Andrei and Robert W. Vishny. “ A Survey of Corporate Governance”. The Journal of Finance. Vol. 52, No.2 (1997) : 737-783.
_. “Large Shareholders and Corporate Control”. Journal of Political Economy, 94. (1986) : 461-88.
Smith, Adam “ An Inquiry Into the Nature and Causes of the Wealth of Nations”. In Great Books of the Western World. Vol. 32. Mortimer J. Adler (Editor-in-Chief). 2
nded. Chicago: Encyclopedia Britannica. 1990: 32.
Wier, C and David Liang. “Governance Structures, Director Independence and Corporate
Performance in the UK”. European Business Review. Vol. 13. No. 2 (2001) : 86-94.
About Governance Structures?
エージェンシー論と企業統治において、企業最高責任者と代表取締役を分離するこ と及び社外取締役の数を増やすことを推奨している。本研究では、こうした企業統治 構造が企業所有者によって、違った傾向が存在するかどうかについて検証を行った。
クアラルンプール証券取引所の二つのデータセットを検証した結果、企業最高責任者 と代表取締役を分離させること及び社外取締役の数を増加させることによって、法的 規制をより遵守する傾向があることを発見した。また、公的企業の方がより多くの取 締役を持つとともに、企業最高責任者と代表取締役の役割を分離する傾向が見られた。
企業所有は私たちに統治構造の何を語りかけるのか?
< 要 約 >
スンダラン・アナマライ