Japanese Jqumal of Tropical Mcdicine and Hygiene
第5巻 第2号 昭和52年9月15日
、内 容
原 著
季候の変化と身体鍛練による高温曝露時の生理的反応の変動(英文)……一……堀 高温環境下の労働時にみられる高温曝露時の生理的反応の適応的変化(英文)…堀 長崎地方における肝硬変・肝癌とHBs抗原について
一病理組織学的研究一………一・……・………・…・……・………一・……神田 直腸生検を中心とした日本住血吸虫症の研究
2 直腸生検の価値………・…・・………加茂 悦爾・薬袋 勝・石崎 輸入動物の寄生虫
1.インドネシァ産ミズヘビのTα%g鰯o,h翻s(英文)………影井 昇,正垣
学術記録
日本熱帯医学会九州支部第1回大会講演要旨…・・………一…・閣一・
投稿規定
清記 93−104 清記105−115
哲郎117−139
達141−154
幸男155−159
161−170
日熱医会誌
Japan.J.T.M.H. 日 本熱帯医学会
CHANGES IN PHYSIOLOGICAL REACTIONS TO A HOT ENVIRONMENT INDUCED BY CLIMATIC
CHANGE AND PHYSICAL TRAINING
SEIKI HORI
Received for publication 4 May 1977
Abstract: Fifteen young male Japanese athletes and 15 young male Japanese non‑athletes in the sitting‑resting position were exposed to a hot environment in winter and summer. Sweating was induced in a climatic chamber of DBT 30 C with 7001' relative humidity by immersion of both legs just below the knees in the stirring water bath of 42 C for 90 min after sitting in a chair at rest for 30 min in the chamber.
The maximal oxygen uptake, record of I OO m dash and back strength were measured on l 6 subjects in summer. Both athletes and non‑athletes showed a similar and clear seasonal
variation of sweating reaction. Sweating reaction in summer was characterized by a lower salt concentration in sweat in spite of a larger sweat volume. The rise in rectal temperature for both athletes and non‑athletes in summer was smaller than that in winter.
Athletes showed a smaller sweat volume, Iower salt concentration in sweat and smaller rise in rectal temperature than non‑athletes both in summer and winter. Heat tolerance of athletes was superior to that of non‑athletes in both summer and winter when the heat tolerance was assessed by our index I for the assessment of heat tolerance. A definite tendency towards a small rise in rectal temperature and superior heat tolerance for sub‑
jects with lower salt concentration in sweat at a given sweat loss was observed. Positive correlations of heat tolerance to maximal oxygen uptake, the speed of 100 m dash and muscular strength were observed and heat tolerance was more closely correlated to maximal oxygen uptake than the speed of 100 m dash and muscular strength. The reasons for superior heat tolerance of athletes and the subjects with lower salt concentration in sweat were discussed.
INTRODUCTION
Evaporation of sweat from the skin is the main way of dissipating body heat when men are exposed to a hot environment (Kuno, 1 934) . It is generally agreed that unacclimatized subjects have a marked rise in rectal temperature due to a slower onset of sweating and the lower sweat rate (Kuno, 1 956; Bass, 1 963). How‑
ever, certain adaptive changes in sweating reaction are observed when unacclimatized subjects are repeatedly exposed to heat. After successive heat exposures it has always been found that the subjects sweat more readily and more profusely (Robinson et al., 1943; Adolph, 1946; Belding and Hatch, 1963; Dill et al., 1938, 1967). These adaptive changes in sweating reaction gradually disappear after the cessession of heat exposure (Robinson et al., 1943; Adam et al., 1960; Bean and Eichna, 1943;
Department of Physiology, Hyogo College of Medicine, Nishinomiya, Japan.
94
Wyndham and Jacobs, 1957; Williams et al., 1967) and several investigators reported that man sweats more promptly and more profusely in summer than he does under the same environmental conditions in winter (Kuno, 1956; Ohara, 1966). Contrary to this, tropical natives sweat less while immigrants to the tropical zone sweat more when they are exposed to the same strong heat stress (Kuno, 1 956; Wyndham et al., 1964). It is well known that the temperature regulatory responses of sweating and cardiovascular changes are observed during strenuous physical training (Robinson, 1963) and unacclimatized subjects acclimatized rapidly to heat by daily exposures to a combination of hard work and the hot environment (Robinson et al., 1943 ; Bass, 1963). Some investigators reported that the work and heat stress imposed on the untrained men resulted in the more severe physiological strain when compared with that of the trained men (Bean and Eichna, 1943 ; Robinson et al., 1943 ; Lind and Bass, 1963 ; Piwonka and Robinson, 1965) . Thus it is ofinterest to study how climate and physical training may relate to sweating reaction and heat tolerance of men and how work capacity may relate to heat tolerance. Recently we proposed to assess heat tolerance of the subject by a simple numerical index involving relative rise in rectal temperature, relative water loss and relative salt loss (Hori et al., 1974). In the present study, an attempt has been made to examine the effect of climate and physical training on the physiological responses to heat and to compare the heat tolerance of athletes with that of non‑athletes in winter and summer by using our indeces for the assessment of heat tolerance.
MATERIALS AND METHODS
Fifteen young male Japanese athletes and 1 5 young male Japanese non‑athletes were exposed to a hot environment at rest in winter and summer. Each subject dressed in shorts only and sat in a chair at rest in the climatic chamber of 30 C with 700/0 relative humidity for 30 min. Then, they immersed both legs into a stirring water bath of 42 C until the level of water was just below the knees and stayed there for 90 min. Local sweat samples from the chest and back were collected by the filter paper method during each 15 minute period. The local sweat rate was de‑
termined by weighing filter paper covering 12.6 cm2 of the skin area (Ohara, 1966).
The fllter paper was eluted and sodium concentration in sweat was determined by the flame photometry. Sodium concentration was used to calculate salt loss. Body weight was measured before and after each experiment with an accurary of 5 g and the net body weight was calculated by subtracting the weight of the shorts. Rectal temperature was recorded continuously by copper‑constantan thermocouples before and during the experiment. To assess the heat tolerance of the subjects, we express physiological strain by the combination of relative rise in rectal temperature, relative water loss and relative salt loss, using the flnal value of these three factors as those which causes heat stroke (40.6 C), water depletion heat exhaustion (70/0 of body weight) and salt depletion heat exhaustion (0.75 g/kg of body weight) (Leithead and Lind, 1964) .
The indices for the assessment of heat tolerance are calculated as follows :
Index I=VA2+B2+C2
"L
Index S= JA2 + B2 B
A= 0.07 x Wi AW B= 40.6 ‑ Ti AT C= 0.75 x Wi Q
where : A W=weight loss at the end of the experiment (kg) W=initial body weight (kg)
T=rise in rectal temperature at the end of the experiment (C) Ti=initial rectal temperature (C)
Q =0.058 X A Wx Cr
C=the mean sodium concentration of local sweat (mEq/L)
To examine the relation of three qualities of physical performance i.e., endurance, speed and muscular strength to heat tolerance, the maximal oxygen uptake, record of 100 m dash and back strength for 16 subjects were measured. The maximal oxygen uptake was determined by a bicycle ergometer exercise.
RESULTS
Table l shows body weight, body weight loss, initial rectal temperature, rrse
Table 1 Comparison of changes in body weight, rectal temperature and mean sodium concentration in athletes and non‑athletes in winter and summer
W (kg) A W (kg)
T (C) A T (C) C (*Eq/L)
winter athletes
59.7 5.2
***G
***s 0.48 0.08
37.4 0.3
***s
0.58 O. 1 2 56.3 1 2.5
non‑athletes 59.6 4・O
***G
***s
0.62 O. 1 1
37.5 0.4
0.67 O. 1 6 **s 65.9 1 7.3 *s
summer
athletes
62.9 4・4
***s **G
0.68 O. 1 4 37.3 0.3
***s
0.44 O. 1 3 45.8 20.8
non‑athletes 57.6 4・5
***s **G
0.79 O, I O
37.4 0.3
0.53 O. 1 4 **s 50.8 1 7.6 *s
W:
A W:
T:
A T:
F:
*G :
*S :
*:
** :
*** :
Initial body weight Body weight loss
Initial rectal temperature Rise in rectal temperature
Mean sodium concentration in sweat
Mean values are given with their standard deviations Significant difference between athletes and non‑athletes
Signiflcant difference between winter and summer in the same group at 50/0 Ievel
at 20/0 Ievel at I o/o level
96
in rectal temperature at the end of the experiment and mean sodium concentration in local sweat of the athlete group and non‑athlete group in winter and summer.
The mean values of weight loss in the athlete group were significantly smaller than those in the non‑athlete group in both seasons. The mean values of weight loss of the two groups were significantly smaller in winter than in summer. The athlete group showed considerably smaller mean values of rise in rectal temperature in winter and summer when compared with those for the non‑athlete group. However, these differences were not statistically significant. In both groups, the mean values of rise in rectal temperature in summer were significantly smaller than those in winter.
The mean values of the mean sodium concentration in local sweat were 56.3 mEq/L for the athlete group in winter, 65.9 mEq/L for the non‑athlete group in winter, 45.8 mEq/L for the athlete group in summer and 50.8 mEq/L for the non‑athlete group in summer. Although the values for the athlete‑group were fairly lower than those for the non‑athlete group in both seasons and value for the athletes group in winter was higher than that for the athlete group in summer, there were no statisti‑
cally significant differences between them. The non‑athlete group showed significantly higher mean value of the mean sodium concentration in local sweat in winter than in summer. The mean values of heat tolerance indices and their com‑
ponents for both groups in both seasons are shown in Table 2. The athlete group showed significantly lower mean values of index I and their three components in both seasons. Both groups showed significantly lower mean values of relative water loss in winter than in summer and significantly higher mean values of relative rise in rectal temperature and S value in winter than in summer. Relative salt loss for both groups in both seasons were plotted against relative water loss for both groups in both
Table 2 Comparison of heat tolerance indices and their components in athletes and non‑athletes in winter and summer
A B C
I
S
winter athletes
***G
***s
O. I 1 7 0.023
*** * O. 1 83 0.036
***G
0.036 0.0 1 2
***G 0.223 0.034 l .5 1 0.44
non‑athletes
***G.
***s
O. 1 51 0.032
***s *G 0.2 1 5 0.048
***G
0.054 0.0 1 8
***G 0.2 73 0.036 1 .42 0.59
summer
athletes
***G
***s
O. 1 55 0.034
***s *G O. 1 33 0.040 0.039 0.0 1 9 *G
***G
0.2 1 5 0.037 0.87 0.33
non‑athletes
***G
***s O. 1 95 0.025
***s *G O. 1 65 0.040 0.055 0.02 1 *G
***G 0.265 0.02 7
0.81 0.24 A:
B:
C:
S:
*G:
*S :
Relative water loss
Relative rise in rectal temperature Relative salt loss
Heat tolerance index
Heat tolerance index, effectiveness of sweating Mean values are given with standard deviations Significant difference between athletes and non‑athletes
Significant difference between winter and summer in the same group
008
006
:9
:5: a' u'
>OO.4
L !
cx o
002
r
A o
JL A e o A+
A JL,
W'‑
A
A A
A A
/ AN :1F
. '
‑‑'s
L
JL
A
ee AA l / dLT To ,
e 'AI A A A
J
e
o o
o o
A
A
Figure
0,05 0.1 O1 5 Rela:tive water loss
0.2 025
l Correlation between relative salt loss and relative water loss.
O : Athletes in winter, O : Athletes in summer, L : Non‑
athletes in winter, A : Non‑athletes in summer, + : Mean value, A: Athletes, N : Non‑athletes, W: Winter, S : Summer.
Arrows indicate shift with climatic change and physical training.
0.3
a' L
, . !1't;
o
: 0,2 75 u
,c̲
o
,u] : o 0,1
,:)‑
oc
, o
Jb
A A JLO A J, W¥ +
e JL' 1 + Aoo A JL A
e) o 'A
A/' o + o
・rN
^ '+
¥ S
o o
A
o.
A
A
Figure 2
005 0.1 O J 5 Retative water loss Correlation between relative rise in relative water loss.
Symbols are the same as Figure I .
02 rectal
025 temperature and
seasons in Figure I . In both seasons, points for athletes were located in the lower left region when compared with those for non‑athletes. Points for both groups in summer were located in right region and tended to scatter more widely when com‑
98
pared with those in winter. Relationship between relative rise in rectal temperature and relative water loss is shown in Figure 2. Roughly speaking, points for both groups moved into right and low direction in summer and points for athletes tended to locate in the lower left region in both seasons. The values of the index I for both groups in both seasons were plotted against those of S for both groups in both seasons in Figure 3. In this Figure, parameter a indicates various levels of iso‑sweating
0'3
o x
a' u
8 0'2
0.1
a=0'2
IChQ25 /
^It/, .l
^ ^^ >
L/^ : .^ Ay̲.sw
^ ' l^
^/:. +/ /1 / '
/. s'l../. ' /
A
O O O
"r}1' '
A
e
e
a=os5
e L
A
‑o 2
‑0.1
08
zo
1.5
Heat toleranGe index S
Figure 3 Correlation between heat tolerance indices I and S.
Symbols are the same as Figure I .
a : Parameter indicating various levels of iso‑sweating lines which are drawn by connecting mean value of A(1 +C2/A2)i/2 (Hori et al.. 1974).
lines which are drawn by connecting the points of the same value of A(1 +C2/A2)1/2 (Hori et al., 1974). Points belonging to athletes were located in the lower region than those belonging to non‑athletes in both seasons and points in the summer ex‑
periments were located in the left region when compared with those in winter experiments. That is, the value of parameter a was smaller in athletes than in non‑
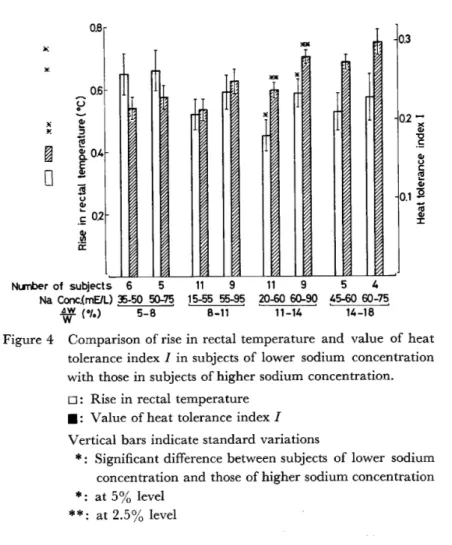
athletes and was smaller in surnmer than in winter. Figure 4 shows the relation of sodium concentration in sweat to rise in rectal temperature and value of the index I.
Higher sodium concentrations in sweat at a given sweat rate were accompanied by higher rise in rectal temperature and larger absolute value of the index I at different sweat rates. At the AW/ W ratio of I 1‑140/0' Iower sodium concentration group showed significant lower rise in rectal temperature and significantly lower value of index I than higher sodium concentration group. These facts indicate that changes in sweat sodium concentration relate to adaptative changes in thermal regulation in man. Table 3 shows the values of maximal oxygen uptake, record of I OO m dash, back strength and the index I for 16 subjects obtained in the present study and corre‑
lation of the I value to three qualities of physical fitness i.e. maximal oxygen uptake, the speed of I OO m dash and muscular strength. The mean values of maximal
,;
0.8
OS
' G, L
=
!1'*
'!'a 0.4
!
u 1' .c: 0.2
a
i2
o.3
0,2 ‑ x
d;
.c̲
'l'
u c
(U L o
0,1 1*
., g
I
NL11lber of subjects 6 5 11 9 11 9 5 4
Na Conc(mE/L) 35‑50 50!75 1 5 ;5 55 ;5 20 O 60‑90 45‑eo co‑75
W ('/.) 14‑18 5‑8 8‑11 1 1 ‑14
Figure 4 Comparison of' rise in rectal temperature and value of heat tolerance index I in subjects of lower sodium concentration with those in subjects of higher sodium concentration.
[II : Rise in rectal temperature I : Value of heat tolerance index I Vertical bars indicate standard variations
* : Signiflcant difference between subjects of lower sodium concentration and those of higher sodium concentration
* : at 50/0 Ievel
**: at 2.5 Ievel
Table 3 Maximal oxygen intake, record of 100 m dash, back strength and the value of index I
Max.
Min.
Mean
S. D.
Correlation Coef ficient*
Maximal oxygen uptake
(mljkg'min) 47.5 30.8
41 .7 5.3
‑ 0.55
Record of 100 m dash
(m/sec) 7.58 6.76 7.13 0.25
‑ 0.47
Back strength
(kg) 181 l 08 1 52 17
‑0.15
index I 0.267
O. 1 49 0.2 1 7
0.030
* Correlation between the value of index I and maximal oxygen intake, record of I OO m dash and back strength.
oxygen uptake was 41 .7 ml/kg'min with a range of 30.8 mljkg'min to 47.5 ml/kg'min.
The record of 100 m dash ranged from 6.76 mjsec to 7.58 m/sec and its mean value was 7.13 m/sec. The average back strength was 152 kg ranging from 108 kg to 181 kg. The mean value of the index I for 16 subjects was 0.217 with a range of O. 149 to 0.267. Heat tolerance assessed by our index for the assessment of heat toler‑
ance was more closely correlated to maximal oxygen uptake than the speed of I OO m
1 OO
0.3
t f 0.2
y = ‑0.00314 x 0.348 r = ‑0.55
n = 16‑‑‑‑‑
e
e e e
e
y = ‑0.00372x t0,367 r = ‑0.71
( is omitted)
n=15
:e
¥* :i¥e ,
e e: J :̲̲¥ ¥
e
Figure 5
Oxygen uptake(ml/kglmin.)
Correlation between heat tolerance index I at rest and maximal oxygen intake.
Heat tolerance was assessed by Ohara's sweat test and maximal oxygen intake was determined by bicycle ergo‑
meter exercise.
dash and muscular strength. Relationship between values of heat tolerance index and those of maximal oxygen uptake was shown in Figure 5. A fairly good cor‑
relation was found between them, the correlation coeflicient between them was
‑0.55 and this value was ‑0.71 when one exceptional case was omitted. The fol‑
lowing regression equation was obtained when one exceptional case was omitted y=
‑0.00372x+0.367, where y represents the value of maximal oxygen uptake (ml/
kg'min), while x that for heat tolerance index.
DISCUSSION
Significantly smaller mean values of sweat rate and considerable lower mean values of rise in rectal temperature for athletes in winter and summer than those for non‑athletes are shown in Table I . The circulatory system and the subcutaneous fat play an important part in thermal regulation in man (Bass, 1963; Edholm et al., 1956; Stoll, 1967; Houdas et al., 1972; Buskirk et al., 1965). Metabolic heat is principally transferred by the circulatory system from the core to the skin and the subcutaneous fat prevent heat transfer from the core to the skin when the net heat is transferred from the body to the environment. The cutaneous blood flow facilitates to dissipate heat and the subcutaneous fat keeps heat from dissipation under the condition used in the present study. The cardiovascular system of athletes is generally found to be superior to that of non‑athletes and many investigators reported that mean skinfolds were thinner in athletes than in non‑athletes (Nagamine et al., 1 966) . The thickness of the subcutaneous fat decreases by physical training (Pascale
et al., 1955) and increases following the cessession of physical training (Parizkova,
1959). From the above account, the smaller sweat volume and the lower rise in rectal temperature for athletes in both seasons might be interpreted as the result of their superior capacity for heat dissipation without sweating when compared with non‑athletes. Significantly smaller mean values of relative rise in rectal temperature and relative water loss for athletes in both seasons were reflected by the significantly smaller rise in rectal temperature and smaller sweat loss for athletes in both seasons respectively. The athlete group showed significantly lower mean values of relative salt loss than the non‑athlete group in both seasons. These differences resulted from smaller sweat volume and lower salt concentration in sweat for athletes in both seasons.
The value of our index I for the assessment of heat tolerance is expressed by the combination of relative water loss, relative rise in rectal temperature and relative salt loss. It follows that the mean values of the index I for athletes in both seasons were significantly lower than those for non‑athletes. Essentially the same temperature regulatory responses of sweating and cardiovascular changes induced during heat exposure are observed during physical training (Robinson, 1963). Therefore, smaller magnitude of strain in terms of three components of index I for athletes and superior heat tolerance ofathletes assessed by our index I might be interpreted as the effect ofheat acclimatization acquired through their daily strenuous physical training.
It is well known that sweat rate is higher and salt concentration in sweat is lower in summer than winter (Ohara, 1966; Kuno, 1956). In both groups, sweating reaction in summer was characterized by a lower salt concentration in sweat in spite of a higher sweat rate, while the rise in rectal temperature in summer was smaller than in winter.
Increase in sweat rate is accompanied by increased evaporative heat loss and it is expected that a smaller rise in rectal temperature might be caused by more profuse sweating. However, athletes showed a smaller rise in rectal temperature and smaller sweat loss than non‑athletes in the present study. As already described, one of the reasons for less sweat loss and smaller rise in rectal temperature for athletes might be their superior capacity for heat dissipation without sweating. As shown in Figure 3, values of parameter a for athletes were markedly smaller than those for non‑athletes in both seasons while difference in the value of S was small between two groups.
Smaller value of parameter a at a given value of S indicates a better efflciency of sweating for heat dissipation. Therefore, difference in the effectiveness of sweating for cooling the body between athletes and non‑athletes could be considered a possible cause of smaller sweat volume and smaller rise in rectal temperature for athletes.
The magnitude of evaporation of sweat is dependent on the degree of wetness of the skin and the difference in vapor pressure between the skin surface and the surrounding air. The amount ofevaporation from the skin is increased by the increase in the sweat rate until the skin surface behaves as a completely wet surface. Sweat secretion varies considerably in amount in different parts of the skin surface (Weiner, 1945).
H6fler (1968) reported that a shift ofsweat distribution toward the limbs was observed during heat acclimatization and he suggested this shift implied a better utilization of large surface areas with most favorable evaporative conditions. Increase in the sweat rate represents only wasted sweat after the complete wetness of the skin surface is brought about. Moreover, increase in salt concentration accompanied by the in‑
creased sweat rate (Kittsteiner, 1911) reduces the difference between the vapor
102
pressure ofwater on the skin surface and that in the air. The decreased evaporation of sweat caused by this reduced vapor difference facilitates to rise in body temperature.
Rise in body temperature induces more profuse sweating and higher salt concentration in sweat thus a vicious circle in terms of thermal regulation arises. Relation of sodium concentration in sweat to the rise in rectal temperature and value of the index I at a given ratio of body weight loss to initial body weight is shown in Figure 4.
At the lower value of AW/W ratio, a slight but insignificantly higher values of rise in rectal temperature and the index I for higher sodium concentration group might be interpreted that the amount of evaporation of sweat from the skin depended mainly upon the percentage of the wetted skin area determined which is usually proportional to sweat volume at the low sweat rate. In cases of high value of AW/ W ratio, the higher sodium concentration group showed higher rise in rectal temperature and higher value of index I than the lower sodium concentration group. These differences might be caused by better utilization of the skin surface wetted, Iower salt concen‑
tration in sweat and superior capacity for heat dissipation without sweating usually observed in heat acclimatized subjects. In both transitory adaptation to heat and long term heat acclimatization, it has generally been found that the sweat salt concentration decreased at a given sweat rate as men acclimatized to the hot environment (Dill et al., 1938, 1967; Kuno, 1956). Based on the account described above, Kuno ( 1 956) suggested that the level of chloride concentration in sweat might be a reliable indication of adaptation to heat. Ohara (1968) used four types of sweating pattern classified according to the local sweat rate and salt concentration in sweat to assess heat tolerance. I :e compared sweating types with other physiological responses to heat, and concluded that his sweating type 4, Iow sweat rate ‑ Iow salt content type, was most tolerant to heat. The correlation of Ohara's sweating types to our index for the assessment of heat tolerance was studied by us and we confirmed Ohara's conclusion concerning relation ofsalt concentration in sweat to heat tolerance (Hori et al., 1 974) . Superior heat tolerance of athletes to non‑athletes observed in the present study strongly suggested that heat tolerance might correlate to physical performance. We compared heat tolerance assessed by our index with three qualities of physical fitness. The results obtained in the present study showed heat tolerance was more closely correlated to maximal oxygen uptake than the speed of I OO m dash and muscular strength. It is well known that rank order of ability to perform a task changes sometimes as ambient temperature rises from comfortable to hot. It is assumed that heat tolerance is one of the important factors determining the ability to perform a task in hot environments.
REFERENCES
1) Adam, J. M., Fox, R. H., Grimby, G., Kidd, D.J. and Wolff, H. S. (1960) : Acclimatization to heat and its rate of decay in man, J. Physiol., London 152, 26‑27
2) Adolph, E. F. ( 1946) : The initiation of sweating in response to heat, Am. J. Physiol., 145,
7 1 0‑7 1 5
3) Bass, D. E. ( 1963) : Thermoregulatory and circulatory adjustments during acclimation to heat in man, Temperature, Its measurement and control., New York : Reinhold, 3, 229‑305
4) Bean, W. B. and Eichna, L. W. ( 1943) : Performance in relation to environmental temperature, Federation Proc., 2, 144‑158
5) Belding, H. S. and Hatch, T. F. ( 1963) : Relation of skin temperature to acclimation and tolerance to heat, Federation Proc., 22, 881‑883
6) Buskirk, E. R., Lundegren, H. and Magnusson, L. ( 1965) : Heat acclimatization patterns in obese and lean individuals, Ann. N. Y. Acad. Sci., 1 3 1 , 637‑653
7) Dill, D. B., Hall, F. G. and Edwards, H. T. ( 1938) : Changes in composition of sweat during acclimation to heat, Am. J. Physiol., 123, 412‑419
8) Dill, D. B., Horvath, S. M., Beaumont, W. V., Gehlsen, G. and Burrus, K. (1967) : Sweat electrolytes in desert walks, J. Appl. Physiol., 23, 746‑751
9) Edholm, O. G., Fox, R. H. and Macpherson. R. K. ( 1956) : The effect of body heating on the circulation in skin and muscle, J. Physiol., London, 134, 612‑619
lO) H6fler, W. ( 1968) : Changes in regional distribution of sweating during acclimatization to heat, J. Appl. Physiol., 25 (5), 503‑506
1 1) Hori, S., Inouye, A. and lhzuka, H. ( 1974) : Indices and sweating patterns for the assessment of heat tolerance, Jap. J. Physiol., 24, 263‑275
12) Houdas, Y., Colin, J., Timbal,J., Boutelier, C. and Guieu, J. (1972) : Skin temperatures in warm environments and the control ofsweat evaporation, J. Appl. Physiol., 33 ( 1), 99‑104 l 3) Kittsteiner, C. ( 191 1 ) : "Sekretion, Kochsaltgehalt und Reaktion des Schweisses" Arch. Hyg.
Berl. 73, 275‑306
Kuno, Y. (1934) : The Physiology of Human Perspiration, London : Churchill Kuno, Y. ( 1956) : Human perspiration, Charles C. Thomas, Spring field
Leithead, C. S. and Lind, A. R. ( 1964) : Heat stress and heat disorders, Philadelphia: Davis Lind, A. R. and Bass, D. E. (. 1963) : Optimal exposure time for development of acclimatizat.ion to heat, Federation Proc., 22, 704‑708
18) Nagamine, S., Kuga, T., Yamakawa, K., Oshima, S., Suzuki, H. and Suzuki, S. (1966) : The comparison of body composition between athletes and non‑athletes, Jap. J. Nutr., 24 ( I ), 3‑8 (in Japanese)
19) Ohara, K. ( 1966) : Chloride concentration in sweat; Its individual, regional, seasonal and some other variations, and interrelations between them, Jap. J. Physiol., 16, 27 290
Ohara, K. (1968) : Heat tolerance and sweating type, Nagoya Med. J., 14, 1 33‑144
Pascale, L. R., Frankel, T., Grossman, M. I., Freeman, S., Falier, I. L. and Bond, F.. E. (1955) : Report of changes in body compositicuT of soldiers during paratrooper training, Army Med.
Nutrition Lab., Denver Col., Rep. No. 156, 1‑14
22) Parizkova, J. ( 1959) : The development of subcutaneous fat in adolescents and the effect of physical training and sport, Physiol. Bohem. 8, 1 12‑1 1 3
23) Piwonka, R. W., Robinson, S., Gay, V. L. and Manalis, R. S. (1965) : Preacclimatization of men to heat by training, J. Appl. Physiol., 20, 379‑383
Robinson, S. ( 1963) : Temperature regulation in exercise, Pediatrics, 32, 691‑702
Robinson, S., Turrell, E. S., Belding, H. S. and Horvath, S. M. ( 1943) : Rapid acclimatization to work in hot climates, Am. J. Physiol., 140, 168‑176
Stoll, A. M. ( 1967) : Heat transfer in biotechnology, Advan. Heat Transfer 4, 65‑141 Weiner, J. S. ( 1945) : The regional distribution of sweating, J. Physiol. (Lond.), 104, 32‑40 Williams, C. G., Wyndham, C. H. and Morrison, J. F. (1967) : Rate of loss of acclimatization in summer and winter, J. Appl. Physiol., 22 ( l), 2 1‑26
29) Wyndham, C. H. and Jacobs, G. E. {1957): Loss of acclimatization after six days in cool conditions on the surface of a mine, J. Appl. Physiol., 19, 598‑606
30) Wyndham, C. H., Strydom, N. B., Morrison, J. F., Williams, C. G.. Von Rahden, M.J. E., Holdworth, L. D., Von Resenburg, A.J. and Munro, A. (1964) : Heat reactions of Caucasians and Bantu in Africa? J. Appl. Physiol., 19; 598‑606
1 4) 1 5) 16) 17)
20) 21)
24) 25) 26) 27) 28)
104
季候の変化と身体鍛練による高温曝露時の生理的反応の変動
堀 清 ゴゴロ己
15名の日本人成人男子の運動鍛練者と15名の非鍛練者について,夏季および冬季に安静状態で高温 環境に曝露したときにみられる生理的反応を測定して,夏および冬における鍛練者と非鍛練者との生 理的反応の差異と耐熱性を比較した。また最大酸素摂取量,100メートル競走時の速度,背筋力と耐 熱性との相関を求めて体力と耐熱性の関係をみた。高温曝露実験は被検者に水泳パンツだけを着用さ せ,30C湿度70%の室内に30分間静座させた後,膝から下の両下肢をよく掩搾された42Cの水に90 分間温浴させて行った。高温曝露時の直腸温,心拍数,体重の変化を測定し,15分毎に発汗濾紙法で 胸部およぴ背部の局所発汗を採集して,その塩分濃度を測定した。発汗量は鍛練者,非鍛練者ともに 夏は冬より有意に多かったが,両時期ともに鍛練者の発汗量は非鍛練者よりも有意に少なかった。汗 の塩分濃度は,両群ともに夏は冬より薄く,鍛練者の塩分濃度は非鍛練者より薄かった。直腸温の上 昇度は夏は冬より有意に低く,鍛練者は非鍛練者と比較して夏冬ともに低い傾向を示した。直腸温の 上昇度,水分損失量,塩分損失量より総合的に耐熱性を判定すれぱ,両群とも夏の方が冬よりわずか に耐熱性が勝れ,鍛練者は非鍛練者より夏冬ともに耐熱性が勝れていた。汗の塩分濃度の薄い被検者 は耐熱性が勝れている傾向を示した。また耐熱性は背筋力や100メートル競走時の速度より,最大酸 素摂取量との相関が強く,持久的な体力と耐熱性との関連が大きいことが推定された。鍛練者が非鍛 練者より耐熱性が勝れている理由は,運動鍛練時に体内に生じる多量の熱を放散する必要があるため,
体温調節機能が訓練されて勝れた循環機能とあいまって発汗反応も長期間の高温馴化者の反応に近く なり,勝れた放熱能力を保持するに至ったためと推定される。
兵庫医科大学第一生理学教室
ADAPTIVE CHANGES IN PHYSIOLOGICAL RESPONSES TO HEAT AND HEAT TOLERANCE INDUCED BY
DAILY EXPOSURE TO A MODERATE WORK AND ENVIRONMENTAL HEAT
SEIKI HORI
Received for publication 4 May 1977
Abstract: Eight male subjects, ages 19 to 2 l, were exposed to a combination of exercise and environmental heat for 15 successive days in autumn. Muscular exercise was performed on a bicycle ergometer at constant work load of600 kg'm/min at the cycling rate of 50 rpm for 60 min in the room of 30 C 700/0 relative humidity. Sweat test was done on the first, 5th, lOth and 15th days. Sweating was induced by immersing both legs just up to the knees into a water bath of 42 C in the climatic chamber of 30 C with 700/0 R.H. for 90 min. Rise in rectal temperature and increase in heart rate induced by a given heat stress decreased progressively throughout heat exposure. Body weight loss increased during the first 5 days, thereafter showed a trend to be smaller. Sodium concentration in sweat at a given sweat rate decreased during heat acclimatization. The mean value of heat tolerance index I, the magnitude of disturbance induced in the body concerning thermal regulation and water‑electrolyte metabolism, continued to decrease during heat acclimatization. The mean value of heat tolerance index S, effectiveness of sweating, increased during the first 5 days, thereafter decreased.
In conclusion, improvement of heat tolerance accompanied by reduction of dis‑
turbance of thermal regulation was induced at the cost of increase of disturbance of water‑electrolyte metabolism during the early period of heat acclimatization and disturbance of thermal regulation as well as water‑electrolyte metabolism decreased progressively during the late period of heat acclimatization.
INTRODUCTION
Unacclimatized individuals are limited in the amount of task they can perform when exposed to a heat stress (Robinson et al., 1 943). They are characterized with marked cardiovascular strain and a marked rise in body temperature when compared with acclimatized men (Taylor et al., 1943 ; Piwonka et al., 1965). However, certain adaptive changes occur as they acclimatized to work in hot environment. A marked lessening of cardiovascular strain as indicated by a small increase in heart rate and 10wer rise in core temperature due to an earlier onset and increased capacity of their sweating response were observed after successive exposure to a combination of hard work and environmental heat (Ladell, 1951 ; Lind and Bass, 1963 ; Piwonka et al., l 967) . These adaptive changes in physiological responses to heat gradually disappear
over several weeks after the cessession of heat exposure (Williams et al., 1 967).
Department of Physiology, Hyogo College of Medicine, Nishinomiya, Japan.
1 06
Large metabolic heat of the subjects produced in the body must be dissipated into the environment by evaporation of sweat even in cold and warm environment when they take exercise (Robinson, 1963 ; Piwonka et al., 1967). Therefore, the adaptive changes in the physiological responses to heat exposure may be facilitated by exercise. Wyndham and William ( 1 967) have used a rise in rectal temperature of the subject as an index of heat tolerance. Kuno ( 1956) suggested that the chloride concentration in sweat could be used as a reliable indication of degrees ofadaptability, or tolerability of the subject to hot weather. Ohara (1967) used his sweating types classified according to the local sweat rate and salt concentration as indicators of relative evaluation of heat tolerance among individuals as well as populations.
Sweating response is associated with a rise in body temperature when the subjects are exposed to a hot environment and remarkable variations in sweating responses are shown in relationship to a rise in rectal temperature. It should be emphasized that both sweating response and increase in body temperature should be taken into consideration to assess the heat tolerance.
It is well known that heat disorders may be classified into three categories according to their causes, that is water‑depletion heat exhaustion, salt‑depletion heat exhaustion and heatstroke caused by a marked rise in core temperature (Leithead and Lind, 1964). However, heat disorders result from a combination of water loss, salt loss and a rise in core temperature. Recently we proposed a simple and reliable heat tolerance index involving these three factors (Hori et al., 1 974) .
To assess the heat tolerance of the subject, we express physiological strain induced in the body by the combination of relative water loss, relative salt loss and relative increase in rectal ternperature using the critical values of these three factors. The concept we have developed with regard to heat tolerance index appears to provide a reasonal basis for studying the change in heat tolerance of the individual induced by heat acclimatization (Hori et al., 1975). In the present paper, we attempted to study adaptative changes in physiological responses to heat and heat tolerance of unacclimatized individuals induced by daily exposure to a moderate work and environmental heat.
MATERIALS AND METHODS
Eight unacclimatized male subjects, ages 1 9 to 2 1 , were exposed to heat every afternoon for 1 5 successive days in autumn. Sweat test was done on the first, 5th, l Oth and 1 5th days. On the other days, subjects clad in shorts performed muscular
exercise on a bicycle ergometer at constant work load of 600 kg'm/min at the cycling rate of 50 rpm for 60 min in the climatic chamber of 30 C with 700/0 relative humidity. Sweat test was performed as follows.
The subjects, clad only in shorts, sat for 30 min in an air‑conditioned room of 30 C dry‑bulb temperature with 700/0 relative humidity. The subjects, sitting in a chair, then dipped their legs to just below the knees into a stirred water bath of 42 C in the climatic chamber maintained at 30 C with 700/0 relative humidity and stayed for 90 min in the climatic chamber.
Body weight was measured with an accuracy of 5 g before and after experiment
and the net body weight was obtained by subtracting the weight of the dry and wet shorts before and after each experiment. Local sweat rates and sweat electrolyte concentrations of the chest and the back were determined by the filter paper method.
After the skin areas for sampling were washed with distilled water, the area of the skin covering 12.6 cm2 was covered with a sweat capsule by using collodion solution.
Sweat was absorbed by a prewashed filter paper at 15 min intervals during the two hour heat exposure. Sweat volume was determined by weight difference of dry filter paper from that after absorption ofsweat.
To estimate the concentrations of electrolytes in sweat the fllter paper was diluted with distilled water and the sodium concentration in the sweat was determined by flame photometry. The sodium concentration was used to calculate the salt loss in sweat. Heart rates were obtained from the electrocardiogram. To assess physio‑
logical strain induced in the body, we express strain by the combination of relative rise of rectal temperature, relative water loss, and relative salt loss, using the critical values of these three factors as those which cause heatstroke (40.6 C), water depletion heat exhaustion (70/0 of body weight), and salt depletion heat exhaustion (0.75 g per kg of body weight) . The heat tolerance indices I and S were calculated as
follows :
Heat tolerance index I=VA2+B2+C2
Heat tolerance index S (effectiveness of sweating) = ‑ ‑B
VA2+C2
A= 0.07 x W ' B= 40.6‑ Ti ' 0.75 x W C
Where : W=Body weight before the experiment (kg) AW=Weight loss at the end of the experiment (kg)
Ti=Rectal temperature before the experiment (C)
A T=Rise in rectal temperature at the end of the experiment (C) Q=0.058 x AWx C (g)
=0.5x CciVci CbiVbi Vci Vbi +
Vci, Vbi=10cal sweat rates at each 15 min period from the chest and back respectively
Cci, Cbi=sodium concentrations in sweat samples from the chest and back respectively (mEq/L)
Weight loss through respiratory passages was so small when compared with that of weight loss that we used net body weight loss as the volume of sweat loss.
RESULTS
The physical characteristics of subjects are given in Table I . Changes in body weight loss, rise in rectal temperature, mean sodium concentration in sweat, salt loss and increase in heart rate during acclimatization to heat are shown in Table 2.
Evidence of progressive acclimatization throughout 1 5 successive days of heat ex‑
1 08
Table l Characteristics of subjects
Max Min Mean
S. D.
Age
(yr) 2 1 .O 1 9.0
19.5 0.645
Height (cm)
l 74.2 162.0 168.5 5.4
B. W.
(kg) 69.5 52.6
61 .4 4.2
B S. A.
(m2)
l .82 l .56 l .72 0.1 l
Rohrer's index
l 48.6
99.8 128.5
l 4. l
B. W.: Body weight, B. S. A.: Body surface area, S. D. Standard deviations
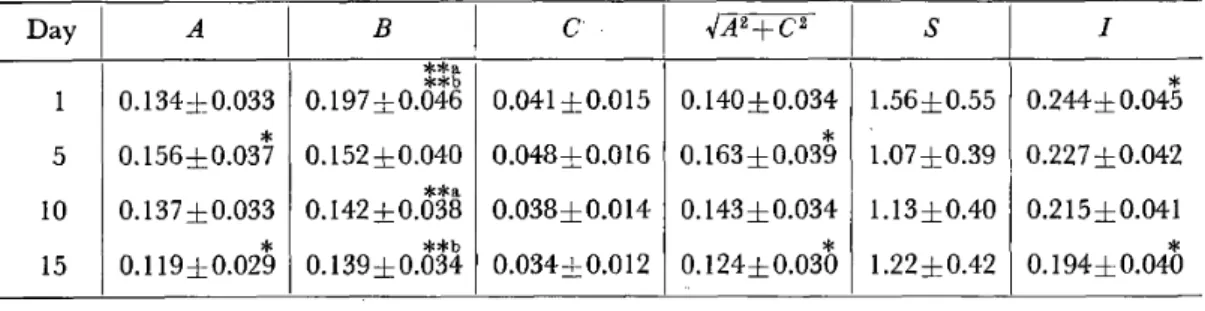
Table 2 Changes in body weight loss, rise in rectal temperature, mean sodium con‑
centration, salt loss and increase in heart rate during acclimatization to heat
Day
l
5 10 15
AW (kg) 0.58 O. 1 3 0.68 O. I
0.60 0.13
0.52 O. I
AT (C)
** **b
0.65 O. 1 5 0.50 O. 1 3 0.47 O. 1 2 ***
0.46 O. 1 1 **b
(*ECq/L)
54.8 15.2 55.3 16.0 54.7 1 3. l 51.3 I I .2
Salt loss (g)
1 ,90 0,82 2.23 I .Ol 1 ,q. 0 0.84 l .58 0,75
A P ( /min)
**b ***
15.4 4.5 12.6 4.8
l I .0 3.5 **
l0.8 3.8 **b A W:
*a, *b
Body weight loss, A T: Rise in rectal temperature, tration in sweat, dP: Increase in heart rate.
Mean values are given with their standard deviations.
Significant difference between days of experiment
* at 50/0 Ievel
** at 20/0 Ievel
C: Mean sodium concen‑
posure was indicated by continuous decrease in rise of rectal temperature and increase in heart rate when subjects were exposed to a hot environment. The mean values of rise in rectal temperature and increase in heart rate decreased markedly during the first 5 days of heat acclimatization, followed by a more gradual decrease by the last day of heat exposure. The mean values of rise in rectal temperature and increase in heart rate were significantly higher on the first day than on the lOth day and the 15th day at 20/0 Ievel. Body weight loss and salt loss increased considerably on the 5th day, followed by a decrease thereafter and the mean value of body weight loss was significantly greater on the 5th day than on the 1 5th day. Changes in sodium concentration in sweat were slight during heat acclimatization. However, mean sodium concentration in sweat showed a trend to be lower during heat acclimatization.
Correlations between rise in rectal temperature, increase in heart rate and sweat rate during heat acclimatization were shown in Figure I . Rise in rectal temperature and increase in heart rate decreased progressively after the first day of heat exposure.
However, changes in rise of rectal temperature and increase of heart rate against sweat rate from the first day to the 5th day differed markedly from those from the 5th day through the 15th day. During the first 5 days of heat acclimatization the ratios of rise in rectal temperature and increase in heart rate to sweat rate decreased and these ratios remained unchanged or increased slightly thereafter.
('O AT
0.8
0.6
04
0.2
, ,
l , t
t =1S t =14
p=32 p=28 t =1.2
f"' "(/ p=24 1 ¥ ' t =1.0
¥ I /P=20 . L¥ '̲ V
l¥ (
1 i t t ' / 5 1 t =0.8 .‑‑‑‑' f n ' // /i p=16
J;l¥
1 ..1v L
1
1 5(r ' 1 O '/ 5 t =06
p=1 2
( /min.) AP
15
10
5
04 0.5 OS 07 OS AW(kg)
Figure I Correlations between rise in rectal temperature, increase in heart rate and sweat rate during heat acclimatization.
A T: Rise in rectal temperature AP: Increase in heart rate A 4/: Body weight loss
AT
t: AW
P: d P
O: Correlation between d T and A W AW
(**) : Correlation between AP and d W
Circles : Drawn around the means with radiusses of standard errors Figures in circles : Days of' experiment arrows indicate direction of
changes induced by heat acclimatization.
Changes in heat tolerance indices and their components during acclimatization to heat were shown in Table 3. The mean values of heat tolerance index I and component B decreased during heat acclimatization and most of the decrease in them occurred during the first five days. The mean value of component A was signifi‑
cantly greater on the 5th day than on the 1 5th day and mean value of index I was significantly larger on the first day than on the 1 5th day. The mean values of components A, C and J l 2 increased on the 5th day and thereafter decreased gradually to the 1 5th day of heat acclimatization and mean values of component A and A2+C2 were significantly greater on the 5th day than on the 1 5th day. The mean value of index S decreased rapidly during the first five days of heat acclimati‑
zation and increased gradually during the 5th day through the 1 5th day.
The mean values of heat tolerance indices I and S during heat acclimatization