• 検索結果がありません。

1 Onion-like carbon-encapsulated Co, Ni, and Fe magnetic nanoparticles with low cytotoxicity 1

N/A
N/A
Protected

Academic year: 2021

シェア "1 Onion-like carbon-encapsulated Co, Ni, and Fe magnetic nanoparticles with low cytotoxicity 1 "

Copied!
31
0
0

読み込み中.... (全文を見る)

全文

(1)

1 Onion-like carbon-encapsulated Co, Ni, and Fe magnetic nanoparticles with low cytotoxicity 1

synthesized by a pulsed plasma in a liquid 2

Zhypargul Abdullaeva

1

, Emil Omurzak

2

, Chihiro Iwamoto

3

, Hullathy Subban Ganapathy

2

, 3

Saadat Sulaimankulova

4

, Chen Liliang

1

and *Tsutomu Mashimo

5

4

1

Graduate School of Science and Technology, Kumamoto University, 860-8555, Japan 5

2

Priority Organization for Innovation and Excellence, Kumamoto University, 860-8555, Japan 6

3

Material Science Department, Kumamoto University, 860-8555, Japan 7

4

Institute of Chemistry and Chemical Technology, National Academy of Sciences, 720071, 8

Bishkek, Kyrgyzstan 9

5

Shock Wave and Condensed Matter Research Center, Kumamoto University, 860-8555, Japan 10

11

Abstract 12

We synthesized onion-like carbon-encapsulated Co, Ni, and Fe (Co-C, Ni-C, and Fe-C) magnetic 13

nanoparticles with low cytotoxicity using pulsed plasma in a liquid. The pulsed plasma is induced 14

by a low-voltage spark discharge submerged in a dielectric liquid. The face-centered cubic Co and 15

Ni, and body-centered cubic Fe core nanoparticles showed good crystalline structures with an 16

average size between 20 and 30 nm were encapsulated in onion-like carbon coatings with a 17

thickness of 2-10 nm. Vibrating-sample magnetometer measurements revealed the ferromagnetic 18

properties of as-synthesized samples at room temperature (Co-C=360 Oe, Fe-C=380 Oe, and Ni- 19

C=211 Oe). Raman-spectroscopy analysis found onion-like carbon shells composed of well- 20

organized graphitic structures. Thermal gravimetric analysis showed a high 21

___________________

22

*Corresponding author. Tel/Fax: +08052593295. E-mail address: [email protected] 23

u.ac.jp (T. Mashimo)

24

(2)

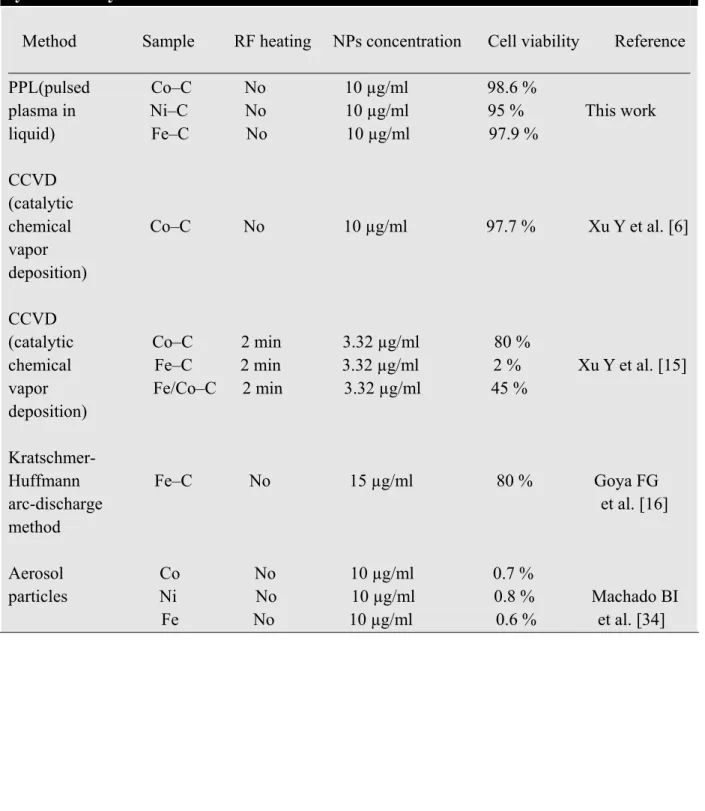
2 stability of the as-synthesized samples under thermal treatment and oxidation. Cytotoxicity 1

measurements showed higher cancer cell viability than samples synthesized by different methods.

2 3

1. Introduction 4

Carbon-encapsulated magnetic metal nanoparticles are of great interest due to their unique 5

properties [1] and wide range of practical and clinical applications [2]. Among the various coating 6

materials for Co, Ni, and Fe metal nanoparticles such as silica, organic substances and polymers, 7

carbon is more stable against oxidation, physical and chemical degradation. Carbon can provide 8

good biocompatibility while protecting from agglomeration [3]. Due to their ability to function at 9

the cellular and molecular levels, magnetic nanoparticles can be functionalized to deliver anti- 10

cancer drugs to human cancer tissues [4, 5]. Cobalt, nickel, and iron nanoparticles encapsulated in 11

carbon shells (Co-C, Ni-C, and Fe-C) are applicable in medicine as localized radio frequency 12

absorbers in cancer therapy [6], bio-engineering applications [7], and drug delivery [8]. They also 13

have physical applications such as magnetic data storage, electromagnetic-wave absorption and 14

ferrofluids [9, 10].

15

One key reason to study the cytotoxic effects of magnetic nanoparticles encapsulated in carbon 16

is that they have great potential to contribute to cancer therapy. Recently, magnetic nanoparticles 17

have played a notable role in magnetic hyperthermia, one of the most promising cancer therapies 18

with minimum side effects. In vivo cancer tissues can be exposed to controllable alternating 19

magnetic fields. When heated to 42-46 °C, cancer tissues become more vulnerable and sensitive to 20

anti-cancer drugs and radiation. However, normal cells can survive at this temperature. After the 21

penetration of magnetic particles, membrane blebbing of the cytoplasm can occur, leading to 22

apoptosis and death of the cancer cell [11-13].

23

Several methods have been used for synthesis of carbon-encapsulated magnetic metal

24

(3)

3 nanoparticles (Me-C), such as chemical vapor deposition (CVD) [14], conventional arc discharge 1

[15], magnetron and ion-beam co-sputtering [16], laser irradiation [17, 18], spray pyrolysis [19]

2

and explosions [20]. However, most of these methods lead to economic disadvantages including 3

the need to maintain high temperatures, high pressures, and vacuum systems as well as use of 4

expensive equipment. Plasma methods are favorable and conducive to large amount synthesis of 5

carbon encapsulated metal nanoparticles with well-defined crystalline structures [21].

6

In our study, we report the synthesis of cobalt, nickel, and iron nanoparticles encapsulated in 7

onion-like carbon shells (Co-C, Ni-C, and Fe-C) using a pulsed plasma in a liquid [22].

8

The aims of our study are to synthesize magnetic nanoparticles with low toxicity and to 9

compare the toxicity of our samples with the toxicity of nanoparticles prepared by aforementioned 10

methods. Although cytotoxic properties of nanoparticles are still in the experimental stage, they 11

have great potential in clinical applications.

12 13

2. Experimental 14

2.1. Synthesis of Co-C, Ni-C, and Fe-C nanoparticles 15

The experimental procedure is described in [22]. Here, we briefly give the process. Figure 1 16

shows the experimental setup of the pulsed plasma in liquid method. Pulsed electrical discharge 17

plasma generated by the low voltage spark discharge driven by the capacitor energy. Electrical 18

current duration between pulsed plasma discharges was equal to 10 microseconds (μs). In order to 19

set the optimal conditions for synthesis of Co-C, Ni-C, and Fe-C nanoparticles, different electrical 20

conditions were performed for each experiment (voltage 150-170V, frequency 60 Hz-30 kHz, 21

current 1.5-3 A).

22

For synthesis of Co-C nanoparticles, we purchased electrodes made of carbon rods doped with 23

9 % Co and 1 % Ni, with a diameter of 6 mm and length of 100 mm, from Toyo Tanso. Ethanol of

24

(4)

4 99.5% purity, purchased from Kanto Chemical Co, was used as dielectric liquid and source of 1

carbon. We applied pulsed plasma with a voltage of 150 V, current of 3 A, frequency of 60 Hz 2

and single discharge duration of 10 μs.

3

For Ni-C nanoparticle synthesis, Ni metallic rod electrodes with a diameter of 5 mm and length 4

of 150 mm, purchased from Rare Metallic Co, were immersed in 200 ml ethanol (99.5% purity).

5

The power source was applied with a frequency of 30 kHz, current of 1.5 A, voltage of 160 V and 6

discharge duration of 10 μs.

7

For Fe-C nanoparticles preparation, metallic Fe rod electrodes 6 mm in diameter and 140 mm 8

in length, purchased from Rare Metallic Co, were submerged in 200 ml ethanol (99.5% purity).

9

Electrical conditions were as follow: frequency 30 kHz, current 1.5 A, voltage 170 V and single 10

discharge duration 10 μs.

11

One of the electrodes was kept vibrating to hold the discharge process stable. After one hour of 12

continuously applying the pulsed plasma discharge, obtained powder samples were separated from 13

ethanol by centrifuge and evaporation. The sample production rate was 3.5-4.5 g/h. Separated 14

samples of Co-C, Ni-C, and Fe-C were treated by 5 M HCl for 12 hours and washed in water to 15

remove the amorphous carbon and uncoated metallic Co, Ni, and Fe nanoparticles. Then, treated 16

and washed samples were dried at 120° C for 2 hours.

17

For synthesis of Co-C, Ni-C, and Fe-C magnetic nanoparticles, we used different types of 18

electrodes (carbon electrode doped with Co and Ni for Co-C synthesis; and pure Ni, and Fe 19

electrodes for Ni-C, and Fe-C synthesis, respectively) to proceed encapsulation of magnetic metal 20

nanoparticles in carbon.

21

Atomic emission spectra of the plasma discharge during the synthesis were collected by an 22

optical spectrometer SEC2000 UV-VIS installed close to the plasma discharge zone outside the

23

(5)

5 quartz beaker. The light coming from outside sources was removed by covering the plasma 1

generation zone with light protective material. Identification of emission spectrum peaks was done 2

according to the NIST

1

database.

3

2.2. Sample characterization 4

High-resolution transmission-electron microscopy (HRTEM) analysis was carried out on a Philips 5

Tecnai F20 S-Twin microscope at 200 keV with a point resolution of 0.18 nm. X-ray diffraction 6

(XRD) patterns of samples were taken on a Rigaku RINT-2500VHF diffractometer using Cu Kα 7

radiation. Raman spectra of the samples were recorded at room temperature on a HORIBA Jobin 8

Yvon HR800 spectrometer, using the argon-ion laser beam as the excitation source at wavelength 9

of 514.53 nm. We measured the magnetic properties of Co, Ni, and Fe encapsulated in onion-like 10

carbon at room temperature by using the Vibrating Sample Magnetometer (VSM), (Riken Denshi, 11

Co., Ltd. Japan). Thermal gravimetric analyses (TGA) were conducted on the TG-DTA6300 12

thermogravimeter, (SEIKO Ins. Co. Japan) by using a stainless steel pan in ambient air with a 13

heating temperature rate of 5°C min

-1

. 14

15

2.3. Cytotoxicity measurements 16

Cytotoxicity of samples was evaluated by using the A549 cell line (Human lung adenocarcinoma 17

epithelial cells) seeded onto 96-well plate one day before measurement. These cells were 18

maintained as monolayer cultures in Dulbecco's modified eagle medium (DMEM) solution 19

supplemented with 10 % Fetal Calf Serum (Gibco BRL, USA) and 1 % concentration of Penicillin 20

and Streptomycin antibiotics (100 X stock, Sigma). The cells were incubated at 37 ºC in a 5 % 21

_________

22

1

NIST Atomic Spectra Database: http://physics.nist.gov/PhysRefData/ASD/lines_form.html

23

(6)

6 CO

2

humidified incubator. Cell viability was measured by (4,5-Dimethylthiazol-2-yl)-2,5- 1

diphenyltetrazolium bromide) MTT and (2,3-bis-(2-methoxy-4-nitro-5-sulfophenyl)-2H- 2

tetrazolium-5-carboxanilide) XTT assay kits purchased from Roche Diagnostics (Japan). Cells 3

were treated with predetermined concentrations of the Co-C, Ni-C, and Fe-C nanoparticles 4

synthesized by a pulsed plasma in a liquid and allowed to grow up for 24 hours. After the 5

treatment completed, the mediums were removed to avoid the interference of nanoparticles and 6

replaced with new mediums containing MTT and XTT. MTT reagent with cells was incubated for 7

4 hours, and XTT reagent for 2 h at 37 °C, 6.5 % CO

2

. Cell viability results were plotted 8

according to optical density values measured at a wavelength of 540 nm using Enzyme-linked 9

immunosorbent assay (ELISA) reader.

10 11

3. Results and discussion 12

3.1. High-resolution transmission-electron microscopy (HRTEM) and energy dispersion X-ray 13

(EDX) analyses 14

Fig. 2 shows a) the HRTEM image of the Co-C nanoparticle, b) the line profile of the image 15

contrast along the line shown in the inset, c) the magnified image of the area drawn in (a), inset is 16

the FFT of the inner Co core, suggesting that the particle is a cobalt single crystal with cubic 17

structure. (d) An EDX pattern of particle shown in (a); e) HRTEM image of the Co-C 18

nanoparticles; f) Diameter distribution chart of the Co-C fitted by a Gaussian curve. A cobalt 19

particle with a size of 20 nm was encapsulated in onion-like carbon shells with a thickness of 20

about 5 nm (Fig. 2a). Diameters of the spherical Co-C particles ranged from 5-50 nm. The 21

interplanar d-spacings of the inner Co core were determined to be 2.04 nm (Fig. 2b), which are in 22

a good agreement with the face-centered cubic (fcc) Co (111) planes. The interlayer distance of 23

the outer onion-like carbon shells found to be 0.32 nm, slightly smaller than the (002) planes of

24

(7)

7 graphitic carbon [23]. This shows that interlayer spacings of the onion-like carbon coatings were 1

reduced by 5.8 % in the Co-C nanoparticles synthesized by pulsed plasma in liquid compared to 2

the 0.34 nm spacings of graphite. The interlayer distance of onion-like carbon shells fluctuated in 3

the range of 0.31-0.4 nm, depending on the synthesis method [24-26]. We analyzed the Co-C 4

nanoparticle using EDX and showed its composition to be Co (55.06%), C (28.79%) and Cu 5

(16.14%). Cu peak is from the TEM grid and C from the onion-like carbon shells. The average 6

diameter of Co particles in Co-C estimated as 8.5 nm, and thickness of graphitic coatings as 3-7 7

nm.

8

Fig. 3 shows a) the HRTEM image of the Ni-C nanoparticle, b) the line profile of the image 9

contrast along the line shown in the inset, c) the magnified image of the area drawn in (a), inset is 10

the FFT of the inner Ni core, showing single crystal nickel particle with cubic structure. (d) An 11

EDX pattern taken from the Ni-C particle shown in (a); e) HRTEM image of the Ni-C 12

nanoparticles; f) Diameter distribution chart of the Ni-C fitted by a Gaussian curve.

13

The size of the Ni core is about 26 nm. It was encapsulated in onion-like carbon with a shell 14

thickness of about 10 nm. We estimated the interplanar d-spacing of the inner Ni core to be 2.04 15

nm, which corresponds to (111) planes of fcc Ni. The interlayer spacings of the outer onion-like 16

graphite shells were estimated to be 0.315 nm, while the graphite had a d-spacing of 0.34 nm.

17

Therefore, this spacing was reduced by 7 % in the Ni-C nanoparticles synthesized by pulsed 18

plasma in liquid. EDX analysis done on a Ni-C particle showed the elemental composition to be 19

Ni (56.53%), C (31.05%) and Cu (12.4 %). A Gaussian fit to the data showed an average diameter 20

of Ni particles in Ni-C to be 15.1 nm with a size distribution in the range 10-100 nm. The 21

thickness of graphitic coatings in the Ni-C measured as 5-10 nm.

22

We found by HRTEM analysis that Fe nanoparticles synthesized by the pulsed plasma in 23

ethanol were encapsulated in onion-like carbon. Fig. 4 shows a) the HRTEM image of the Fe-C

24

(8)

8 nanoparticle, b) the line profile of the image contrast along the line shown in the inset, c) the 1

magnified image of the area drawn in (a), inset is the FFT of the inner Fe core, suggesting that the 2

particle is an iron single crystal with body centered cubic structure. (d) An EDX pattern of particle 3

shown in (a); e) HRTEM image of the Fe-C nanoparticles; f) Diameter distribution chart of the 4

Fe-C fitted by a Gaussian curve. The diameter of the inner Fe core was 35 nm, while the outer 5

onion-like carbon shells consisted of 11 layers with a thickness of about 3.69 nm. The interplanar 6

d-spacings of the inner Fe core found to be 0.205 nm, which are in a good agreement with the 7

(110) planes of body-centered cubic Fe. We calculated the interlayer spacings of the outer onion- 8

like carbon shells to be 0.335 nm, close to the (002) planes of graphitic carbon. EDX analysis of 9

the Fe-C nanoparticle showed its elemental composition to be Fe (54.18 %), C (32.05 %) and Cu 10

(13.76 %). A Gaussian curve fitted to the diameter distribution chart of Fe-C, revealed an average 11

diameter of Fe particles to be 7.9 nm. The thickness of graphitic coatings in the Fe-C measured as 12

3-7 nm.

13 14

3.2. X-ray diffraction (XRD), Atomic emission and Raman spectroscopy analyses 15

Fig. 5 shows the XRD patterns of Ni-C, Co-C, and Fe-C nanoparticles synthesized by a pulsed 16

plasma in a liquid. The diffraction pattern for Ni-C nanoparticles, given in Fig. 5a, shows 17

reflections at 2θ=44.34˚, 51.67˚ and 76.09˚, which are identified as the (111), (200) and (220) 18

planes of fcc Ni, (JCPDS file No 65-0380).

19

The diffraction pattern of the sample, prepared by the pulsed plasma between carbon electrodes 20

doped with Co and Ni (Fig. 5b), displays peaks at 2θ=44.21˚, 51.52˚ and 75.85˚, corresponding to 21

the (111), (200) and (220) planes of fcc Co, (JCPDS file No 15-0806). The broad peak centered at 22

a diffraction angle 26.42˚ corresponds to the hexagonal graphite (002) planes; we suppose that it 23

was appeared because the main content of the electrode used for synthesis of Co-C nanoparticles

24

(9)

9 was carbon, doped with Co and Ni. However, we did not observed Ni peaks, which may be caused 1

by its insignificant amount (1 %) in the electrode.

2

For the Fe-C nanoparticles (Fig. 5c), XRD revealed diffraction peaks at 2θ=44.14˚ and 65.18˚

3

which are characterized by (110) and (200) planes of the bcc Fe, respectively (JCPDS file No 01- 4

1252). Absence of (002) reflection in XRD patterns of the Ni-C, and Fe-C samples caused by 5

using pure metallic Ni, and pure metallic Fe electrodes during the plasma discharge.

6

The width of diffraction peaks allow us to estimate average particle sizes using Scherrer 7

formula [27], which is applicable to particles with single crystal structure:

8

D= 0.93λ / βcosθ (1)

9

Here, D is an average particle size, λ is the wavelength of the applied radiation (CuKα, λ=1.5406 10

Å), β is the broadening of the diffraction peak, and θ is the Bragg angle. According to this formula, 11

average sizes of Co-C, Ni-C, and Fe-C particles were calculated to be 17 nm, 29 nm, and 16 nm, 12

respectively. These values are close to the high resolution TEM results.

13

Atomic emission spectra collected from the plasma discharge zone are given in Fig. 6. From 14

the atomic emission spectrum, we identified peaks of C I, C II, C III, Сo I, II, Ni I, II, and Fe I, II.

15

These active atoms and ions interacted with each other to form Co-C, Ni-C, and Fe-C 16

nanoparticles.

17

In Fig. 7, we illustrate the proposed formation mechanism of Co, Ni, and Fe nanoparticles 18

encapsulated in onion-like carbon by pulsed plasma. Considering the temperature of the plasma 19

discharge zone to be around 2500-3000 K, we assumed that C I atoms, C II and C III ions were 20

evaporated from ethanol. In Co-C nanoparticle formation, carbon ions might be released either 21

from ethanol or carbon electrodes; we observed peaks for C2 radicals in the region of 513-516 nm 22

of emission spectrum [28]. Metal I and II ions evaporated from Ni and Fe metal electrodes and Co 23

atoms evaporated from carbon-doped Co electrodes then undergo ionization to form metal-carbon

24

(10)

10 vapor. C2 radicals generated from ethanol in our experiments formed graphite network, and then 1

onion-like structures due to the catalytic effect of the metal atoms (Co, Ni, and Fe). Segregation of 2

metal and carbon particles occurred in the cooling zone. We conclude that metal particles may act 3

as catalysts in onion-like carbon structure formation and become trapped inside them, forming the 4

Me-C nanoparticles.

5

Fig. 8 presents the Raman spectra for (a) Ni-C, (b) Co-C, and (c) Fe-C nanoparticles 6

synthesized by a pulsed plasma in a liquid. D band associated with the disordered carbon (at 1300- 7

1350 cm

-1

locations) is shifted to 1354 cm

-1

, 1353 cm

-1

, and 1352 cm

-1

in the Raman region for Ni- 8

C, Co-C, and Fe-C nanoparticles, respectively. The G band for Ni-C was detected at 1577 cm

-1

, 9

for Co-C at the 1573 cm

-1

, and at the 1572 cm

-1

for Fe-C nanoparticles, associated with the G band 10

for the onion-like carbons, which has been shifted downward slightly (1569–1577 cm

-1

at various 11

locations) [29].

12

The level of graphitization can be expressed as the intensity ratio of the D-band to G-band 13

(I

D

/I

G

), which in our case is equal to 0.65 for Ni-C, 0.6 for Co-C, and 0.5 for Fe-C nanoparticles.

14

Such intensity ratio values characterize the sp

2

bonded graphitic carbon, and according to the 15

relationship between the crystallite width and the Raman intensity, L

a

=4.4(I

D

/I

G

)

-1

(in nm) [30, 31], 16

onion-like carbon coatings of the Co, Ni, and Fe nanoparticles produced by pulsed plasma have a 17

crystallite size of 2-3 nm. High intensity of the G band shows that the amount of graphitized and 18

well-organized carbon exceeds the amount of amorphous and disordered carbon in our samples, 19

enabling their functionalization and use in medicine.

20 21

3.3 Magnetic properties and Thermal gravimetric (TGA) analyses 22

Magnetic properties of the Co-C, Ni-C, and Fe-C nanoparticles synthesized by pulsed plasma in 23

liquid were measured at room temperature and are shown by magnetization hysteresis loops in Fig.

24

(11)

11 9. The nanoparticles showed high coercivity: Co-C (460 Oe) and Fe-C (480 Oe). The ratio of 1

remanence to saturation magnetization M

r

/M

s

indicated ferromagnetic behaviors of the Co-C 2

(M

r

/M

s

=0.322), Ni-C (M

r

/M

s

=0.151), and Fe-C (M

r

/M

s

=0.335) nanoparticles at the room 3

temperature. The Ni-C showed coercivity of 211 Oe, which is lower than the coercivities of Co-C 4

and Fe-C. This can be explained by the particle size effect. As mentioned in [32, 33], the 5

coercivity and particle size of Ni are inversely proportional. These magnetic data show the 6

suitability of our samples for use as magnetic recording materials, for cancer treatment 7

applications, drug delivery and magnetic resonance imaging (MRI).

8

Thermal gravimetric analysis was meaningful in detection of oxidation resistance and 9

thermal stability of our samples. TGA analyses of the Co, Ni, and Fe nanoparticles encapsulated in 10

onion-like carbon were recorded from room temperature to 900 °C in air. Fig. 10 compares the 11

thermal stability of each sample. Fe-C showed higher stability, with weight loss (60 %) starting 12

from 513 °C. Decomposition of the Ni-C started from 505 °C, and 29 % of the sample remained 13

after about 3 hours at 772 °C. During the heating of the Co-C sample, weight loss was observed 14

from 495 °C, with 27 % remaining after about 3 hours at 767 °C. These results show that the 15

amount of amorphous carbon is insignificant in the samples, which indicates their thermal and 16

medical applications.

17 18

3.4. Cytotoxicity of the Co-C, Ni-C, and Fe-C nanoparticles 19

For cytotoxicity studies, human lung epithelial A549 cells were exposed to Co-C, Ni-C, and Fe-C 20

nanoparticles synthesized by pulsed plasma for 24 h. Suspensions of Co-C, Ni-C, and Fe-C 21

nanoparticles with concentrations of 10, 20, 40, 80 and 160 µg/ml were prepared by serial dilution.

22

Cytotoxic effects were determined by using the MTT and XTT assays. Tetrazolium salts MTT and 23

XTT are especially useful for assaying the quantification of viable cells. Both, MTT and XTT

24

(12)

12 work by being to a formazan dye only by metabolic active cells. MTT assay based on the 1

cleavage of the yellow tetrazolium salt to purple formazan crystals, while the XTT assay based on 2

the cleavage of the yellow tetrazolium salt to orange formazan dye. Fig. 11 shows the cytotoxic 3

effects of the Co, Ni, and Fe nanoparticles encapsulated in onion-like carbon shells synthesized by 4

pulsed plasma in a liquid. MTT assay showed that our samples did not produce significant toxicity 5

up to the concentration of 10 µg/ml. In case of XTT assay, cell viability started to decrease at 6

concentration of 40 µg/ml. As the concentration of nanoparticles increased, cell viability 7

decreased in a concentration-dependent manner. Our samples showed lower toxicity compared to 8

other magnetic nanoparticles synthesized by different methods. Compared results are given in 9

Table 1. Cytotoxic effects of the Co-C nanoparticles synthesized by catalytic chemical vapor 10

deposition (CCVD) on the HeLa cancer cells showed a cell viability of 97.7 % without radio 11

frequency radiation (RF) exposure [6]. Our samples showed higher cell viability results under the 12

same conditions, 98.6 %, 97.9%, and 95 % for the Co-C, Ni-C, and Fe-C nanoparticles, 13

respectively. Cell viability of the Fe-C sample in our work was 8 % higher than that of Fe-C 14

synthesized by the Kratschmer-Huffmann arc discharge method [16]. It was shown that toxicity of 15

the uncoated Co, Ni, and Fe magnetic nanoparticles is very high [34], compared to those 16

encapsulated in carbon. We assumed that lower toxicity of our samples might be induced by well- 17

graphitized carbon coatings. Graphite is a slightly hazardous material and formed during the 18

plasma discharge reaction from ethanol and carbon.

19 20

4. Summary 21

We have described the synthesis of onion-like carbon encapsulated Co, Ni, and Fe nanoparticles 22

by simple and low-energy pulsed plasma in liquid method. HRTEM studies revealed that Co, Ni, 23

and Fe nanoparticles with average crystallite sizes of 17 nm, 29 nm, and 16 nm, respectively, were

24

(13)

13 encapsulated in onion-like carbon shells. XRD analysis of samples showed the fcc-Co, fcc-Ni, and 1

bcc-Fe structure cores. Raman spectroscopy analysis detected the highly ordered graphitic nature 2

of the outer onion-like carbon shells. Co-C, Ni-C, and Fe-C nanoparticles synthesized by pulsed 3

plasma in liquid exhibited high thermal and environmental stabilities. Magnetic measurements 4

revealed high coercivities, indicating ferromagnetic and superparamagnetic properties of the 5

samples at room temperature. Cytotoxicity effects of the Co-C, Ni-C, and Fe-C nanoparticles on 6

cancer cells showed low toxicity, suggesting their in vivo applications in magnetic fluid 7

hyperthermia, magnetic resonance imaging and drug delivery.

8 9

Acknowledgements 10

This research was supported partially by the GCOE Program on the Pulsed Power Science of the 11

Kumamoto University.

12

13

14

15

16

17

18

19

20

21

22

23

24

(14)

14 References

1

[1] Bystrzejewski M, Lange H, Huczko A, Elim HI, Ji W. Study of the optical limiting properties 2

of carbon-encapsulated magnetic nanoparticles. Chem Phys Lett 2007; 444(1–3):113–117.

3

[2] Lu AH, Salabas EL, Schüth F. Magnetic Nanoparticles: Synthesis, Protection, 4

Functionalization, and Application. Angew Chem Int Edit 2007; 46(8):1222–1244.

5

[3] Ma C, Luo B, Song H, Zhi L. Preparation of carbon-encapsulated metal magnetic 6

nanoparticles by an instant pyrolysis method. New Carbon Mater 2010; 25(3):199–204.

7

[4] Sun C, Lee JS, Zhang M. Magnetic nanoparticles in MR imaging and drug delivery. Adv 8

Drug Deliver Rev 2008; 60(11):1252–65.

9

[5] Liong M, Lu J, Kovochich M, Xia T, Ruehm SG. Multifunctional Inorganic Nanoparticles for 10

Imaging, Targeting, and Drug Delivery. ACS Nano 2008; 2(5): 889–896.

11

[6] Xu Y, Mahmood M, Li Z, Dervishi E, Trigwell S, Zharov VP, et al. Cobalt nanoparticles 12

coated with graphitic shells as localized radio frequency absorbers for cancer therapy.

13

Nanotechnology 2008; 19(50): 435102.

14

[7] Li H, Zhao N, He C, Shi C, Du X, J. Li. Fabrication of carbon-coated cobalt nanoparticles by 15

the catalytic method. J Alloy Compd 2008; 458 (1): 130–133.

16

[8] Kim S, Shibata E, Sergienko R, Nakamura T. Purification and separation of carbon 17

nanocapsules as a magnetic carrier for drug delivery systems. Carbon 2008; 46(12): 1523–1529.

18

[9] Yu C, Qui J.S. Preparation and magnetic behavior of carbon-encapsulated cobalt and nickel 19

nanoparticles from starch. Chem Eng Res and Des 2008; 86(8): 904–908.

20

[10] Liu BH, Ding J, Zhong ZY, Dong ZL, White T, Lin JY. Large-scale preparation of carbon- 21

encapsulated cobalt nanoparticles by the catalytic method. Chem Phys Lett 2002; 358(1): 96–102.

22

[11] Gupta AK, Gupta M. Synthesis and surface engineering of iron oxide nanoparticles for 23

biomedical applications. Biomaterials 2005; 26(18): 3995–4021.

24

(15)

15 [12] Veiseh O, Gunn J.W, Zhang M. Design and fabrication of magnetic nanoparticles for

1

targeted drug delivery and imaging. Adv Drug Deliver Rev 2010; 62(3):284–304.

2

[13] Shubayev V.I, Pisanic T.R, Jin S. Magnetic nanoparticles for theragnostics. Adv Drug 3

Deliver Rev 2009; 61(6): 467–477.

4

[14] Xu Y, Mahmood M, Fejleh A, Li Z, Watanabe F, Trigwell S, et al. Carbon-covered magnetic 5

nanomaterials and their application for the thermolysis of cancer cells. Int J Nanomed 2010;

6

2010(5): 167–176.

7

[15] Goya GF, Marcos-Campos I, Fernandez-Pacheco R, Saez B, Godino J, Asın L, et al.

8

Dendritic cell uptake of iron-based magnetic nanoparticles. Cell Biol Int 2008; 32(8): 1001–5.

9

[16] Babonneau D, Naudon A, Cabioc'h T, Lyon O. Morphology of encapsulated iron 10

nanoparticles obtained by co-sputtering and implantation: a GISAXS study. J Appl Crystallogr 11

2000; 33(1): 437–441.

12

[17] Park J.B, Jeong S.H, Jeong M.S, Kim J.Y, Cho B.K. Synthesis of carbon encapsulated 13

magnetic nanoparticles by pulsed laser irradiation of solution. Carbon 2008; 46(11): 1369–1377.

14

[18] Pola J, Urbanova M, Pokorna D, Subrt J, Bakardjieva S, Bezdicka P, et al. IR laser-induced 15

formation of amporphous Co-C films with crystalline Co, Co

2

C and Co

3

C nanograins in a 16

graphitic shell. J Photoch Photobio A 2010; 210(2): 153–161.

17

[19] Wang JN, Zhang L, Yu F, Sheng ZM. Synthesis of carbon encapsulated magnetic 18

nanoparticles with giant coercivity by a spray pyrolysis approach. J Phys Chem B 2007;

19

111(8):2119-2124.

20

[20] Bystrzejewski M, Huczko A, Lange H, Baranovski P, Kaszuwara W, Cudzilo S, et al.

21

Carbon-encapsulated magnetic nanoparticles spontaneously formed by thermolysis route. Fuller 22

Nanotub Carb N 2008; 16(4):217-30.

23

(16)

16 [21] Bystrzejewski M, Karoly Z, Szepvolgyi J, Kaszuwara W, Huczko A, Lange H. Continuous 1

synthesis of carbon-encapsulated magnetic nanoparticles with a minimum production of 2

amorphous carbon. Carbon 2009; 47(8): 2040-2048.

3

[22] Omurzak E, Jasnakunov J, Mairykova N, Abdykerimova A, Maatkasymova A, 4

Sulaimankulova S, et al. Synthesis method of nanomaterials by pulsed plasma in liquid. J Nanosci 5

Nanotechnol 2007; 7(9): 3157–3159.EAR 6

[23] Bacon GE. The interlayer spacing of graphite. Acta Crystallogr 1951; 4(6): 558–561.

7

[24] Lee JY, Cho KH, Lim DP, Lee YB, Lim DS. Effect of attrition milling on dispersion of onion 8

like carbon in aqueous medium. Appl Phys A-Mater 2007; 88(4): 693–697.

9

[25] Gorelik T, Urban S, Falk F, Kaiser U, Glatzel U. Carbon onions produced by laser irradiation 10

of amorphous silicon carbide. Chem Phys Lett 2003; 373(5–6): 642–645.

11

[26] Wang N, Li G.D, Tang ZK, Mono-sized and Single-walled 0.4nm Carbon Nanotubes. Chem 12

Phys Lett 2001; 339(1–2): 47–52.

13

[27] Patterson AL. The Scherrer Formula for X-Ray Particle Size Determination. Phys Rev 1939;

14

56(10): 978–982.

15

[28] Lange H, Sioda M, Huczko A, Zhu Y.Q, Kroto H.W, Walton D.R.M. Nanocarbon production 16

by arc discharge in water. Carbon 2003; 41(8):1617-1623.

17

[29] Roy D, Chhowalla M, Wang H, Sano N, Alexandrou I, Clyne T.W, et al. Characterisation of 18

carbon nano-onions using Raman spectroscopy. Chemical Physics Letters 2003; 373(1-2): 52-56.

19

[30] Baldan MR, Almeida EC, Azevedo AF, Goncalves ES, Rezende MC, Ferreira NG. Raman 20

validity for crystallite size La determination on reticulated vitreous carbon with different 21

graphitization index. Appl Surf Sci 2007; 254(2): 600–603.

22

[31] Zickler GA, Smarsly B, Gierlinger N, Peterlik H, Paris O. A reconsideration of the 23

relationship between the crystallite size L

a

of carbons determined by X-ray diffraction and Raman

24

(17)

17 spectroscopy. Carbon 2006; 44(15): 3239–3246.

1

[32] El-Gendy AA, Ibrahim EMM, Khavrus VO, Krupskaya Y, Hampel S, Leonhardt A, et al.

2

The synthesis of carbon coated Fe, Co and Ni nanoparticles and an examination of their magnetic 3

properties. Carbon 2009; 47(12): 2821–2828.

4

[33] Sunny V, Kumar DS, Yoshida Y, Makarewicz M, Tabis W, Anantharaman MR. Synthesis 5

and properties of highly stable nickel/carbon core/shell nanostructures. Carbon 2010; 48(5):

6

1643–1651.

7

[34] Machado BI, Suro RM, Garza KM, Murr LE. Comparative microstructures and cytotoxicity 8

assays for ballistic aerosols composed of micrometals and nanometals: respiratory health 9

implications. Int J Nanomed 2011; 2011(6): 167–178.

10

11

12

13

14

15

16

17

18

19

20

21

22

23

24

(18)

18 List of captions for tables and figures:

1

Table 1- Cytotoxicity data of the Co-C, Ni-C and Fe-C samples synthesized by pulsed plasma in 2

liquid compared with samples synthesized by other methods.

3

Figure 1-Schematics of the pulsed plasma in a liquid method.

4

Figure 2-(a) HRTEM image of the Co-C nanoparticle; (b) Interplanar spacings plot along the 5

line shown in the inset of the Co core; (c) Magnified image of the area drawn in (a), inset is the 6

FFT of the inner Co core, suggesting that the particle is a cobalt single crystal with cubic 7

structure; (d) An EDX pattern of particle shown in (a), indicating that the particle composed of 8

cobalt, Cu peaks from the TEM grid and C peak from onion-like carbon; (e) HRTEM image of 9

the Co-C nanoparticles; (f) Diameter distribution chart of the Co-C fitted by Gaussian curve.

10

Figure 3-(a) HRTEM image of the Ni-C nanoparticle; (b) interplanar spacings plot along the line 11

shown in the inset of the Ni core; (c) magnified image of the area drawn in (a), inset is the FFT of 12

the inner Ni core, suggesting that the particle is a nickel single crystal with cubic structure; (d) 13

EDX pattern; (e) HRTEM image of the Ni-C nanoparticles; (f) Diameter distribution chart of the 14

Ni-C fitted by Gaussian curve.

15

Figure 4-(a) HRTEM image of the Fe-C nanoparticle; (b) interplanar spacings plot along the line 16

shown in the inset of the Fe core; (c) magnified image of the area drawn in (a); inset is the FFT of 17

the inner Fe core, suggesting that the particle is an iron single crystal with body centered cubic 18

structure; (d) EDX pattern; (e) HRTEM image of the Fe-C nanoparticles; (f) Diameter 19

distribution chart of the Fe-C fitted by Gaussian curve.

20

Figure 5-XRD patterns of the Co-C, Ni-C, and Fe-C nanoparticles synthesized by a pulsed plasma 21

in a liquid.

22

Figure 6-Optical emission spectra of the Co-C, Ni-C, and Fe-C magnetic nanoparticles.

23

Figure 7-Formation mechanism of Co-C, Ni-C, and Fe-C nanoparticles by pulsed plasma in liquid.

24

(19)

19 Figure 8-Raman spectra of the Co-C, Ni-C, and Fe-C magnetic nanoparticles synthesized by 1

pulsed plasma in a liquid.

2

Figure 9-Magnetization curves of the Co-C, Ni-C, and Fe-C magnetic nanoparticles synthesized 3

by pulsed plasma in a liquid.

4

Figure 10-Thermal gravimetric (TGA) analysis of the Co-C, Ni-C, and Fe-C magnetic 5

nanoparticles produced by pulsed plasma in a liquid.

6

Figure 11-Cytotoxicity of the Co-C, Ni-C, and Fe-C magnetic nanoparticles synthesized by a 7

pulsed plasma in a liquid determined by MTT and XTT assays.

8

9

10

11

12

13

14

15

16

17

18

19

20

21

22

23

24

(20)

20 1

2 3 4 5 6 7

Table 1-Comparison of cytotoxic parameters for Co-C, Ni-C, and Fe-C nanoparticles synthesized by different methods.

Method Sample RF heating NPs concentration Cell viability Reference ______________________________________________________________________________

PPL(pulsed Co–C No 10 µg/ml 98.6 %

plasma in Ni–C No 10 µg/ml 95 % This work liquid) Fe–C No 10 µg/ml 97.9 %

CCVD (catalytic

chemical Co–C No 10 µg/ml 97.7 % Xu Y et al. [6]

vapor deposition)

CCVD

(catalytic Co–C 2 min 3.32 µg/ml 80 %

chemical Fe–C 2 min 3.32 µg/ml 2 % Xu Y et al. [15]

vapor Fe/Co–C 2 min 3.32 µg/ml 45 % deposition)

Kratschmer-

Huffmann Fe–C No 15 µg/ml 80 % Goya FG arc-discharge et al. [16]

method Aerosol Co No 10 µg/ml 0.7 %

particles Ni No 10 µg/ml 0.8 % Machado BI

Fe No 10 µg/ml 0.6 % et al. [34]

(21)

21 Figure 1. Abdullaeva et al.

1

Schematics of the pulsed plasma in a liquid method.

2

3

4

5

6

7

8

9

10

11

12

13

14

15

16

17

(22)

22 Figure 2. Abdullaeva et al.

1

(a) HRTEM image of the Co-C nanoparticle; (b) Interplanar spacings plot along the line shown in 2

the inset of the Co core; (c) Magnified image of the area drawn in (a), inset is the FFT of the 3

inner Co core, suggesting that the particle is a cobalt single crystal with face centered cubic 4

structure; (d) An EDX pattern of particle shown in (a), indicating that the particle composed of 5

cobalt, Cu peaks from the TEM grid and C peak from onion-like carbon; e) HRTEM image of the 6

Co-C nanoparticles; f) Diameter distribution chart of the Co-C fitted by Gaussian curve.

7

8

9

10

11

12

13

(23)

23 Figure 3. Abdullaeva et al.

1

(a) HRTEM image of the Ni-C nanoparticle; (b) Interplanar spacings plot along the line shown in 2

the inset of the Ni core; (c) Magnified image of the area drawn in (a), inset is the FFT of the inner 3

Ni core, suggesting that the particle is a nickel single crystal with face centered cubic structure;

4

(d) An EDX pattern of particle shown in (a), indicating that the particle composed of nickel, Cu 5

peaks from the TEM grid and C peak from onion-like carbon; e) HRTEM image of the Ni-C 6

nanoparticles; f) Diameter distribution chart of the Ni-C fitted by Gaussian curve.

7

8

9

10

11

12

13

(24)

24 Figure 4. Abdullaeva et al.

1

(a) HRTEM image of the Fe-C nanoparticle; (b) Interplanar spacings plot along the line shown in 2

the inset of the Fe core; (c) Magnified image of the area drawn in (a), inset is the FFT of the inner 3

Fe core, suggesting that the particle is an iron single crystal with body centered cubic structure;

4

(d) An EDX pattern of particle shown in (a), indicating that the particle composed of iron, Cu 5

peaks from the TEM grid and C peak from onion-like carbon; e) HRTEM image of the Fe-C 6

nanoparticles; f) Diameter distribution chart of the Fe-C fitted by Gaussian curve.

7

8

9

10

11

12

13

(25)

25 Figure 5. Abdullaeva et al.

1

XRD patterns of the Co-C, Ni-C, and Fe-C nanoparticles synthesized by a pulsed plasma in a 2

liquid.

3

4

5

6

7

8

9

10

11

12

13

14

15

16

17

(26)

26 Figure 6. Abdullaeva et al.

1

Optical emission spectra of the Co-C, Ni-C, and Fe-C magnetic nanoparticles synthesized by a 2

pulsed plasma in a liquid method.

3

4

5

6

7

(27)

27 Figure 7. Abdullaeva et al.

1

Formation mechanism of Co-C, Ni-C, and Fe-C nanoparticles by a pulsed plasma in a liquid.

2

3

4

5

6

7

8

9

10

11

12

13

14

15

(28)

28 Figure 8. Abdullaeva et al.

1

Raman spectra of the Co-C, Ni-C, and Fe-C magnetic nanoparticles synthesized by a pulsed 2

plasma in a liquid.

3

4

5

6

7

8

9

10

11

12

13

14

15

16

17

(29)

29 Figure 9. Abdullaeva et al.

1

Magnetization curves of the Co-C, Ni-C, and Fe-C magnetic nanoparticles synthesized by a 2

pulsed plasma in a liquid.

3

4

5

6

7

8

9

10

11

12

13

14

15

16

17

(30)

30 Figure 10. Abdullaeva et al.

1

Thermal gravimetric (TGA) analysis of the Co-C, Ni-C, and Fe-C magnetic nanoparticles 2

produced by a pulsed plasma in a liquid.

3

4

5

6

7

8

9

10

11

12

13

14

15

16

17

(31)

31 Figure 11. Abdullaeva et al.

1

Cytotoxicity of the Co-C, Ni-C, and Fe-C magnetic nanoparticles synthesized by a pulsed plasma 2

in a liquid determined by MTT and XTT assays.

3

4

5

6

7

8

9

10

Figure 9-Magnetization curves of the Co-C, Ni-C, and Fe-C magnetic nanoparticles synthesized 3
Table 1-Comparison of cytotoxic parameters for Co-C, Ni-C, and Fe-C nanoparticles  synthesized by different methods

参照

関連したドキュメント

For a better understanding of the switching dynamics of the Fermi-acceleration oscillator, a parameter map for periodic motions and chaos should be developed from the

(4) Roughly speaking, the C 1 smooth submanifolds M are expected to produce much larger tangencies (with respect to D) than those produced by C 2 smooth submanifolds.. Analogously,

In fact, the only points on H 1 (C) with two preimages on C are the two critical points of the mating. Finally, note that per our construction all deformations of C by H can

In this study, the fully developed, steady, laminar flow of blood is studied in a long pipe with square and circular cross-sections subjected to a magnetic field generated by

If, moreover, a and b are coprime and c is suffi- ciently large compared with a and b, then (1) has at most one solution. Diophantine equations, applications of linear forms in

By con- structing a single cone P in the product space C[0, 1] × C[0, 1] and applying fixed point theorem in cones, we establish the existence of positive solutions for a system

We find the criteria for the solvability of the operator equation AX − XB = C, where A, B , and C are unbounded operators, and use the result to show existence and regularity

The main purpose of this paper is to establish new inequalities like those given in Theorems A, B and C, but now for the classes of m-convex functions (Section 2) and (α,