INTRODUCTION
The performance and health of cows are direct- ly affected by their feed intake. Cow manage- ment in a free-stall barn is generally based on the free access to total mixed ration (TMR)on a flat type trough. The amount of offering and quality of TMR is controlled by the manager. There has been some research concerning the effect of feed- ing space per cow and the design of feeding barriers on the eating and social behavior of cows. At a high stocking density, competition limits the ability of some cows to gain access to the trough (DeVires et al. 2004), and increased competition at the trough affected the eating behavior of cows (Friend et al. 1977; Grant &
Albright 2001; Olofsson 1999). Morita et al.
(2002) noted that the average meal length in narrow feeding spaces (0.3 m/ cow) was shorter than that in the standard space(0.6 m/ cow). The design of feeding barriers (headlock or post-and- rail type) also affected the social interaction at eating between cows (Huzzy et al.2006). Endres et al. (2005)also reported that headlock barriers reduced the frequency of aggressive interactions at the trough in standard spaces.
The feeding space per cow is the horizontal space direction for cows,and this is important for barn design and the maximum number of rearing cows (the density of cows). The dimension of forward direction of eating cows was listed by Zappavigna (1983)and it was about 1.0 m. When a cow eats TMR, cows push, pull and toss the ration (DeVires et al. 2003;Shimada et al. 2007).
The form of the ration was changed by these activities and the ration move out of reach of the
cows. In a free-stall barn,cowʼ s eating has to be guaranteed every time. Thus, enough TMR has to be in the area so that the cow can reach it.
The Bunk Score (Hoffman 2007)is the one of the parameters for evaluation of feeding manage-
ment in free-stall barns.
The movement of ration and
/or the change of ration form were viewed in a free-stall barn.
However there were not any reports concerning a quantitative analysis of the movement of ration.
Shimada et al. (2007; 2008) reported that the farthest end of ration form was related to the frequency of tossing behavior of cows. “Pushing up”is the operation for pushing TMR near the cowʼ s side between ration offering time. By suitable pushing up of the ration, the cow is able to access the ration, continuously, and the man- ager can work less hard. There is limited research about the change of ration form with eating behavior and with time after offering rations. The objective of this study was to deter- mine the change of ration form during cow eating in a free-stall barn.
MATERIALS AND METHODS
A device for measuring the height of ration without contact was used for the examination of the change of ration form on the trough in a free-stall barn. The device (JTF-FS12, Japan Application Craft of Machine.co.,LTD,Sapporo, Japan) had an arm (2.1 m) with 15 laser sensors and a data recorder (Morita et al. 2008). The height of the arm was fixed according to the height of the residual ration. The device mea- sured and recorded the distances between the arm and ration in 10 cm intervals.
J. Rakuno Gakuen Univ.,34(1):7
Department of Dairy Science, Rakuno Gakuen University, Ebetsu, Hokkaido, Japan 酪農学園大学酪農学部酪農学科(江別市文京台緑町 582)
The changes of the height of the residual ration on trough in free-stall barn
Shigeru M ORITA , Junpei K ONDO and Shinji H OSHIBA
(Accepted 23 July 2009)
Twenty cows (average parity 3.2,average days after calving 148 days, average milk yield 34.7 kg/ day) were kept in a free-stall barn with an automatic milking system. The trough was a flat-type and the height of the trough bottom was 8 cm. The barrier of feeding space was a self-
locking stanchion type.
The cows were offered a TMR (42.9 DM%, CP
=13.2%,NDF=46.0% on DM basis)once dailyat 10.30 hour. Pushing up operation was done 5 times daily at 11.30 hour, 13.30 hour, 15.30 hour,
17.30 hour and 05.30 hour. From 17.30 hour to 05.
30 hour on the next day,the height of the residual ration was measured at 10 cm intervals from the trough wall to 140 cm away(15 points)in parallel lines at 2 m intervals (6 lines)on the trough.
RESULTS AND DISCUSSION
The change of the average height of the resid- ual ration within a 140cm distance from trough wall with time after the pushing up operation is shown in Figure 1. At the start of the experi- ment, just after the pushing up operation, the average height was 5.1 cm, and at the end of the experiment, 720 minutes after the operation, it was 1.8 cm. The average ration height linearly decreased with time after the operation (P
<0.05).The regression coefficient showed the hourly
decrement was 0.3 cm on average. Morita et al.
(2008)examined the change of shape of the resid- ual ration in 4-hour periods. From their results, hourly decrement was 0.6 cm on average. They examined from 13.00 hour to 17.00 hour, in this period, cow ate longer time in this period than that in present study (from 17.30 hour to 05.30 hour).
The heights of the residual ration in the trough at each measurement position at start (17.30 hour) and end (05.30 hour)of the experiment is shown in Table 1. The ration heights at the measurement position from zero to 30 cm (P<0.01) and 50 cm (P<0.05) were significantly lower at the end of the experiment (720 minutes after the pushing up operation) than that at the start of experiment
Figure 1
Change of the average height of ration with time after pushing up operation
Table 1
The comparison of the height of residual ration on trough between the start (17.30)and the end (05.30)of experiment
Height of ration (cm) Distance from
trough wall (cm)
Start of experiment End of experiment Difference (cm)
17.30 05.30 End
−Start
0 20.2
±7.6 2.5
±2.2
−17.7 P
<0.01 10 19.4
±8.0 0.9
±1.0
−18.5 P<0.0120 18.1
±9.0 2.2
±1.5
−15.9 P<0.0130 11.1
±6.5 1.4
±1.6
−9.7 P<0.01
40 4.9
±5.6 0.1
±0.2
−4.8 NS
50 2.7
±2.5 0.2
±0.6
−2.5 P<0.05
60 0.8
±0.9 1.7
±1.9 0.9 NS
70 0.4
±0.7 1.9
±1.4 1.5 NS
80 0.4
±0.7 1.0
±0.9 0.6 NS
90 0.7
±0.6 6.9
±3.1 6.2 P<0.01
100 0.6
±0.9 6.1
±2.6 5.5 P
<0.01
110 0.1
±0.1 0.8
±1.4 0.7 NS
120 0.4
±0.9 1.0
±0.4 0.6 NS
130 0.2
±0.4 0.4
±0.3 0.2 NS
140 0.2
±0.3 0.3
±0.8 0.1 NS
(just after the pushing up operation). From zero to 20 cm distance position, the differences in the ration height were over 15 cm,and the maximum difference was 18.5 cm at the 10 cm distance position. At the 90 and 100 cm distance position from trough wall,the differences in ration height between the start and the end of the experiment were about 6 cm. In the both positions, the ration height was significantly(P<0.05)higher at the end of experiment than that at the start of experiment.
Morita et al. (2008) reported that changes in ration height differed with the distance position from the trough wall in 4-hour periods between pushing up operations. The results in the present study also showed differences in the change of ration shape in 12-hour period. From night to early morning (12 hours),there was no pushing up operation in present study. In order to maintain the free access to the ration, pushing up operation(s)should be done by the manager.
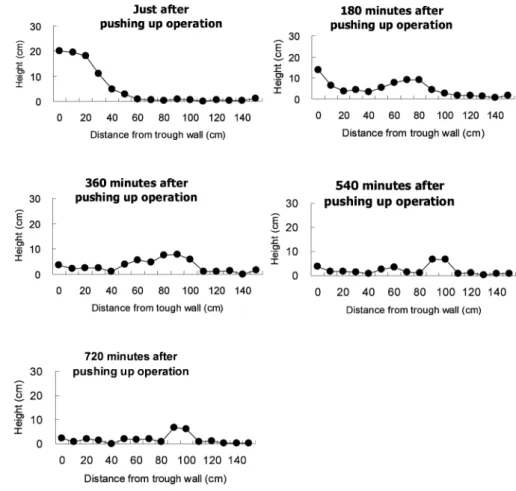
The heights of residual ration in 10 cm interval on trough were shown in Figure 2. These were cross-sections of the ration on trough in each time after pushing up operation, and it was easy to understand the change of the shape of the ration.
Just after pushing up operation, before cowʼ s eating, there were the higher positions in near trough wall,and over 60 cm position,there was no ration, so height was almost zero cm. This shape of the ration was made by managerʼ s push-
ing up operation.
At 180 minutes after the operation, there were two peaks of the ration on trough. One peak was in zero cm, and the other was around 70
‑80 cmdistance from trough wall. More 180 minutes passed, at 360 minutes after the operation;there was a peak in 80
‑90 cm distance from trough wall. At 540 minutes after the operation (at 01.30 hour in the midnight), the number of the peak of ration was one,and the position of peak was 90
‑100 cm distance. In the distances less than 80 cm
THE CHANGES OF THE HEIGHT OF THE RATION
Figure 2
The height of residual ration in 10 cm interval on trough in free-stall barn in 0, 180, 360, 540 and 720 minutes after pushing up operation
position,the height of ration was almost zero cm.
It was indicated that cow had eaten almost all ration nearer than 80 cm distance from trough wall. For keeping the free access to ration, the pushing up operation had to do before 01.30 hour
(540 minutes after).
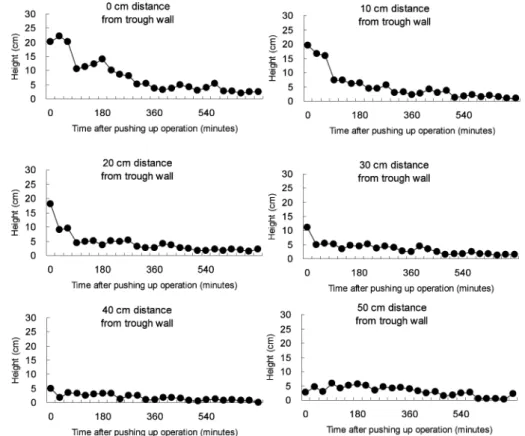
The changes of the height of ration at the position from zero to 110 cm distance from trough wall with time after pushing up operation were shown in Figure 3 and 4. The changes were categorized as the four patterns. First type of change was at the position from 0
‑20 cm dis-
tance. In this type,the height of the ration rapid- ly decreased in the initial 2 hours and slowly decreased after this period. Around 480 or 540 minutes (8 or 9 hours)after the pushing up,there was almost no ration in the position of this area.
At 40 and 50 cm distance position, the change of the height of ration was less during the experi- mental period. At these positions,the decrement by intake and flow-out, and increment of ration by flow-in were balanced.
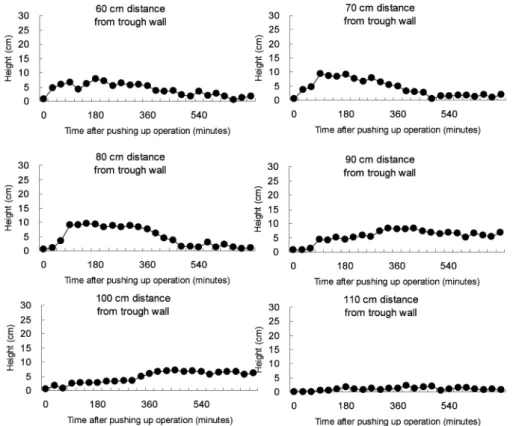
At the position 70 and 80 cm distance,there was
two phase in the experimental period. Firstly, the height of the ration was rapidly increased within 2 hours after the operation. Secondary, the height of ration was slowly decreased with the time after the operation. As described before,at the position of 90 and 100 cm distance,the ration was still in the end of experiment periods. Cow pushed the ration out to their reach area by their eating activity, and the ration was cumulated in the position of 90 and 100 cm. The two periods of the increments of the height of ration were around at 2 hours and 5 hours after the operation.
It was understood empirically that the pushing up operation by manager in free-stall barn contained two means:one was to reposition the residual ration to reach-area of cowʼ s eating for guarantee the continuous access to ration, and another was stimulus to increase eating activity of cows. There was the limitation about the timing and frequency of the pushing up operation from labor problems of manager. DeVries et al.
(2003) examined the effect of the pushing up operation on diurnal eating pattern of cows, and
Figure 3
The changes of the height of ration at the position from the zero to 50 cm distance with the time after pushing up operation
concluded that the addition of pushing up opera- tions in early morning did little to increase eating activity of cows, and the milking and delivery of fresh ration had much greater affect on eating pattern of cows than did the pushing up opera- tions. The suitable timing of the pushing up operations for manager and cow was judged on the residual amount of ration within reach-area of cowʼ s eating.
The edge of cowʼ s reach for eating activity was estimated 90 cm in the present study conditions.
This distance was similar to the data listed by Zappavigna (1983). Within 1.5 hours after the pushing up operation,the amount of ration rapid- ly decreased in the positions within 20 cm on the trough, and the ration was cumulated in the position of 70 and 80 cm distance. There was no residual ration in the far area of cowʼ s reach (over 90 cm position). So,it was not necessary to push the residual ration up in this period.
At two hours after the operation,deposition of the ration at the 90 and 100 cm distance positions where were out of cowʼ s reach was started, and
around at 4 hours after the operation, the height of residual ration in these positions increased again. At around 4 hour after the operation, in the position within 20 cm, the height of ration slowly decreased, but still there was ration. At this time,there was much ration in the position of 70 and 80 cm distance. At 8 hours (480 minutes) after, the ration in the position of 70 and 80 cm was disappeared, and the ration was only in 90 and 100 cm positions where were out of cowʼ s reach.
So in the present condition, manager had to move the residual ration in cowʼ s reach area before 8 hours later (01.30 hour in midnight) for guarantee the free access to the residual ration.
However,the operation at the midnight was hard for manager. At the time of 4 hours after the operation, deposition of the ration out of their reach area started again, and finished 2 hours later. In this period, fewer ration in approxi- mate area (within 30 cm)and much ration in the position from 60 to 80 cm distance. Cow needed more effort, for example lengthened their neck
Figure 4
The changes of the height of ration at the position from the 60 to 110 cm distance with the time after pushing up operation
THE CHANGES OF THE HEIGHT OF THE RATION
and
/or their tongue,for eating the residual ration in around 80 cm than that in approximate area.
In consideration for cowʼ s and managerʼ s well- ness, it was recommended that the pushing up operation should be done from 21.30 hour to 23.30 hour, it was from 4 to 6 hours after the evening operation.
REFERENCES
DeVires TJ, von Keyserlinkg MAG, Beauchemin KA.2003.Diurnal feeding pattern of lactating dairy cows. Journal of Dairy Science 86,
4079‑ 4082.
DeVires TJ, von Keyserlinkg MAG, Weary DM.
2004.Effect of feeding space on the inter-cow distance, aggression,and feeding behavior of free-stall housed lactationg dairy cows.Jour-
nal of Dairy Science 87, 1432
‑1438.
Endres MI, DeVires TJ, von Keyserlinkg MAG, Weary DM. 2005. Effect of feed barrier design on the behavior of loose-housed lactat-
ing dairy cows. Journal of Dairy Science 88, 2377
‑2380.
Friend TH,Polan CE,McGilliard ML.1977.Free stall and feed bunk requirements relative to behavior, production, and individual feed intake in dairy cows. Journal of Dairy Sci-
ence 60, 108
‑118.
Grant RJ, Albright JL. 2001. Effect of animal grouping on feeding behavior and intake of dairy cattle. Journal of Dairy Science 84(E.
Suppl.), E156
‑E163.
Hoffman PC. 2007. Feed efficiency in heifer management. International Dairy Topics 6,
7
‑9.
Huzzy JM, DeVries TJ, Valois P, von Keyserlin- kg MAG. 2006. Stocking density and feeding barrier design affect the feeding and social behavior of dairy cattle. Journal of Dairy Science 89, 126
‑133.
Morita S, Shimada T, Matsuoka Y, Hoshiba S.
2008. The change of the height of ration on trough using a measuring device of the undu-
lation of ration offered in free-stall barn.
Animal Behaviour and Management 44,220
‑227.
Morita S, Sugita S, Kobari T, Hoshiba S. 2002.
Effect of feeding space allowance for cows on meal length in free-stall barn. Journal of Rakuno Gakuen University 26, 271
‑276.
Olofsson J. 1999. Competition for total mixed diets fed for ad libitum intake using one or four cows per feeding station. Journal of Dairy Science 82, 69‑ 79.
Shimada T, Morita S, Matsuoka Y, Akita A, Hoshiba S. 2008. Diurnal changes of mixed ration form with eating activity of cows in free stall barn. Journal of Rakuno Gakuen University 32, 155
‑160.
Shimada T, Morita S, Hoshiba S. 2007. Changes of mixed ration form with the eating activity of cows. Journal of Rakuno Gakuen Univer-
sity 32, 1
‑6.
Zappavigna P.1983.Space and equipment require- ments for feeding in cattle housing. In:Bax- ter SH,Baxter MR,MacCormack JAC (eds), Farm animal housing and welfare, pp.155
‑163.Martinus Nijhoff Publishers,The Hague.
ABSTRACT
Enough rations have to be in the area the cows can reach. The objective of this study was to determine the change of ration form during cow eating in a free-stall barn. Twenty cows were kept in a free-stall barn. The cows were offered total mixed ration once daily at 10.30. From 17.30 to 05.30 on the next day, the height of the residual ration was measured at 10 cm intervals from the trough wall to 140 cm away(15 points),every 30 minutes. At 180 minutes after the start of experiment,there were two peaks of the ration on the trough. One peak was in 0 cm, and the other was around 70
‑80 cm distance from trough wall.
More 180 minutes passed, there was one peak in 90 cm distance. At 540 minutes after the start of the
experiment (at 01.30 in the midnight),there was one peak of the ration and the position of peak was 90-100
cm distance. The cows had eaten almost all rations nearer the 80 cm distance from trough wall. For
keeping the free access to ration, the pushing up operation had to be done before 01.30 (540 minutes after).
Key words: Cow, height of ration, pushing up operation
要 約
フリーストール牛舎では,乳牛の採食可能範囲内 に十分な飼料を存在させなければならない。本試験 では,残存飼料の形状変化を起伏測定装置を用い飼 槽壁からの位置ごとに検討した。調査時の乳牛飼養 頭数は 20頭であった。混合飼料を1日1回給与し た。飼槽壁から 10cm間隔で 140cm位置までの飼 料高を,2mおきに 6ヵ所にて測定した。調査の開始 時刻は 17:30であり,調査開始時に餌寄せ作業を 行った。調査開始以降 30分間隔で,翌朝 5:30まで 測定を実施した。調査開始 180分後には,残存飼料 に2つのピークが認められた。1つは飼槽壁付近で あり,もう1つのピークは飼槽壁から 70〜80cmの
位置にあった。さらに 180分が経過した試験開始後 360分では,ピークは1つとなり,その位置は 90cm であった。試験開始から 540分後(深夜 1:30)の飼 料形状でのピークは1つであったが,その位置は 90〜100cmとやや外側に移動した。この時,80cm 位置までに,飼料はほとんど存在しなかった。また 飼槽壁から 90〜100
cm
位置における飼料高は,こ れ以降,ほぼ一定となった。これは,この位置を乳 牛が採食できない(採食可能範囲外である)ことを 示している。以上のことから,フリーストール牛舎 で飼養された乳牛の自由採食を確保するためには,本試験の条件下であれば,540分経過以前の餌寄せ 作業が必要である。
THE CHANGES OF THE HEIGHT OF THE RATION