熊本大学学術リポジトリ
Optical studies of the quasi one‑dimensional charge‑density‑wave state in
[Pt(en)2][Pt(en)2Cl2](ClO4)4
(en=ethylenediamine) under hydrostatic pressure
journal or
publication title
Physical Review B
volume 40
number 5
page range 3066‑3076
year 1989‑08‑15
その他の言語のタイ トル
静水圧下の[Pt(en)2][Pt(en)2Cl2](ClO4)4の擬一次 元電荷密度波の光学的研究
URL http://hdl.handle.net/2298/9613
doi: 10.1103/PhysRevB.40.3066
Optical studies of the quasi-one-dimensional charge-density-wave state in [Pt(en)2][Pt(en)2Cl2](aO4)4 (en = ethylenediamine) under hydrostatic pressure
Masamichi Sakai, Noritaka Kuroda, and Yuichiro Nishina
Institutefor Materials Research, Tohoku University, 2-1-1 Katahira, Sendai, Miyagi 980, Japan (Received 3 January 1989)
We have measured optical absorption, photoinduced absorption, and Raman scattering in the quasi-one-dimensional mixed-valence complex [Pt(en)Jpt(en)2ClJ(ClO4)4 (where "en" is an abbre viation for "ethylenediamine"), under hydrostatic pressure up to 3 GPa at temperatures in the range 110-300 K. Analyzing the results by use of the Morse potential, we have evaluated the Peierls gap Eg, the electron-phonon coupling constant 0, the Peierls distortion of Cl ions, u, and the super-
transfer energy t0: Eg=3.0 eV, 0= 1.94 eV/A, and fo=O.52 eV at atmospheric pressure; Eg9 0, and
\u\ decrease with increasing pressure because t0 is enhanced significantly by the contraction of the Pt-Pt distance, and hence the 5^2 electrons of Pt ions are delocalized. It has been established that the intragap absorption which is enhanced by pressure and photoexcitation arises from the soliton- to-band transitions mediated by neutral solitons with a coherence length of only one Pt-Pt distance:
The absorption band exhibits two peaks, A and B, at 1.68 and 2.0 eV, corresponding to the van Hove singularities of quasi-one-dimensional conduction and valence bands. Such a small coherence length of the soliton is crucial for an understanding of this novel double-peak spectrum.
I. INTRODUCTION
[Pt(en)2]|l>t(en)2Cl2](ClO4)4 ("en" is short for
"ethylenediamine") is one of the halogen-bridged mixed- valence platinum complexes (HMPCs) which consist of quasi-one-dimensional chains of P^2+ and Pt4+ ions bridged by halogen ions as shown in Fig. 1. Hereafter, the complexes which contain ethylenediamine and C1O4 as anions are denoted as (Pt;JD for simplicity, where X=C1, Br, or I. In this quasi-one-dimensional chain, the halogen ion is located not at the midpoint between Pt2+
and Pt4+ ions, but at a point closer to the Pt4+ ion. The periodically alternating valence of Pt ions can be regard ed as a commensurate charge-density wave (CDW) with a commensurability index of 2.
A commensurate CDW system may support a soliton excitation which corresponds to the formation of a domain wall connecting two degenerate phases. The pos sibility of the solitonlike excitation in HMPC has been in vestigated theoretically by Ichinose on the basis of the Hamiltonian which consists of the site-diagonal electron- phonon interaction and the electron transfer between
neighboring Pt ions.1 Subsequently, Onodera2 has shown that, in the continuum limit, the Hamiltonian proposed by Ichinose corresponds to the Takayama-Lin- Liu-Maki Hamiltonian3 which has been developed to de scribed the soliton states in tazjw-polyacetylene. These theoretical works suggest that soliton excitations similar to those in fra/w-polyacetylene may take place in HMPC, as well. An example of such excitations is illustrated in Fig. 1. Recently, Baeriswyl and Bishop4 have discussed electronic levels and lattice distortions associated with in trinsic defect states in HMPC assuming a strong electron-phonon coupling. They have dealt with solitons, polarons, bipolarons, and excitons, showing that these de
fect states give rise to electronic levels inside the Peierls gap. In particular, solitons accompany localized levels near the middle of the gap.
The first experimental evidence for the presence of the midgap state has been obtained by Kuroda et al.5 from a measurement of the optical absorption in (Pt;Cl) under hydrostatic pressure. The A band which at atmospheric pressure appears at 1.68 eV in the absorption spectrum is shifted and enhanced reversibly by pressure, indicating that this band originates from an intrinsic defect. It has been assigned to the soliton-to-band optical transition on the basis of the relationship of the pressure-induced ener gy shift between the A and the charge-transfer (CT) ab sorption bands.
Matsushita et al.6 have found that an intragap absorp tion band in [Pt(en)2] [Pt(en)2I2] (SO4)2-6HZO is enhanced remarkably by photoexcitation of the CT band at 4.2 K.
They have assigned it to the optical transition at a soli tonlike mismatch
pt4+ pt4+ pt2+
which is created by failure of the recombination of elec tron and hole of a CT exciton (see Sec. IV D). Kurita
et al.1 have observed similar photoinduced enhancement for A and B bands in (Pt;Cl), where the latter appears at 2.0 eV at low temperatures. These experiments confirm that some intrinsic defect can be produced by photoexci tation in HMPC. The internal structure of the defect, however, is still controversial at present. For instance, Kurita et al. have interpreted their results in terms of the polaron model on the basis of the theory of Baeriswyl and Bishop.
Tanino et a/.8'9 have measured the effect of hydrostatic
pressure on absorption, luminescence, and Raman scattering spectra in several HMPC's. They have found 40 3066 ©1989 The American Physical Society
40 OPTICAL STUDIES OF THE QUASl-ONE-DIMENSIONAL ... 3067
^
FIG. 1. Schematic illustration of (a) the quasi-one- dimensional chain of HMPC, and (b) a soliton state. X stands for a halogen ion.
from Raman scattering by the breathing mode (that is, symmetric stretching vibration of halogen ions with Pt ions at rest) that there are two types of materials: One has a positive pressure coefficient of its frequency, and the other has a negative one. This finding indicates that the chemical bonds of the CDW chain are anharmonic, and the degree of anharmonicity depends largely on the ma terial. The anharmonicity of the bonds is closely related to electronic properties through the electron-phonon cou pling in these materials. Therefore, detailed knowledge of the chemical bonding is essential for understanding the electronic properties of the CDW state and the structure of the defect state. However, only very little is known about any of these materials to date.
In the present paper, we report the results of optical studies of absorption, photoinduced absorption, and the Raman scattering in (Pt;Cl) under hydrostatic pressure up to 3 GPa. We study the anharmonicity of the Pt—Cl bonding on the basis of the behavior of the CT band and the Raman spectrum of the breathing mode under pres sure. Quantitative information about'the Peierls distor tion, the energy gap, and the electron-phonon coupling constant is deduced from this study. This information gives insight into the nature of the CDW state in this ma terial. We examine the origin of the intragap absorption spectrum in terms of the pressure and temperature dependences of its intensity, spectral shape, energy shift, and photoexcitation effect. In particular, the photoexci- tation spectrum under pressure clarifies whether the pressure-induced and photoinduced absorption bands arise from the same defect state. The structure of the de fect state responsible for these intragap bands is discussed with reference to the results of the electron paramagnetic resonance experiment of Kawamori et ah10 as well as the results of the present study.
H. EXPERIMENTAL PROCEDURES
Single crystals are grown by evaporating the saturated aqueous solution at 45 °C. We use the Mao-Bell-type and clamp-type diamond anvil cells to generate hydrostatic pressure. The hydrostatic environment is obtained in a hole of a metal gasket which is sandwiched between a pair of diamonds. A mixture of kerosene and transform er oil is used as the pressure medium. The sample with a thickness of about 15 /xm and a chip of ruby crystal are sealed in this hole, In the absorption experiments, the sample is placed on a 10-/nn-thick bare sheet of a Po laroid linear polarizer. The installation of the polarizer in the pressure cell is crucial to avoid the depolarization effect due to strain in the diamonds. All the measure ments are performed with the polarization parallel to the
chain axis since intragap and CT-absorption bands are
observable only for this polarization.5'11 Pressure is cali
brated by measuring the wavelength shift of the Rx luminescence line of the ruby crystal irradiated by an Ar+-ion laser.
The absorption spectrum is measured by the lock-in method with a microscope-spectrometer system. The di amond anvil cell is placed on the stage of an Olympus IR microscope. The light of the halogen lamp passing through a pin hole is focused to a diameter of 50jim on the sample. Tb eliminate the photoexcitation effect, we employ a glass filter which cuts off the radiation with the wavelength shorter than that of the onset of the CT band.
The radiation transmitted out of the sample is collected by the microscope, and fed to a JASCO CT 25 mono- chromator through an optical fiber. It is detected by a Hamamatsu R666 photomultiplier, the output being stored by a microcomputer. The spectrum thus obtained is normalized with the spectrum of the polarizer alone which is measured beside the sample. To investigate the photoexcitation effect, we remove the glass filter. The in tensity of the excitation light is estimated to be ~ 10 jtiW^) The temperature of the sample is regulated by cooling the diamond anvil cell with evaporated nitrogen gas.
The Raman scattering spectrum is measured at room temperature by the use of a conventional photon count ing system with a Nalumi 1000D-WN double monochro- mator and a Hamamatsu R464 photomultiplier. The scattered light is observed in the backscattering geometry from a crystal surface involving the chain axis. The 488- nm line of the Ar+-ion laser is employed as the light
source.
m. EXPERIMENTAL RESULTS
The absorption spectrum exhibits a discontinuous change at 290 K under atmospheric pressure, as shown in Fig. 2(a). The A band originally seen at 1.66 eV and the onset of the CT band around 2.1 eV shift towards higher energies by about 20 and 40 meV, respectively. At the same time, the intensity of the A band increases by 40-80% depending on the sample. The spectrum changes in a very similar way if a low pressure (<0.01
~3000
-2000
(a) Pt-ci Ellb -OGPa
290 K
(b) Pt-Cl Ellb £0,01 GRi
298 K
1.6 1.8 2.0 2.2 Photon Energy (eV)
1.6 1-8 2-0 2.2 Photon Energy(eV) FIG. 2. Absorption spectra in the orthorhombic phase (dashed line) and the monoclinic phase (solid line): (a) just above and below 290 K at atmospheric pressure; (b) before and after application of low pressure at 298 K.
GPa) is applied at 300 K, as shown in Fig. 2(b). A structural transformation from orthorhombic to mono- clinic phases is known to take place at 290-295 K at at mospheric pressure accompanying a decrease of volume
by 1.4%.12 The spectral changes observed are undoubt
edly due to this phase transformation.
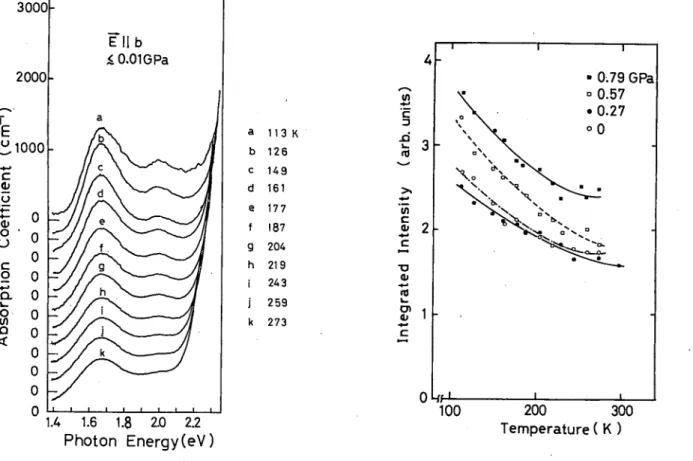
Figure 3 shows the temperature dependence of the ab sorption spectrum in the monoclinic phase. The intensity of the A band at 1.68 eV remains almost unchanged un til —200 K, and then gradually increases as the tempera ture is lowered. Its peak position, on the other hand, is independent of temperature. The onset of the CT band shifts to 2.2 eV at 120 K. According to the reflection measurement by Wada et a/.,13 the spectral peak of the CT band lies at 2.72 eV. Since it has a huge oscillator strength, its Urbach tail begins to appear already at 2.1-2.2 eV in the absorption spectrum. The shift of the onset energy with lowering temperature is due to a steepening of this tail. The B band becomes obvious at about 2.0 eV at temperatures below 200 K. To find the exact spectral position and the intensity of the B band, the contribution of the CT band is subtracted from each spectrum using the Urbach expression. The results are shown in Fig. 4. One finds that the ratios of amplitude and half-width of the A to the B bands are independent of temperature.
Similar measurements have been performed at various pressures. Figure 5 shows the temperature dependence of the integrated intensity of the intragap bands A and B at various pressures, while Fig. 6 shows an example of the
3000-
a b
c
d e f g h i j
k 113 K 126 14 9 161 177 187 204 219 243 259 273
1.4 1.6 1.8 2.0 2.2
Photon Energy (eV)
FIG. 3. Absorption spectra in the monoclinic phase at vari ous temperatures.
~ 2000h
u
1000 ■
(Js
co
au
O jQ
1.4 1.6 1.8 2.0 2.2
Photon Energy (eV)
FIG. 4. Net intragap absorption spectra at various tempera tures obtained from experimental spectra shown in Fig. 3.
w 'cD
c
li
"5 3
1
0
o V
»\ \
X CN^ ^v
1 - 0.79 GPa -0.57
• 0.27 oO
>^
■■*—•.
-
100 200 300
Temperature (K )
FIG. 5. Temperature dependence of integrated absorption in tensity of the intragap absorption bands at various pressures.
40 OPTICAL STUDIES OF THE QUASI-ONE-DIMENSIONAL ... 3069
1 2
Pressure (GPa)
FIG. 6. Pressure dependence of the integrated intensity of the intragap absorption bands at room temperature.
pressure dependence of the intensity at room tempera ture. The intensities of the intragap bands increase con tinuously with pressure after increasing by a factor of 2-3 during the phase transition at a low pressure. On release of pressure, the intensity passes through a hys teresis loop. The hysteresis is very small if the pressure is released from 1 GPa or lower; otherwise, the intensity does not recover to the initial value even though the pres sure is completely released. It recovers gradually if the sample is kept at ambient conditions for a few weeks.
Figure 7 shows the absorption spectra at 150 K under various pressures. The pressure dependence of spectral positions of A, B, and CT bands at 150 K is shown in Fig. 8, along with the data for the monoclinic phase at
1.4 1.6 1.8 2.0 2.2
Photon Energy(eV)
FIG. 7. Absorption spectra under various pressures at 150 K.
1 2
Pressure (GPa)
FIG. 8. Pressure dependence of spectral positions of A and B bands and the edge of CT band at 150 K (solid circles) and 295 K (open circles).
295 K. Since the slope of the absorption edge of the CT band is independent of pressure, we show the influence of pressure to this band by plotting the photon energy at which the absorption coefficient is 2.0 X103 cm"1. The A and CT bands shift significantly towards lower energies with increasing pressure, while the B band shifts very lit tle.
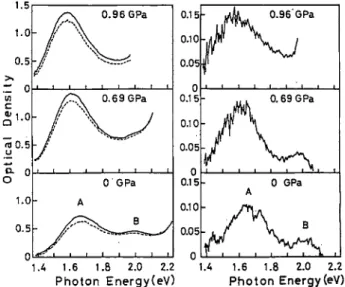
Figure 9 shows the photoinduced absorption spectra observed under various pressures at 170 K. The spectra at atmospheric pressure and 0.69 GPa show that both A and B bands are enhanced by the photoexcitation. At
1.5
1.0
0.5
.t! 0
"5 0.5
Q.
O 1.0
0.5
0
/
A
0.96 GPa
0.69 GPa
0 GPa
0.96 GPa
1.4 1.6 1.8 2.0 2.2 Photon Energy(eV)
1.A 1.6 1.8 2.0 2.2 Photon Energy(eV)
FIG. 9. Photoinduced absorption spectra at 170 K under several values of pressure. Solid and dashed lines on the left column are the spectra after and before the pumping, respec tively. The photoinduced differential spectra are shown on the right column.
200 400 600 800 1000
Raman Shift (cm"1)
FIG. 10. Raman scattering spectra at various pressures at room temperature.
0.96 GPa, the A band is clearly enhanced. Unfortunate ly, it is impossible to observe the photoexcitation effect on the B band at this pressure because the CT band comes down to overlap the B band. However, the present results verify satisfactorily that the photoinduced and the pressure-induced intragap bands originate from the same defect state.
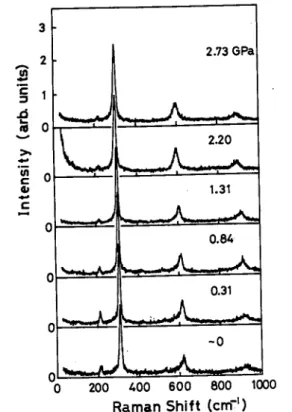
Figure 10 shows the Raman scattering spectra under various pressures at room temperature. The feature at about 310 cm"1 is the breathing mode, and those at about 620 and 930 cm"1 are the twofold and the three fold overtones of the breathing mode, respectively. No changes, due to the application of pressure, are observed
1 2 3
Pressure (GPa)
FIG. 11. The pressure dependence of the frequency of the breathing mode of Cl ions.
in the spectrum apart from slight shifts of these features.
This result suggests that no crystallographic change occurs in the pressure range examined. Figure 11 shows the plot of the frequency of the fundamental breathing mode as a function of pressure. The frequency decreases nonlinearly with increasing pressure up to 3 GPa, and then begins to increase.
IV. DISCUSSION
A. Characterization of the CDW state
The on-site Coulomb repulsion energy U9 and the nearest-neighbor Coulomb repulsion energy V, as well as the electron-phonon coupling energy have been recog nized to be important for determining the character of the ground state in HMPC. According to the theoretical examination by Nasu14 in terms of the extended Peierls- Hubbard model, the ground state must be either the CDW or the SDW (spin-density-wave) state. In brief, if U is lower than the sum of V and the electron-phonon coupling energy, the CDW state is stable as it is in the present material. Otherwise, the SDW state is realized to form an antiferromagnetic -Pt3+-X-Pt3+-X-Pt3+-chain.
The optical excitation of a charge-transfer excitation in the CDW state corresponds to transferring an electron from a Pt2+ ion to the neighboring Pt4+ ion. Taking the change of valences of the Pt ions resulting from the opti cal transition into account (see Fig. 17), the optical exci tation energy, ECT, of an exciton is given by
_ _ . _ _ _ _ _ /1 \
where Eg is the Peierls gap. The Peierls gap of the CDW state is determined by the electron-phonon coupling. It
can be expressed as4
Eg=40\u\ , (2)
where jS is the electron-phonon coupling constant and u the Peierls distortion of Cl ions from the midpoint be
tween Pt2+ and Pt4+ ions.
Upon making an analogy with the treatment of Baer- iswyl and Bishop,4 the energy, G, of the CDW state per Pt2+-Cl"~-Pt4+ bond measured from the undistorted state is written as a function of u in the form
V, (3)
where the first term, <!>(«), refers to the elastic energy due to the Peierls distortion of Cl ions, the second term to the energy gain due to the electron-phonon coupling, and the rest to the total difference of the Coulomb energy. &(u) is directly related to the lattice-dynamical properties.
The stretching force constant usually increases upon con traction of the bond length. The softening of the breath ing mode in (Pt;Cl) under pressure indicates that <E>(w) is strongly anharmonic.
The Morse potential is one of the most appropriate ex pressions for phenomenologically describing such an anharmonic bonding.15 A Cl ion participates in both Pt2+—Cl and Pt4+—Cl" bondings, so that the adiabatic potential at a Cl ion can be written as
40 OPTICAL STUDIES OF IHE QUASI-ONE-DIMENSIONAL ... 3071
<!>(u)=D[(l-eku)2+(l-e-ku)2] , (4) where D and k are positive constants which measure the depth and the anharmonicity of the potential well, re spectively.
Let M be the mass of a Cl ion, and co the frequency of the breathing mode. Then, the force constant, K =Mco2, for the breathing mode is given by
K=<!>"(u)=f[(2eku-l)eku+(2e-ku-l)e-Xu] , (5) with/=22U2.
In the complex (Pt;I), \u\ is 0.12 A, and co is known to
increase significantly with increasing hydrostatic pres sure.9 It is evident that k\u\ «1, and thus co is deter mined primarily by / in the case of (Pt;I). This character of the Pt—I bonding allows us to obtain the value of/ in (Pt;Cl) by scaling from (Pt;I). According to Guggenhei- mer,16 / varies with the bond length, d, as d~m. With lattice constants 11.65 and 10.80 A in (Pt;I) and (Pt;Cl), respectively, and co = 123 cm"1 and / = 5.66 X10⁴ dyn/cm in (Pt;I) at atmospheric pressure, we find /=6.96X 104 dyn/cm in (Pt;Cl). We have *>=311 cm"1, K =2.02X 10⁵ dyn/cm, and \u\ =0.39 A in (Pt;Cl) at at mospheric pressure. Solving Eq. (5) with these parame ters, we obtain A,=0.90 A "*.
As evident from Eq. (5), the change of co under pres sure is determined by the competition between the changes of/ and k\u|. In (Pt;Cl), co decreases distinctly with increasing pressure, indicating that k\u\ decreases so much as to overcome the effect of the increase of /.
This property will be discussed quantitatively in Sec.
IV C.
The minimization of the ground-state energy, G(u), with respect to u leads to
P=(f/2k)[{eku—l)eku+{l— e~ku)e"ku] . (6)
Substituting the values of/, m, and k into Eq. (6), we ob
tain j3= 1.94 eV/A in (Pt;Cl) at atmospheric pressure.
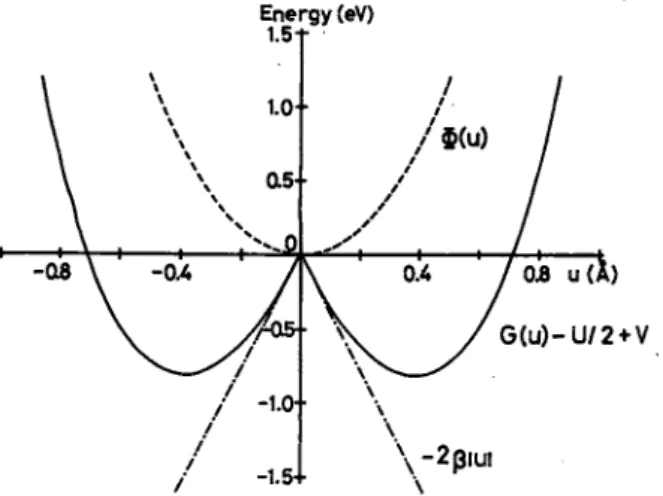
Figure 12 shows <J>(t/) and G(u) — U/2+Vas a func tion of u. Note that the electron-phonon coupling causes G(u)— U/2+V to have double minima with depth of -0.81 eV. The Cl ions fall into either of these minima
Energy(eV) 1.5*1"
0.8 u(i) G(u)-U/2 + V
-1.5-1 -2piui
FIG. 12. The Morse potential, <!>(«), and the ground-state energy, G(u)> as a function of the Peierls distortion, u, of Cl ions.
inducing a CDW state with a Peierls gap Eg =4jB|w | =3.0 eV. Since £^=2.72 eV,13 Eq. (1) yields 3K-E/=-0.3 eV. The minimum value of G amounts to —0.5 eV if U = 1.2 eV and V=0.3 eV are chosen as a reasonable set of U and V. This potential well is deep enough to stabi lize the CDW state under usual conditions.
B. The origin of A and B bonds
It appears from the above estimation that the half- value of Eg, 1.52 eV, is fairly close to the spectral energy, 1.68 eV, of the A band. This fact supports our interpre tation that the A band arises from the optical transition between a soliton state and the conduction and/or the valence bands.5 A soliton state should lie near the middle of the energy gap at any pressure. As a consequence, the A band should shift under pressure towards lower ener gies with its rate equal to about half that of the shrinkage of the energy gap. Since E^ should decrease as Eg de creases, the rate of the shift of the A band is expected to be about half that of the CT band.
In fact, our experiments show that the amount of the shift of the A band is 0.37 times that of the CT band over the whole pressure range examined. The discrepancy from 0.5 is reasonable because V might be reduced by delocalization of the charge on the Pt ions under pres sure. From the amount of the pressure-induced shift of
A and CT bands, we may estimate dV/dP~— 0.015 eV/GPa. The effect of delocalization of the charge will be discussed in more detail in Sec. IV C in relation to the pressure dependence of the electron-phonon coupling.
The A and CT bands also shift synchronously upon the structural transformation from the orthorhombic to the monoclinic phases around 290 K at atmospheric pres sure, as seen in Fig. 2(a). The lattice constant along the chain axis increases by 0.3% upon this transformation.12 Consequently, the A and CT bands shift towards higher energies by 21 ±5 and 39±1 meV, respectively. The ratio is equal to 0.54±0.14 in good agreement with 0.5. Prob ably the change of \u\ determines the shift of the CT band in this transformation.
The energy dispersions of the conduction and the valence bands of a one-dimensional CDW system in which the electron-phonon coupling is of site-diagonal type can be expressed as4
E± = ±[4tlsin2(kb)+A2]l/2 , where the gap parameter A is defined as
(7)
(8) In Eq. (7), E+ and i?_ refer to the conduction and the valence bands, respectively, 10 is the supertransfer energy between the nearest Pt2+ and Pt4+ ions, b is the distance
between the two Pt ions, and k is the momentum along the chain axis measured from the position of the Peierls gap. A soliton has a dual character of conduction and valence bands.17 Since it is localized spatially, its wave function is composed of the Bloch states of the whole conduction and valence bands. In principle, therefore, if the interband optical transition is allowed at a certain
critical point, the direct optical transition between the soliton state and both the conduction and the valence bands is allowed at any position in momentum space.
In the present material, the optical transition between the valence and the conduction bands is forbidden by parity at the T point, but allowed at the Z point of the zone edge along the chain axis where the Peierls gap opens.18 This is also the case in taws-polyacetylene.
The squared optical matrix element, \M(k)\2, for the
transition from a soliton to conduction and valence bands is given in the continuum approximation by18
|M(*)|2=Tf-sec: (9)
where £ is the coherence length of a soliton, that is, half the width of a kink, and L the length of the chain. The squared sech function in Eq. (9) takes its half-value at
|ttA:£/2|~0.9, and extends beyond |irfc|/2|~2. One may safely say that optical transitions are significant in
the range \k \ k 1 /§. Consequently, the probability of the
soliton-to-band optical transition should be finite even at the r point if |" is comparable with the distance, 6, be
tween Pt2+ and Pt4+ ions.
The density of states of an electronic band diverges at both the critical points as shown in Fig. 13. The disper sion of a band given by Eq. (7) gives rise to a greater singularity at the T point than the Z point. This serves to intensify the transition at the T point, although it would be still weaker than the transition at the Z point.
On account of the relative intensities of the A and B bands observed in our pressure-induced and photoin- duced absorption experiments, we attribute the B band to the $oliton-to-band transition at the T point. •
Within the framework of this interpretation, the difference in energy between A and B bands is equal to the width of the conduction and the valence bands, which is given by
UJ
<
*
OQ
CD
CB
V B
DOS
FIG. 13. A schematic illustration of the density of states of the conduction and valence bands and the soliton state. The soliton-to-band optical transitions corresponding to the A and B bands are shown by vertical arrows, A and B, respectively.
A. (10)
We have W=0.32 eV at atmospheric pressure from our experiment, and thus we obtain fo=O.52 eV from Eq.
(10). The Takayama-Lin-Liu-Maki model gives3 (11) It follows from Eq. (11) that £=0.7fc. Indeed we obtain l/|~?r/(26), ensuring that the soliton-to-band transition has an appreciable intensity at the T point.
Optical transitions mediated by a soliton with such a small coherence length gives rise to the absorption spec trum, a( h v),
a(hv) = A
= A 'sech2 -l )2- i1/2
X([(/*v)2-A2][4fg+A2-(Av)2]}-1/2 (12)
where hv is the photon energy; A and A1 are constants.
Figure 14 shows the theoretical spectrum for |=6 in comparison with the experimental absorption spectrum at 126 K. The structure corresponding to the B band ap pears clearly in the theoretical spectrum in accord with the experimental spectrum. The double-peak structure due to the Van Hove singularities has been observed for the first time in the soliton-to-band optical absorption.
The above arguments give the energy gap
£g+2JF=3.6 eV at the T point. Since the dispersion of a band is very small in comparison with the energy gap, the value of 3 V — U may be rather independent of the momentum. We have deduced 3 V — U = — 0.3 eV in the preceding subsection. Thus the energy of the CT exciton at the T point is expected to be —3.3 eV. Correspond
ingly, Wada et at20 have recently found a parity-
forbidden exciton absorption band at 3.4 eV from an electroreflectance experiment.
U 1.6 1.8 ZO 22 2A
Photon Energy (eV)
FIG. 14. Theoretical (dashed line) and experimental (solid line) absorption spectra of the soliton-to-band transition. The amplitude of the theoretical absorption spectrum has not been adjusted to fit the experimental spectrum.
minimum value, Gmin. Note that the energy dip at G^
becomes shallower if p is reduced. This fact implies that the CDW state tends to be unstable as the pressure in
creases.
D. Internal structure of solitons
The oscillator strength of the A band scales with the density of solitons.19'24'25 As shown in our previous pa per,5 an as-grown crystal contains ~3(g/b)~lX10~4 solitons/molecule at atmospheric pressure and room tem perature. This gives a soliton density of ~4X 1017 cm"3 since we have £~6. The density increases discontinuous- ly by 40-80% upon the structural transformation from orthorhombic to monoclinic phases around 290 K as seen in Fig. 2(a). The absorption intensity at temperatures below the transition point is shown in Fig. 5. Under at mospheric pressure, the soliton density remains nearly unchanged until ~200 K, and then it increases gradually as the temperature is lowered.
Kawamori et ah have measured the electron paramagnetic resonance (EPR) in this material.10 They have found unpaired electrons in the density of ~5X 1017 cm"3 at 295 K. They also have observed a discontinuous
change in the intensity of the resonance absorption by about 30% as the temperature is changed across the tran
sition point.26 The intensity remains unchanged if the
temperature is lowered down to 200 K. This temperature dependence of the resonance intensity is quantitatively in good accord with that of the soliton density which has been deduced from our optical measurements. It is very likely that the A and B bands originate from solitons with spin, that is, neutral solitons.
The unit cell of the orthorhombic phase contains two nonequivalent chains, of which one has the Peierls distor tion of \u\ and the other — |ii|. The transformation to the monoclinic phase unifies these distortions either \u\
or — |w|,12 reversing the sign of the distortion of one of the two chains. Usually the first-order structural trans formation produces domains in the low-temperature phase. Neutral solitons produced in the monoclinic phase of this material are domain walls resultant from mismatch of the sign of the Peierls distortion between neighboring portions of a chain. Our experiment shows that there is a mechanism to produce domain walls at a higher density in the transformation driven by pressure than the transformation driven by temperature.
The lowering of temperature in the range of 295-200 K causes a broadening of the EPR spectrum, indicating that the unpaired electrons are moving about rapidly by thermal activation. At temperatures below 150 K, the spectrum splits into hyperfine and superhyperfine struc tures because the thermal motion of the unpaired elec tron slows down. From a detailed analysis of the hyperfine spectrum with the isotope effect of Pt ions tak en into account, Kawamori et ah have identified that each unpaired electron resides at a pair of Pt ions spend ing its time equally at either of the two Pt ions. They have assigned the Pt2+-Pt3+ valence state as the site of the unpaired electron. Therefore, the valences of these Pt ions can be regarded as 2.5.
The hyperfine splitting of the EPR spectrum for the magnetic field normal to the chain axis consists of five lines with intensity ratios of 1:8:18:8:1. It is this fact that has led Kawamori et ah to identify the valence state of the defect as cited above. Instead, the polarons shown in Fig. 17 would exhibit the hyperfine structure consisting of three components with intensity ratios of 1:4:1. If the orbit of the.unpaired electron or hole of the polarons ex tends to the Pt2+ or Pt4+ ions on both sides of the central Pt3+ ion, each line would be split further into five lines
with intensity ratios of 1:8:18:8:1. However, the experi mental EPR spectrum cannot be reproduced by any choice of the hyperfine interaction constants of these Pt ions.
The order parameter of an intrinsic defect state must be either an even or an odd function of the distance from its center; the former is a polaron, and the latter a soli ton.27 In the present case, the order parameter can be de duced from the ordering of valences of the Pt ions. The ordering of valences of the Pt ions postulated by the EPR spectrum is
pt2+ pt2.5+ pt2.5+ pt4+
Comparing it with the regular ordering of valences of a chain
pt4+ pt2+ pt2+ pt4+ pt2+
we find that the order parameter varies in the way
••• -1-1 -0.5 0.5 1 1 ••• .
This spatial variation of the order parameter evidently shows that the defect state is the neutral soliton. The spatial variation can be described well by tanh(x/£) with I"=b, in good accord with our analysis of the intragap ab-
(CT exciton) 4 2 4
(®) 4 d 3) 4 (5 "2) 4 2 4
So So
( ®) 4 2 (2 5) g 2) 4 2 4
s* s-
(©) 4 2 4(D4 2d)2 4
P* P"
FIG. 17. Processes for producing a CT exciton and a pair of (a) neutral solitons 50 and §0, (b) charged solitons S+ and § ~, and (c) polarons P+ and P", by photoexcitation of a uniform chain in the ground state. Numerical numbers 2, 3, and 4 refer to the valences of Pt ions, h v and an arc arrow denote a photon and the transfer of an electron, respectively.
40 OPTICAL STUDIES OF THE QUASI-ONE-DIMENSIONAL ... 3075
sorption spectrum. One finds that the relaxation of the Pt2+-Pt3+ valence state to the Pt25+-Pt2*5+ state results in a magnification of the total domain size from ~ 2b to
— 36. This magnification of the domain size probably works to lower the formation energy of a soliton.
The photoexcitation effect of the optical absorption in dicates that a bound state, that is, a breather of a neutral soliton and its antisoliton is created by a failure of the electron-hole recombination during the relaxation of a CT exciton. Figure 17 shows how intrinsic defect states can be created from a CT exciton. It is clear from the preceding arguments that the breather of neutral solitons So and So shown in Fig. 17 eventually has the structure
+4+ Pt Pt.2.5+ Pt.4+
So far, we have ignored the interaction between chains.
However, the Pt2+ and Pt4+ ions in the crystal are or dered within the plane normal to the chain axis as well.
In I other words, the interaction between chains is
significant. In this sense, two phases of the CDW state of a chain are not strictly degenerate. Suppose that a
breather is unbound into a pair of solitons in a uniform crystal of the monoclinic phase. Then, the sign of the Peierls distortion in between the soliton and its antisoli ton on the chain is reversed relative to that of neighbor ing chains. The lattice energy increases more and more as the distance between the two solitons increases. There is no doubt that the energy of a soliton is lowest if it is bound closely with its antisoliton like the form presented above. We are probably observing these breathers rather than unbound solitons, particularly in the photoexcita tion experiment at low temperatures.
Finally, we would like to mention the polaron model in light of our experimental results. The theory of Baer iswyl and Bishop predicts that a pair of intragap absorp tion bands appear in the near infrared region at energies 0.875£g+2F-C/and 0.625£g+2K if polarons are created in the crystal. The former arises from the transition be tween valence and conduction bands at the polaron site, and the latter between the valence (conduction) band and an electron (hole) polaron. The present experiment confirms that the photo-induced and pressure-induced absorption bands are identical with each other. There fore, if the A and B bands arise from polarons as argued by Kurita et al.,7 the pressure-induced shifts of A and B bands must be some 0.8 and 0.6 times that of the CT band, respectively. This postulation is in disagreement with our experimental results.
Recently, Mishima and Nasu28 have developed a theory which incorporates the supertransfer energy com parable to U. This theory claims that a pair of intragap absorption bands predicted by the theory of Baeriswyl and Bishop would appear at 0.8Eg and 0.1Eg9 that is,
~2.4 and —2.1 eV, respectively. Mishima and Nasu at tribute the B and A bands to these transitions. Note that the relative energies are reverse to what is expected from the theory of Baeriswyl and Bishop. Anyhow, this theory cannot explain our experimental results for the same reason as above. In addition, the energy difference be tween the two absorption bands is equal to the self-energy
of a polaron within the framework of that theory. We have shown that p and \u\ decrease with increasing pres sure. Consequently, the self-energy of a polaron should decrease with pressure. Contrary to this prediction^ our experiments show that the energy difference between A and B bands increases significantly. For these reasons, polarons are excluded as the origin of A and B bands.
Very recently, Bishop et al.29 reported that another
absorption band ("C peak") appears at 0.41 eV in (Pt;Cl).
They interpreted the "C peak" as well as the A and B bands in terms of optical transitions due to hole polarons.
One should be very careful in interpreting the infrared spectrum because there are many vibrational bands asso
ciated with anions. Indeed, in the photon energy region around 0.41 eV there is a series of absorption lines due to the stretching vibration of the N—H bonds of ethylenedi- amine. We cannot decide if the "C peak" is this absorp tion band since the spectrum is not presented in Ref. 29.
However, this vibrational band seems so strong that it would mask a polaron-mediated absorption even if a con siderable number of polarons exist in the crystal.
V. SUMMARY AND CONCLUSIONS
The optical absorption, photoinduced optical absorp tion, and the Raman scattering spectra have been mea sured in a halogen-bridged mixed-valence platinum com plex [Pt2(en)2][Pt2(en)2Cl2](ClO4)4 under hydrostatic pressure up to 3 GPa. We have analyzed quantitatively the energy of the charge-transfer exciton absorption band and the frequency of the breathing mode employing the Morse potential which characterizes the strongly anhar- monic Pt—Cl bonding. The Peierls gap, Ev and the electron-phonon coupling constant, j8, have been evalu ated to be 3.0 eV and 1.94 eV/A, respectively, in the monoclinic phase at atmospheric pressure. This value of Eg yields a relationship 3V — U = — 0.3eV between the intersite and on-site Coulomb energies V and U9 respec tively.
Two intragap absorption bands, A and B, which ap pear at 1.68 and 2.1 eV, respectively, at atmospheric pres sure have been identified as soliton-to-band transitions:
The A and the B bands arise from singularities of the density of states peculiar to quasi-one-dimensional elec tronic bands. The whole spectrum agrees well with the theoretical spectrum calculated with a supertransfer ener gy, f0, of 0.52 eV. The width of both the conduction and valence bands turns out to be 0.32 eV, and thus the ener gy gap at the T point to be 3.6 eV. Then the parity- forbidden CT exciton is predicted to appear in the electro-reflectance spectrum at 3.7±3F— U=3.3 eV, in good agreement with the experimental value of 3.4 eV.
The soliton state which is responsible for the intragap absorption bands is the neutral soliton. An as-grown crystal contains neutral solitons at a density of ~4X 1017 cm"3 at atmospheric pressure and room temperature.
The structure of the neutral soliton is represented by the ordering of the valence states of Pt ions as follows:
. . . pt2+ pt4+ pt2.5+ pt2.5+ pt4+ pt2+ . . . . The spatial variation of the order parameter can be described well by the function tanh(;c/£); the coherence length, f, is mere-
ly one Pt-Pt distance. Such a small coherence length is due to the fact that 4to/Eg~l. It is this situation that gives rise to the intragap absorption band with a novel double-peak structure. The optical pumping of charge- transfer excitons produces breathers of these neutral soli- tons quite efficiently. Crystallographic considerations lead us to conjecture that the breather is the preferential state rather than the unbound solitons.
The pressure dependences of Eg, /J, t0, and the Peierls distortion, u, of Cl ions have been clarified from the pressure-induced shifts of optical absorption and the Ra man scattering spectra. The parameters \u\ and f5 are re duced at comparable rates by pressure, so that they con tribute nearly equally to the reduction of Eg. On the oth er hand, t0 increases appreciably with pressure as shown by the large Griineisen parameter of 3.5. The reduction of ft comes from delocalization of the 5c?z2 electrons of the
Pt ions due to the increase of tQ. The pressure depen dence of the ground-state energy which is evaluated from these parameters indicates that the CDW state tends to become unstable as the pressure increases
ACKNOWLEDGMENTS
The authors wish to thank Professor S. Kurita and Dr.
M. Haruki of Yokohama National University for stimu lating discussions and offering the synthesized material of the sample. They thank Professor A. Kawamori of Kwansei Gakuin University for useful discussions. They also thank Professor J. R. Anderson of the University of Maryland for a critical reading of the manuscript. This work was supported in part by a Grant-in-Aid for Scientific Research from the Ministry of Education, Sci ence and Culture of Japan.
1S. Ichinose, Solid State Commun. 50,137 (1984).
2Y. Onodera, J. Phys. Soc. Jpn. 56,250 (1987).
3H. Takayma, Y. R. Lin-Liu, and K. Maki, Phys. Rev. B 21, 2388 (1980).
4D. Baeriswyl and A. R. Bishop, J. Phys. C 21, 339 (1988).
5N. Kuroda, M. Sakai, Y. Nishina, S. Kurita, and M. Tanaka, Phys. Rev. Lett. 58, 2122 (1987).
6N. Matsushita, N. Kojima, T. Ban, and I. Tsujikawa, J. Phys.
Soc. Jpn. 56,2308 (1987).
7S. Kurita, M. Haruki, and K. Miyagawa, J. Phys. Soc. Jpn. 57, 1798 (1988).
8H. Tanino, N. Koshizuka, K. Kobayashi, M. Yamashita, and K. Hoh, J. Phys. Soc. Jpn. 54,483 (1985).
9H. Tanino, N. Noshizuka, K. Kobayashi, M. Yamashita, and K. Hoh, in Proceedings of the 19th International Conference on Raman Spectroscopy, Tokyo, 1984 (Chemical Society of Japan, Tokyo, 1984), p. 792.
10A. Kawamori, R. Aoki, and M. Yamashita, J. Phys. C 18, 5487 (1985).
nM. Tanaka, S. Kurita, T. Kojima, and Y. Yamada, Chem.
Phys. 91, 257 (1984).
12K. Toriumi, M. Yamashita, I. Murase, and T. Ito (private communication).
13Y. Wada, T. Mitani, M. Yamashita, and T. Koda, J. Phys.
Soc. Jpn. 54, 3143 (1985).
14K. Nasu, J. Phys. Soc. Jpn. 52, 3865 (1983); 53, 302 (1984); 53, 427 (1984).
15P. M. Morse, Phys. Rev. 34, 57 (1929).
16K. M. Guggenheimer, Proc. Phys. Soc. London 58,456 (1946).
17W. P. Su, J. R. Schrieffer, and A. J. Heeger, Phys. Rev. Lett.
42, 1698 (1979); Phys. Rev. B 22, 2099 (1980); 28, 1138(E) (1983).
18M. Tanaka, S. Kurita, M. Fujisawa, and S. Matsumoto, J.
Phys. Soc. Jpn. 54, 3632 (1985).
19K. Maki and M. Nakahara, Phys. Rev. B 23, 5005 (1981).
20Y. Wada, T. Mitani, M. Yamashita, and T. Koda, Synth. Met.
19, 907 (1987).
21W. Weber, Phys. Rev. Lett. 58,1371 (1987).
22M. H. Whangbo and M. J. Foshee, Inorg. Chem. 20, 113
(1980).
23H. Tanino, N. Koshizuka, K. Kobayashi, K. Kato, M.
Yamashita, and K. Hoh, Physica B+C 139cfel40B, 487 (1986).
24J. Tinka Gammel and J. A. Krumhansl, Phys. Rev. B 24,1035 (1981).
25S. Kivelson, Ting-Kuo Lee, Y. R. Lin-Liu, Ingo Peschel, and Lu Yu, Phys. Rev. B 25,4173 (1982).
26A. Kawamori (private communication).
27K. Fesser, A. R. Bishop, and D. K. Campbell, Phys. Rev. B 27,4804(1983).
28A. Mishima and K. Nasu, Phys. Rev. B 39, 5763 (1989).
29A. R. Bishop, J. Tinka Gammel, and S. R. Phillpot, Synth.
Met. (to be published).