2006 年 12 月 14 日、 15 日 筑波宇宙センター 宇宙航空研究開発機構
ISSN 1349-113X JAXA-SP-06-035
宇宙航空研究開発機構特別資料総合技術研究本部
第3回﹁宇宙環境シンポジウム﹂講演論文集宇宙航空研究開発機構JAXA-SP-06-035
第3回「宇宙環境シンポジウム」
講演論文集
©JAXA
帯電モニター POM 積算吸収線量計 DOS
磁力計 MAM きく8号(ETS-Ⅷ)
2006年12月18日打ち上げ
2006年12月
宇宙航空研究開発機構
第3回「宇宙環境シンポジウム」講演論文集
Proceedings of the 3rd Spacecraft Environment Symposium 宇宙航空研究開発機構特別資料
JAXA Special Publication
December 2006
Japan Aerospace Exploration Agency
JAXA-SP- 0 6 - 0 3 5
作成元 総合技術研究本部 環境計測グループ
Prepared by
Space Environment Measurement Group
Institute of Aerospace Technology
目 次
特別講演
「Presentation of radiation environment activities at ONERA/DESP and collaboration with JAXA」
Angelica SICARD-PIE (ONERA)
...1
特集 1 衛星設計・試験の標準化作業の現状
「MEASUREMENT OF NEAR EARTH RADIATION ENVIRONMENT IN JAXA - OVERVIEW AND
PLAN -」
Tateo Goka, Haruhisa Matsumoto (JAXA)
...17
「衛星帯電・放電設計基準,絶縁設計,太陽電池の品質保証標準の概要」
Kumi Nitta(JAXA)、Spacecraft Design Standard WG1、WG5、WG8
...23
「Status of ISO Standardization of ESD Test of Satellite Solar Array」
Mengu Cho (Kyushu Institute of Technology)
...27
宇宙環境計測・宇宙天気
「国際標準規格のための新しい太陽陽子フルーエンスモデルの提案」
風間 洋一、五家 建夫(JAXA)
...37
「磁気圏シミュレーションを用いた静止軌道プラズマ環境予報」
中村 雅夫(大阪府大)、島津 浩哲、小原 隆博(NiCT)、藤田 茂(気象大)、田中 高史(九州大)
...41
「2001年
4
月15
日イースターイベントの新解釈」村木 綏(JAXA)
...45
「月の宇宙天気予報」
亘 慎一(NiCT)
...51
「宇宙天気データを 11 年周期で見る」
篠原 学(九州大)
...57
「放射線帯電子の変動機構と宇宙天気予報への応用」
小原 隆博(NiCT/JAXA)、古賀 清一、松本 晴久、五家 建夫(JAXA)
...61
「宇宙電磁環境モニターシステム」
小嶋 浩嗣、今久 保洋、松本 陽史、山川 宏(京大・生存圏研究所)、八木谷 聡(金沢大)、
臼井 英之、上田 義勝(京大・生存圏研究所)、松沢 泰久(国際電気通信基礎技術研究所)、
岩井 誠人(同志社大)
...65
「衛星による地震の電離圏への影響の観測
-ひのとり衛星により得られた電子温度の予備的解析-」
小山 孝一郎
(
首都大)
、鴨川 仁(東京学芸大)、児玉 哲哉(JAXA)
、柿並 義広(
九州大)
...71
「世界の地震電磁気観測衛星の現状」
児玉 哲哉(JAXA)
...73
「地球極軌道におけるプラズマ環境の衛星観測データ統計解析」
浜永 貴光、趙 孟佑(九州工大)
...77
「「れいめい」衛星によるオーロラ帯プラズマパラメータの計測と 飛翔体環境シミュレーション」
岡田 雅樹(国立極地研究所)、臼井 英之、大村 善治(京都大)、上田 裕子(JAXA)、
村田 健史(愛媛大)
...83
「れいめい衛星搭載のラングミュアプローブ特性に関する
PIC
シミュレーション-進捗報告-」
臼井 英之、今里 康二郎(京大・生存圏研究所)、上田 裕子(JAXA)、岡田 雅樹(国立極地研究所)
...87
材料・物性
「酸素原子環境計測用材料としてのポリイミドのエロージョン特性(2)
―入射角度依存性について―」
横田 久美子、田川 雅人(神戸大)
...91
「シリカガラスの電子照射下でのカソードルミネッセンスと電気的特性の相関」
原田 卓弥、廣川 紫月、西川 宏之(芝浦工大)
...95
「ELイメージングによる太陽電池セルの劣化評価」
豊田 裕之,田中 孝治,佐々木 進,田島 道夫(JAXA)
...99
「電子線照射による衛星用絶縁材料の絶縁特性への影響」
林 寛、宮崎 英治、國中 均、佐藤 哲夫(JAXA)、吉田 禎二(NTSpace)、藤井 治久(奈良高専)、
村上 洋一(三菱電機)
「感温液晶を用いた電子線照射下における高分子絶縁材料内部の温度分布測定」
鈴木 敬久(首都大)、三觜 健太、田中 康寛、高田 達雄(武蔵工大)、福永 香(NiCT)
...109
特集
2 デブリモデリング・計測
「国際宇宙ステーションにおけるダスト捕獲実験(MPAC)」
北澤 幸人(IHI/JAXA)、野口 高明(茨城大)、Michael J. Neish(AES)、山県 一郎、木本 雄吾、
石澤 淳一郎(JAXA)、藤原 顯(元
JAXA)、鈴木
峰男(JAXA)...113
「デブリ環境モデル(MASTER-2005, 2001, ORDEM2000)の比較
―宇宙機設計適用プロセスの国際規格化に向けて―」
福重 進也,赤星 保浩(九州工大),北澤 幸人,五家 建夫(JAXA)
...117
「大型宇宙機へのデブリ衝突検出系の提案」
相馬 央令子(東京理科大)、千葉 茂生(東大)、高野 忠、長谷川 直(JAXA)、
佐野 雅敏(東京理科大学)
...123
「スペースデブリ衝突によって発生したプラズマによる太陽電池の持続放電の可能性」
福重 進也、赤星 保浩(九州工業大学)、渡辺 圭子(立命館大学)、古澤 直美、楠 修平、
高良 隆男、趙 孟佑、細田 聡史、原田 昭治(九州工業大学)、藤田 辰人(JAXA)
...127
「宇宙機設計標準 デブリ防護設計WGにおける衝突実験」
川北史朗(JAXA)、設計標準WG3(デブリ防護設計)
...131
帯電・放電実験
「汎用宇宙機帯電解析ツール(MUSCAT)の解析機能の開発」
八田 真児、村中 崇信、細田 聡史、金 正浩、趙 孟佑(九州工大)、上田 裕子、古賀 清一、
五家 建夫(JAXA)
...135
「電子線照射における宇宙機用絶縁材料内部の空間電荷測定」
本城 正人、丸田 真吾、田中 康寛、高田 達雄、渡邉 力夫(武蔵工大)
...139
「GPM/DPRプロジェクトで使用される熱制御材料の光電子放出電流の測定」
岡野 拓哉、山納 康、小林 信一(埼玉大)、仁田 工美(JAXA)
...143
「GPM/DPRプロジェクトで使用される熱制御材料の表面抵抗率・体積抵抗率の測定」
高橋 昌宏、山納 康(埼玉大)、仁田 工美(JAXA)、小林 信一(埼玉大)
...147
「電子線照射絶縁材料の導電率計測」
党 巍、田原 麻衣、田中 康寛、高田 達雄、渡邉 力夫(武蔵工大)
...151
「誘電体内部電荷蓄積に対する試料温度の影響」
福島 吉博、渡邉 力夫(武蔵工大)
...157
「PTFEフィルム内電荷蓄積過程のモンテカルロシミュレーション」
渡邉 力夫、田中 康寛(武蔵工大)
...170
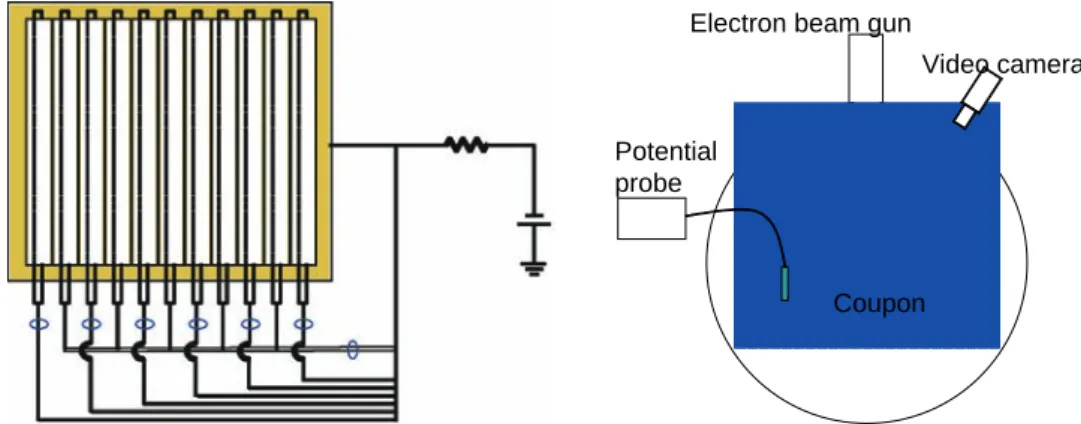
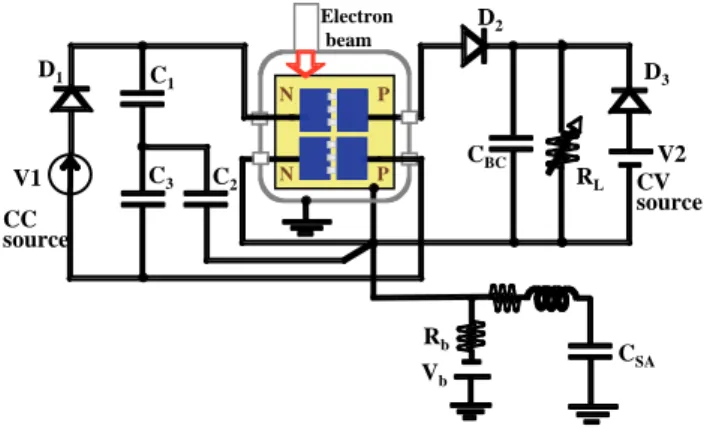
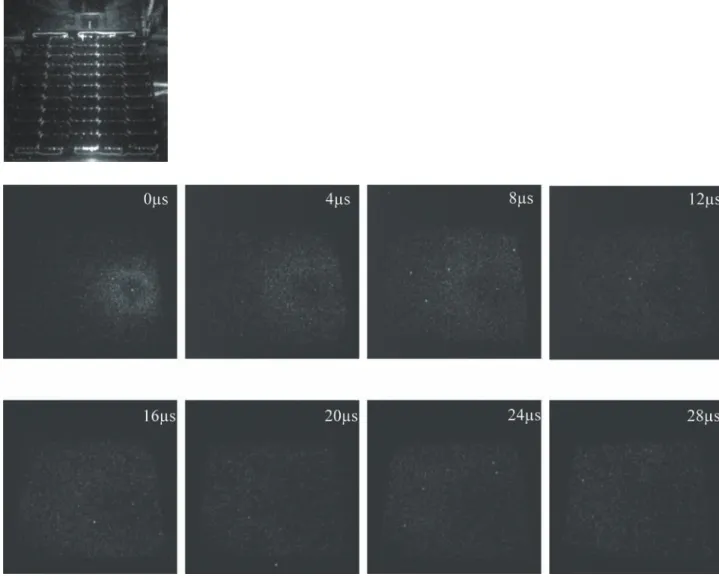
「宇宙用太陽電池の二次アークに対する安全作動条件取得試験(WG1)」
北村 倫基、野村 正行、増井 博一、豊田 和弘、趙 孟佑(九州工業大学)
...174
付録・講演プログラム
...180
特別講演
特集 1 衛星設計・試験の標準化作業の現状
Invited lecture for the 3rd Space Environment Symposium at Tsukuba in December 2006
Presentation of radiation environment activities at ONERA/DESP and collaboration with JAXA
Angelica Sicard-Piet
ONERA / DESP
2, Avenue Edouard Belin, 31055, Toulouse, Cedex 4, France e-mail: [email protected]
Abstract
In a first time, ONERA, the French Aerospace Laboratory, is presented and more particularly the missions of the Space Environment Department (DESP). The main DESP’s objective is to evaluate the environmental conditions of space mission and to prevent the damage they may cause. The test facilities for electronics and materials and for local environment effects are also presented.
Then, the activities on planetary radiation belts are described more in details: data coverage, data analysis (saturation, contamination), physical model Salammbô (Jupiter and Earth), the CRATERRE Project and the data assimilation.
Finally, the collaboration with JAXA is presented through the analysis of
DRTS/SDOM and MDS-1/SDOM data. Comparison between these Japanese data and other
international data are done. One of the results of this collaboration with JAXA is the
development of a new geostationary electron model, IGE-2006, based on Los Alamos
National Laboratory data and DRTS/SDOM data.
Presented by A. Sicard-Piet Research Scientist at ONERA/DESP
Toulouse, France
[email protected]
Presentation of radiation environment activities at ONERA/DESP and collaboration
with JAXA
Presentation of radiation environment activities at ONERA/DESP and collaboration
with JAXA
Office National d’Études et de Recherches Aérospatiales www.onera.fr
Third Space Environment Symposium – JAXA, Tsukuba Space Center
December 14, 15
Outline
What is ONERA ?
What are the missions of Space Environment Department (DESP)
• Areas of expertise
• Test facilities
• What can DESP perform?
Presentation of our activities on planetary radiation belts
• Data Analysis
• Physical modeling
Collaboration with JAXA
• MDS-1/SDOM
• DRTS/SDOM
Outline
What is ONERA ?
What are the missions of Space Environment Department (DESP)
• Areas of expertise
• Test facilities
• What can DESP perform?
Presentation of our activities on planetary radiation belts
• Data Analysis
• Physical modeling
Collaboration with JAXA
• MDS-1/SDOM
• DRTS/SDOM
ONERA (Office National d’Etudes et Recherches Aérospatiales) is the French national aerospace research center. It is a public research establishment, with eight major facilities in France and about 2,000 employees, including 1,500 scientists, engineers and technicians.
ONERA is organized in 17 scientific departments, grouped in four branches:
9Fluid Mechanics and Energetic 9Physics
9Materials and Structures
9Information Processing and Systems
What is ONERA?
What What is is ONERA? ONERA?
+ Wind Tunnel Facilities
Outline
What is ONERA ?
What are the missions of Space Environment Department (DESP)
• Areas of expertise
• Test facilities
• What can DESP perform?
Presentation of our activities on planetary radiation belts
• Data Analysis
• Physical modeling
Collaboration with JAXA
• MDS-1/SDOM
• DRTS/SDOM
DESP’s objective:
- To evaluate the environmental conditions of space missions and to prevent the damage they may cause.
Areas of expertise:
- To study and model the different components of the space mission environment and to evaluate the associated risks.
The work of DESP mainly covers:
¾the physical modeling of planetary radiation belts, engineering models (charged particles and solid micro-particle flows),
¾the satellite's interactions with its environment (contamination, effects of wakes, charging and discharging effects,...),
¾the vulnerability of electronic components and materials,
¾the design, calibration and operation of on-board
What are the missions of Space Environment Department (DESP)
What What are are the the missions missions of of Space Space Environment
Environment Department Department (DESP) (DESP)
Irradiation TEST Facilities for Electronics and Materials
Irradiation TEST Facilities Irradiation TEST Facilities for Electronics and Materials for Electronics and Materials
Nautilus : Shepherd 484 Cobalt Source + Cf 252 and Am241 and electronic test bench
Van de Graaff : Electron and Proton (max 1.5 MeV) + access to big particle accelerators (IPN/Orsay, UCL,
JYFL, PSI, GANIL, CPO ...)
SEMIRAMIS : Materials studies (UV, e-, p+)
For questions: [email protected]
SIRENE : simulation &
measurements of dielectric charging (simulation of GEO or MEO
environment : 10keV to 400keV)
Test Facilities
for local Environment effects Test Facilities
Test Facilities
for local Environment effects for local Environment effects
JONAS : for large solar cells coupons and ionospheric plasma simulation
For questions:[email protected]
What can DESP perform ? What can DESP perform ? What can DESP perform ?
Environment specification: different levels of refinement Tests of materials (UV + particles) with in situ optical characterization
• of electronics parts
• of charges-discharges
Particle detector calibration (Van de Graaff e- & p+ 2 MeV, Am)
Analysis of on board experiments (energetic particles, test beds) of anomalies
Studies for future technology (solar cells, opto electronic components, nanotech…)
France : CNES, SupAero, Universities, CNRS...
Europe : ESA/ESTEC , RAL, QinetiQ, Univ. of Southampton, Univ. of Kent, Max Planck institute, BIRA/IASB, etc..
USA : LANL, NASA (JPL, Goddard, Marshall), Aerospace Corporation, UCLA, Boeing ...
Japan : JAXA, CRL and Kyushu Institute of Technology Canada : Univ. of Toronto, ITL
Israel : Soreq
Russia : Moscow State University
DESP cooperation ?
DESP cooperation ?
DESP cooperation ?
Outline
What is ONERA ?
What are the missions of Space Environment Department (DESP)
• Areas of expertise
• Test facilities
• What can DESP perform?
Presentation of our activities on planetary radiation belts
• Data Analysis
• Physical modeling
Collaboration with JAXA
• MDS-1/SDOM
• DRTS/SDOM
Planetary magnetospheres:
( E v B )
q
F G G G G
∧ +
=
Radiation belts:
BounceTrapped particle trajectory
Bounce
Gyration
West East
Protons Drift Electrons
Mirror points
Planet Mercury Earth Jupiter Saturn Uranus Neptune
Obliquity to orbit (o)
0.01 23.5 3.1 26.7 97.8 28.3
Magnetic moment (G.Rp3)
0.0033 0.301* 4.28 0.21 0.228 0.142
Dipole tilt to rotation axis (o)
169 169.5* 9.6 < 1 58.6 46.9
Rp (km) 2439 6371 71398 60330 25600 24765
Activities on planetary radiation belts:
Introduction
Activities on planetary radiation belts:
Activities on planetary radiation belts:
Introduction
Introduction
IM GEO
HEO-GTO
MEO
LEO-PEO
High energetic protons and High energetic protons and electrons data available at electrons data available at
ONERA ONERA
Activities on planetary radiation belts:
Data Analysis
Activities on planetary radiation belts:
Activities on planetary radiation belts:
Data Analysis Data Analysis
Activities on planetary radiation belts:
Data Analysis
Activities on planetary radiation belts:
Activities on planetary radiation belts:
Data Analysis Data Analysis
Obtaining sanitized data
Electron data contamination• Contamination by proton
• Contamination by relativistic electrons
• Summary
Proton data contamination
• Contamination by relativistic electron
• Summary Saturation Background Signal to noise ratio Spacecraft charging bias Other problems
Obtaining coherent data
Inter-calibration based on trapped particle dynamics Inter-calibration based on SEP
Data analysis procedure (COSPAR PRBEM guidelines) Data analysis procedure (COSPAR PRBEM guidelines)
More information available @
http://wwwe.onecert.fr/craterre/prbem/home.html
File format (CDF)
: file name convention, global attributes, variablesActivities on planetary radiation belts:
Data Analysis
Activities on planetary radiation belts:
Activities on planetary radiation belts:
Data Analysis Data Analysis
Example of contamination Example of contamination
of electrons by protons of electrons by protons
Mev-1.cm-2.sr-1.s-1)Mev-1.cm-2.sr-1.s-1)L value
LANL-1994-084 Ele 500-750 keV Ele 1.1-1.5 MeV
GPS-ns33Ele>0.40 MeV
Contamination
Contamination
GOES Pro 39-82 MeV Pro 110-500 MeV
Activities on planetary radiation belts:
Data Analysis
Activities on planetary radiation belts:
Activities on planetary radiation belts:
Data Analysis Data Analysis
All data
Results of decontamination Results of decontamination
SAC-C Ele 1.24-1.60 MeV
Example of saturation problem Example of saturation problem
L Value
GPS NS24/BDD2 Ele > 0.28 MeV
⇒Saturation: Flux limited to a certain value while percentage of points increases
Saturation
Activities on planetary radiation belts:
Physical model: Salammbô
Activities on planetary radiation belts:
Activities on planetary radiation belts:
Physical model:
Physical model: Salammbô Salammbô
Radiation belts of Jupiter Radiation belts of Jupiter
Physical model based on the different physical processes which occur in the Jovian radiation belts: interaction with rings and moons, interaction with atmosphere and ionosphere, synchrotron radiation (for electrons), charge exchange (for ions), radial
diffusion of the particles…
Comparison of Salammbô results with measurements
-2 0
4 2 0 -2 -4 0
500 1000
Tb (Kelvin)
Salammbô simulation (max = 1264 K) 2
1424 MHz λIII(CML)=20°
-2 0
4 2 0 -2 -4 0
500 1000
Tb (Kelvin)
Salammbô simulation (max = 1264 K) 2
1424 MHz λIII(CML)=20°
2
-2 0
4 2 0 -2 -4 0
500 1000
Radius (Rj)
Radius (Rj) Tb(Kelvin)
VLA Observation (max = 1269 K) 2
-2 0
4 2 0 -2 -4 0
500 1000
Radius (Rj)
Radius (Rj) Tb(Kelvin)
VLA Observation (max = 1269 K)
Salammbô Proton > 30 MeV (cm-2s-1)
Activities on planetary radiation belts:
Salammbô model and data assimilation:
CRATERRE project
Activities on planetary radiation belts:
Activities on planetary radiation belts:
Salammbô
Salammbô model and data assimilation: model and data assimilation:
CRATERRE project CRATERRE project
Data base inter-calibrated
sanitized
Dynamic Salammbô
code
Empirical inputsDirect assimilation
LANL GEO series LANL GEO
series
GOES series GOES series
HEO series HEO series
POLAR GPS series GPS series DRTS
DRTS XMM XMM N-POES
series N-POES
series SAC-C GLONASS
series GLONASS
series
GEO HEO MEO GTO LEO
MDS1 CRRES MDS1
CRRES DEMETER
Ensemble Kalman filter Radiation belts of the Earth
Radiation belts of the Earth http://wwwe.onecert.fr/craterre/home.html
Activities on planetary radiation belts:
Physical model Salammbô and data assimilation
Activities on planetary radiation belts:
Activities on planetary radiation belts:
Physical model
Physical model Salammbô Salammbô and data assimilation and data assimilation
Radiation belts of the Earth Radiation belts of the Earth
Salammbô with GPS_ns33 and LANL_1994_084
SAC_C data
Kp index
Salammbô with LANL_1994_084 only
L ValueL ValueL Value 2 4 6 8
2 4 6 8
2 4 6 8
0 4.5 9
Kp Mev-1.cm-2.sr-1.s-1Mev-1.cm-2.sr-1.s-1Mev-1.cm-2.sr-1.s-1103
104 105 105 106 107 105 106 107
Ele 0.4 MeV
Ele 0.4 MeV
Ele 0.39-0.45 MeV
For questions: [email protected] [email protected]
Outline
What is ONERA ?
What are the missions of Space Environment Department (DESP)
• Areas of expertise
• Test facilities
• What can DESP perform?
Presentation of our activities on planetary radiation belts
• Data Analysis
• Physical modeling
Collaboration with JAXA
• MDS-1/SDOM
SAC-C/ICARE Electron 0.59-0.65 MeV
MDS1/SDOM Electron 0.40-0.91 MeV
⇒ Electron fluxes in radiation belts are higher in MDS1 data because of the orbit (more equatorial)
Comparison with SAC
Comparison with SAC- -C/ICARE data C/ICARE data
105
L
7.25.5
3.9
1.5
L
7.25.5
3.9
1.5
104
103
102 107
106
105
104 Flux (MeV-1.cm-2.s-1.sr-1)Flux (MeV-1.cm-2.s-1.sr-1)
27 Feb 2002 30 Jul 2002 31 Dec 2002
⇒ Global coherence between the two instruments (same dynamics of electron radiation belts)
Magnetic storms
Collaboration with JAXA
MDS-1 / SDOM
Collaboration with JAXA Collaboration with JAXA
MDS MDS - - 1 / SDOM 1 / SDOM
Comparison with SAC
Comparison with SAC- -C data C data
8.2 101SAC-C/ICARE
Proton 9.65-11.35 MeV
MDS1/SDOM Proton 6.6-15.0 MeV
100
10-1
10-2 101
100
10-1 Flux (MeV-1.cm-2.s-1.sr-1)Flux (MeV-1.cm-2.s-1.sr-1) 10-2 8.2
6.1
4.1
2.0
6.1
4.1
2.0
101
L
L
GOES-08
⇒ Global coherence between the two instruments (solar protons events are seen by both)
Solar flares
Collaboration with JAXA
MDS-1 / SDOM
Collaboration with JAXA Collaboration with JAXA
MDS- MDS -1 / SDOM 1 / SDOM
Contamination problems ? Contamination problems ?
8.2
6.1
104
SAC-C/ICARE Electron 1.24-1.60 MeV
MDS1/SDOM Electron 0.9-2.0 MeV
⇒ MDS1/SDOM is one of the few satellites which really measured electrons in the inner radiation belt (L < 2)
GOES- 08 protons
L
8.2
6.1
4.1
2.0
L
8.26.1
4.1
2.0
100 10-2 10-4
Flux (MeV-1.cm-2.s-1.sr-1)
104
103
102
103 106
105
104 Flux (MeV-1.cm-2.s-1.sr-1)Flux (MeV-1.cm-2.s-1.sr-1) 101
01 Jun 2002 16 Jul 2002 30 Aug 2002
Solar proton events Contamination by protons
Collaboration with JAXA
MDS-1 / SDOM
Collaboration with JAXA Collaboration with JAXA
MDS MDS - - 1 / SDOM 1 / SDOM
⇒ Only one electrons channel out of 4 what exists can be easily use :0.59- 1.18 MeV
Comparison of DRTS/SDOM electrons flux with LANL electrons flux Comparison of DRTS/SDOM electrons flux with LANL electrons flux
⇒ Comparison of DRTS/SDOM electrons measurements after cross calibration with LANL-97A/SOPA electrons measurements (longitude of the two spacecraft are nearly the same: ~ 90°).
2003/01/29 2003/01/30 2003/01/31 2003/02/01
101 102 103 104 105 106
Date Flux (cm-2.sr-1.s-1.MeV-1)
LANL_LANL_97A DRTS
⇒ Good agreement between DRTS/SDOM and LANL-97A/SOPA electrons measurements
LANL-97A (0.5-1.1 MeV) DRTS (0.59-1.18 MeV)
Collaboration with JAXA
DRTS / SDOM
Collaboration with JAXA Collaboration with JAXA
DRTS / SDOM
DRTS / SDOM
Problem of contamination
Problem of contamination
101Flux (cm-2.s-1.sr-1MeV-1) 100 10-1
10-2 10-3 10-4
100 102 104 106
Proton 80-165 MeV Proton 165- 500 MeV
Electron 6.33- 10.85 MeV Electron 0.34-0.85 MeV Electron 0.59-1.18 MeV Electron 1.51- 5.72 MeV
GOES
DRTS
22/10/2003 02/11/2003 date
⇒ The two last electrons channels are contaminated by high energy protons during solar flares
Contamination
Collaboration with JAXA
DRTS / SDOM
Collaboration with JAXA Collaboration with JAXA
DRTS / SDOM DRTS / SDOM
Collaboration with LANL and JAXA
DRTS / SDOM
Collaboration with LANL and JAXA Collaboration with LANL and JAXA
DRTS / SDOM DRTS / SDOM
New model of electron fluxes at geostationary orbit: IGE New model of electron fluxes at geostationary orbit: IGE- -2006 2006
LANL/CPA (Charged Particle Analyzer) 30 keV-2 MeV with 12 differential channels from 1976 to 1988
- LANL/SOPA (Synchronous Orbit Particle Analyzer) : 50 keV-1.5 MeV with 9 differential channels since 1989
- LANL/ESP (Energetic Spectra for Particles) : 0.70 - 6 MeV with 6 differential channels since 1996
This model is based on more than 25 years of data essentially from LANL
spacecraft but also from DRTS spacecraft.
Electrons fluxes come from 3 instruments on LANL spacecraft and 1
instrument on DRTS:
0 50 100 150 200 250 300
janv-76 janv-80 janv-84 janv-88 janv-92 janv-96 janv-00 janv-04 1987-097
1989-046 1990-095
1991-080 1994-084
LANL-97A LANL-01A
LANL-02A
LANL/CPA 1979-053
1981-025
1982-019 1984-037
1984-129
LANL/SOPA LANL/ESP 1977-007
1976-059
DRTS/SDOM DRTS
0 50 100 150 200 250 300
janv-76 janv-80 janv-84 janv-88 janv-92 janv-96 janv-00 janv-04 1987-097
1989-046 1990-095
1991-080 1994-084
LANL-97A LANL-01A
LANL-02A
LANL/CPA 1979-053
1981-025
1982-019 1984-037
1984-129
LANL/SOPA LANL/ESP 1977-007
1976-059
DRTS/SDOM DRTS
Collaboration with LANL and JAXA
DRTS / SDOM
Collaboration with LANL and JAXA Collaboration with LANL and JAXA
DRTS / SDOM DRTS / SDOM
1,E-03 1,E-02 1,E-01 1,E+00 1,E+01 1,E+02 1,E+03 1,E+04 1,E+05 1,E+06
-7 -5 -3 -1 1 3 5
year of solar cycle (min = 0)
Flux (keV-1.cm-2.sr-1.s-1)
0.03 MeV 0.05-0.075 MeV 0.075-0.105 MeV 0.105-0.150 MeV 0.150-0.225 MeV 0.225-0.315 MeV 0.315-0.5 MeV 0.5-0.75 MeV 0.75-1.1 MeV 1.1-1.5 MeV 1.8-2.2 MeV 2.2-2.7 MeV 2.7-3.5 MeV 3.5-4.5 MeV 4.5-6.0 MeV
Electrons flux in function of the year of the solar cycle Electrons flux in function of the year of the solar cycle
⇒ There is more than a factor 10 between min and max electrons flux for the highest energy (5.2 MeV).
Collaboration with LANL and JAXA
DRTS / SDOM
Collaboration with LANL and JAXA Collaboration with LANL and JAXA
DRTS / SDOM DRTS / SDOM
1,E-03 1,E-02 1,E-01 1,E+00 1,E+01 1,E+02 1,E+03 1,E+04 1,E+05 1,E+06
10 100 1000 10000
Energy (keV)
Flux (kev-1.cm-2.sr-1.s-1)
POLE mean case POLE worst case POLE best case AE8 200 deg 1,E-03
1,E-02 1,E-01 1,E+00 1,E+01 1,E+02 1,E+03 1,E+04 1,E+05 1,E+06
10 100 1000 10000
Energy (keV)
Flux (kev-1.cm-2.sr-1.s-1)
IGE mean case IGE worst case IGE best case AE8 200 deg
Electrons flux over a solar cycle (11 years) Electrons flux over a solar cycle (11 years)
⇒Differences between IGE and AE8:
- low energy : IGE > AE8
Conclusions Conclusions Conclusions
Questions on DESP activities: [email protected] Virtual Observatory available at ONERA with many data
Activities of my team : 50% model and 50% data analysis
Efforts on data assimilation to develop specification model for space environment : (Salammbô model + data analysis)
New specification models with international collaboration:
9
LANL-JAXA-ONERA (CNES) for IGE 2006 model
9
LANL-ONERA (CNES) for MEO model (based on GPS data)
MEASUREMENT OF NEAR EARTH RADIATION ENVIRONMENT IN JAXA - OVERVIEW AND PLAN -
Tateo Goka, Haruhisa Matsumoto
Japan Aerospace Exploration Agency, Sngen 2-2-1, Ibaraki, 305-8505, Japan ABSTRACT
The current status of measuring radiation using JAXA satellites is reviewed. Starting with Engineering Test Satellite-V (ETS-V; KIKU-5 in Japanese) in 1987, efforts to conduct radiation measurements in space have continued using almost all Japan Aerospace Exploration Agency (JAXA formerly NASDA) satellites (ETS-VI, ADEOS, ADEOS-II, MDS-1, DRTS (ongoing), and ALOS (ongoing)), in geostationary orbit (GEO), geostationary -transfer orbit (GTO), and low-Earth orbit (LEO). Electrons, protons, alpha particles, and heavy ions have been the main objects of study. Future plans for radiation monitoring in JAXA, including GOSAT, Jason-2 (in collaboration with CNES), SmartSat (in collaboration with NICT), and ISS/JEM/Exposure Facility/SEDA-AP, are presented.
1. Introduction
JAXA (formerly NASDA) developed TEDA (Technical Data Acquisition Equipment), which is able to measure the space radiation environment and its effects on newly developed electronic devices onboard a satellite. TEDA was designed to acquire engineering data useful to the design of future spacecraft, to diagnose the anomalies encountered on orbit, and to collect data to make new radiation belt models (electrons, protons, and alpha particles) to augment NASA radiation belt models. TEDA is composed of various instruments for every spacecraft mission. TEDA was reviewed by two papers, Khno (1996) and Fukuda et al. (1996) almost ten years ago. This paper reviews current TEDA instruments and data over the past ten years, and presents our future measurement plan.
II. TEDA Post-Flight Measurement Data
TEDA instruments have flown on board ten spacecraft (Table 1). All measured data are available on the SEES (Space Environment and Effects System) website (http:// sees.tksc. jaxa.jp/).
Table 1: Spacecraft carrying TEDA
ETS-V ETS-ⅥADEOS ETS-ⅦShuttlADEOSⅡDRTS ISS MDS-1 ALOS
1987 1994 1996 1997 1998 2002 2002 2002 2002 2006
GEO GTO LEO LEO LEO LEO GEO LEO GTO LEO
36k 8k-38k 800 500 400 800 36k 400 250-36k 700
DOM DOse Monitor ◎ ◎ ◎ ◎ ◎
HPM High energy Particle Monitor ◎
LPT Light Particle Telescope ◎
HIT Heavy Ion Telescope ◎ ◎ ◎ ◎
DOS DOSimeter (RadFET) ◎ ◎ ◎ ◎
MAM Magneto Meter ◎ ◎
AOM Atomic Oxygen Monitor ◎
NEM NEutron Monitor ◎ ◎
PLA Plasma Monitor
POM POtential Monitor ◎ ◎ ◎ DIM DIscharge Monitor ◎
SUM Single event Upset Monitor ◎ ◎ ◎ ◎ ◎
ICM Integrated Circuit Monitor ◎ ◎ SCM Solar Cell Monitor ◎ ◎ COM COntamination Monitor ◎ ◎ ◎
Spacecraft Launch
Orbit Altitude
Fig. 1: POM/ETS-V measured data
2.1 KIKU-5 (Engineering Test Satellite-V) (GEO, longitude: 150 deg. E)
A dose monitor (DOM) composed of two silicon detectors was installed on this satellite (Khno (1996) and Fukuda et al. (1996)). The measurement data were gathered from August 1987 to September 1997 (ten years). Single-event latch up data acquired by a Single-Event Upset Monitor (SUM) were reported for the first time (Goka, et al., 1991).
The Potential Monitor (POM) measures differences electrostatic potential on the surface of
spacecraft. Figure 1 presents the POM instrument measured data for ten years. Three samples
(Teflon (lowest), Kapton (highest), and OSR (middle in y axis)) were mounted on the POM. The electric field leaking from an aperture of each sample was modulated by a chopper at 1 kHz, and the electrostatic electrode detected the weak electric field.
2.2 KIKU-6 (Engineering Test Satellite-VI) (GTO: perigee 8,600 km, apogee 38,600 km)
A DOM composed of six silicon detectors and a Magnetometer (MAM) were installed on this satellite.
The data were gathered from August 1994 to July 1996. The measurement data were mainly reported in three papers, (Goka et al.,1996). We made the first empirical radiation belt models (electrons, protons, and alpha particles in a solar minimum period) by using this data and scientific satellite AKEBONO data (Goka et al., 1999).
2.3 MIDORI (Advanced Earth Observing Satellite (ADEOS)) (LEO-POLAR: altitude: 800 km, inclination:
98.6 deg.)
A DOM and a Heavy Ion Telescope (HIT) were installed on this satellite. The data were gathered from August 1996 to July 1997. The HIT measured the interplanetary anomalous cosmic ray (ACR), oxygen, and nitrogen, with results quite similar to those of SAMPEX (Figure 2) (Kohno et al., 1998).
Fig. 2: Geographic distribution of oxygen and elemental
distribution of trapped Anomalous Cosmic Ray (O, N, C, Ne) Fig. 3 : Electron Flux (0.4-0.9MeV) L-t Diagram observed by MIDORI /HIT(kohno et al., 1998).
2.4 MIDORI-2 (ADEOS-2) (LEO-POLAR: altitude 800 km, inclination 98.6 deg.)
A DOM was installed on this satellite; data were gathered from December 2002 to September 2003(Kimoto t al., 2002). The DOM data were used for diagnosis of the ADEOS-2 total loss anomaly (Goka et al., 2005).
2.5 TSUBASA (Mission Demonstration Satellite (MDS-1)) (GTO: perigee 500 km, apogee 36,000 km) A Standard Dose Monitor (SDOM)(Matsumoto et al., 2001), a HIT, and a MAM were installed on this satellite. The data were gathered from February 2002 to September 2003. There are many reports on these data (Goka et al., 2002, Koshiishi et al., 2002, Kimoto et al., 2003).
Fig. 4 : Proton Flux (1-1.5MeV) L-t Diagram Fig. 5: Comparison between MDS-1 Observed Energy Spectrum and NASA Model
The SDOM measurement results are given in Figures 3 and 4. The electron flux (0.4-0.9 MeV)
L
Feb.2002 1 Year Feb.2003
105 106 107 108 109 1010 1011
1 10
MDS-1 observed NASA (AE-8) model
Energy [MeV]
103 104 105 106 107 108 109 1010 1011
1 10 100
MDS-1 observed NASA(AP-8) model
Energy [MeV]
Electron Proton
Flux
Feb.2002 1 Year Feb.2003
L
McIlwain’s L-value ranging from L=1 to 9, and the horizontal axis gives time covering one year, starting in February 2002. Figure 5 depicts the observed and averaged electron (right) and proton (left) energy spectra, compared to the spectra calculated from the NASA AE-8 MAX (Vette et al., 1991) and AP-8 MAX (Sawer et al., 1991) models, the fluxes of which were integrated along all data points of the MDS-1 orbit. The measured averaged proton fluxes were ten times lower than those of the AP-8 MAX model for energy levels below 20 MeV. However, we found that both electron and proton fluxes were broadly consistent with AE-8 MAX and AP-8 MAX models on the geomagnetic equator (Matsumoto et al., 2006).
2.6 KODAMA (Data Relay Test Satellite; DRTS) (GEO; longitude 90.75 deg. E)
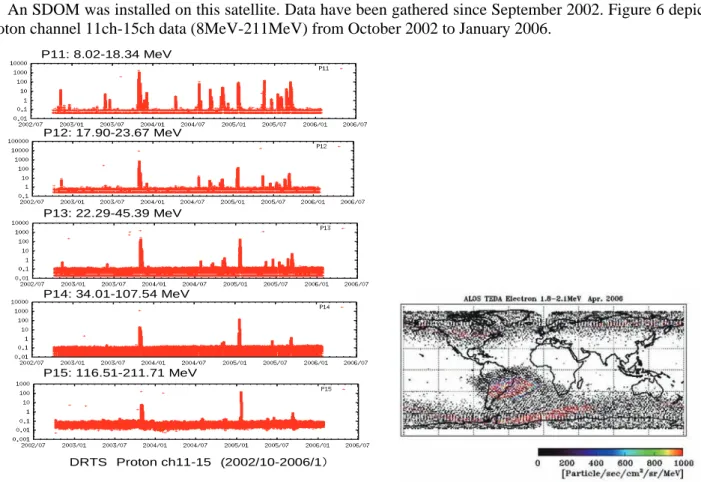
An SDOM was installed on this satellite. Data have been gathered since September 2002. Figure 6 depicts proton channel 11ch-15ch data (8MeV-211MeV) from October 2002 to January 2006.
P11: 8.02-18.34 MeV
P12: 17.90-23.67 MeV
P13: 22.29-45.39 MeV
P14: 34.01-107.54 MeV
P15: 116.51-211.71 MeV
DRTS Proton ch11-15 (2002/10-2006/1)
Fig. 6: Proton Ch. 11-15 (8-211MeV) data from October
2002 to January 2006, obtained by DRTS/SDOM Fig. 7: LPT (ALOS) Electron (1.8-2.1MeV) 1month data on a world map.
2.7 DAITI (ALOS) (LEO-POLAR: altitude 690 km, inclination 98 deg.)
TEDA consists of a Light Particle Telescope (LPT) and a HIT. Data have been gathered since February 2006. Figure 7 shows electron (1.8-2.1MeV) 1 month data on a world map, respectively.
These data cleary the increased flux in the South Atlantic Anomaly (SAA).
III. TEDA Future Plan
JAXA are planned to be flown on various missions in the following years. Table 2 lists the confirmed TEDA mission to date.
4.1 Engineering Test Satellite-VIII (ETS-8) (GEO, longitude 146 deg. E)
ETS-8 will be launched in December 2006. TEDA has four components: a MAM, a POM, a DOM, and
a SUM. The MAM, a fluxgate magnetometer, was placed on the upper antenna tower. The measurement
range was 256, 1024, 4096, and 65536 nT, the same range as that of ETS-6. The POM instrument was the
same instrument as ETS-V,-VI, and ADEOS, except samples. Three cover glasses (BRR/s-0213, CMX-BRR,
and CMG-AR) were selected for ETS-8.
Table 2. Planned TEDA Mission Plan
ETS-8 Jason-2 GOSAT SmartSatISS/JEM
2006 2008 2008 2008-
2009 2008-2009
GEO LEO LEO GTO LEO
36k 1.3k 666 400
DOM DOse Monitor ◎
HPM High energy Particle Monitor
LPT Light Particle Telescope ◎ ◎ ◎
HIT Heavy Ion Telescope ◎ ◎
DOS DOSimeter (RadFET) ◎ MAM Magneto Meter ◎
AOM Atomic Oxygen Monitor ◎
NEM NEutron Monitor ◎
PLA Plasma Monitor ◎
POM POtential Monitor ◎ DIM DIscharge Monitor
SUM Single event Upset Monitor ◎ ◎
ICM Integrated Circuit Monitor ◎
SCM Solar Cell Monitor COM COntamination Monitor
Spacecraft Launch
Orbit Altitude
4.2 Greenhouse Gases Observing Satellite (GOSAT) (LEO, Polar)
GOSAT will be launched in mid-2008 into sun-synchronous sub-recurrent orbit with an altitude of 666km and an inclination of 98deg. The nominal lifetime will be five years. TEDA is composed of an LPT and a HIT. The LPT measures electron, proton, and alpha particles, and identifies the types of particles and energy. It is composed of four instruments (LPT1~4). LPT1 and LPT2 have the same configuration, composed of ELS-A, ELS-B, APS-A, and APS-B; but LPT1 and LPT2 have different fields of view. LPT3 is composed of three ELS-As and three APS-As. LPT4 is composed of APS-C.
Each LPT is composed of compact and high-performance sensors (Table 3). LPT3 has three fields of view to observe the distribution of pitch angle of particle flux with a geomagnetic field.
Table 3 : Sensors used in LPT
Sensor Energy range
ELS-A Electron: 30keV~1.3MeV, 1.3MeV<
ELS-B Electron: 280keV~20MeV APS-A Proton: 400keV~37MeV,
Alpha: 3MeV~16MeV APS-B Proton: 1.5MeV~250MeV,
Alpha: 20.7MeV~400MeV APS-C Proton: 100MeV~500MeV,
Alpha: 25MeV/n~500MeV/n