Doctoral Thesis
Population genetic structure and genetic diversity of the Japanese lentic salamanders for conservation of
endangered Hynobius
Hirotaka Sugawara
Department of Biology Tokyo Metropolitan University
Tokyo
Japan
March in 2015
Contents
Abstract ---1 1. General introduction ---3 2. Study species ---6
2-1. Tokyo salamander 2-2. Oita salamander
3. Molecular phylogenetic analysis of Japanese lentic Hynobius ---12 3-1. Introduction
3-2. Materials and methods 3-2-1. Sampling
3-2-2. Mitochondrial DNA analysis 3-3. Results
3-4. Discussion
4. Population genetic structure and genetic diversity of Tokyo salamander ---19 4-1. Introduction
4-2. Materials and methods 4-2-1. Sampling
4-2-2. Mitochondrial DNA analysis 4-2-3. Microsatellite DNA analysis 4-3. Results
4-3-1. Mitochondrial DNA analysis 4-3-2. Microsatellite DNA analysis 4-3-3. Genetic diversity
4-4. Discussion
4-4-1. Local genetic divergence and conservation 4-4-2. Genetic diversity and conservation
5. Population genetic structure and genetic diversity of Oita salamander ---47 5-1. Introduction
5-2. Materials and methods 5-2-1. Sampling
5-2-2. Mitochondrial DNA analysis 5-2-3. Microsatellite DNA analysis 5-3. Results
5-3-1. Mitochondrial DNA analysis
5-3-2. Microsatellite DNA analysis
5-3-3. Genetic diversity 5-4. Discussion
6. General discussion ---65 6-1. Genetic monitoring
6-2. Management unit 6-3. Genetic diversity 6-4. Genetic pollution
7. Acknowledgements ---72 8. References ---73 9. Appendices ---87 9-1. Publications
9-2. Title and summary in Japanese
1 Abstract
Salamanders are expected to differentiate genetically among local populations because they have low dispersal ability. Thus, they are potentially susceptible to loss of genetic diversity if the populations are isolated by habitat fragmentation. In addition to these factors, the urban neighborhood-dwelling species can be strongly affected by several human activities, and an immediate conservation is needed. In conservation of these species in the wild, there are three problems to solve before conservation activities: (1) taxonomic, (2) ecological, and (3) genetic problems. Especially, to clarify the four genetic matters is a great help in appropriate conservation planning: (1) genetic monitoring, (2) management unit, (3) genetic diversity, and (4) genetic pollution. In the present study, the analyses of population genetic structure including the four genetic matters are performed using both mitochondrial and microsatellite DNAs for the future conservation of the urban neighborhood-dwelling salamanders, Hynobius tokyoensis (mainly distributed in the Kanto District) and H. dunni (mainly distributed in the eastern Kyusyu).
Japanese lentic Hynobius species may contain cryptic diversity and most species of this genus are generally difficult to identify without information on sample locality because of their morphological similarities. In conservation of these species, many inappropriate conservation decisions can be made if the taxonomic status is incorrect.
To solve the problems, phylogenetic relationships of them were examined for 55 populations including ten lentic Hynobius species using mitochondrial 16S rRNA (1103-bp) and cytochrome b (630-bp) genes. As a result, populations were clearly separated into eastern Japan group and western Japan group with high bootstrap values.
H. nebulosus may be polyphyletic species despite it may be monophyletic species based on morphological characters, but monophyly of H. tokyoensis is supported by some previous studies and the present study. Also, Kyushu populations of H. dunni may be monophyletic group, but Kochi population of H. dunni was genetically different from them. Thus, taxonomic and phylogenetic reassessment of H. nebulosus and Kochi population of H. dunni using high variable nuclear markers are needed.
The salamander Hynobius tokyoensis is a lowland lentic breeder and endemic to the
narrow area of central Japan. In this urban area, their habitats are extensively
fragmented and several populations are threatened with extinction. Genetic management
of this salamander is now needed, but information on genetic divergence and loss of
genetic diversity is little available. So, mitochondrial cytochrome b (650-bp) gene and
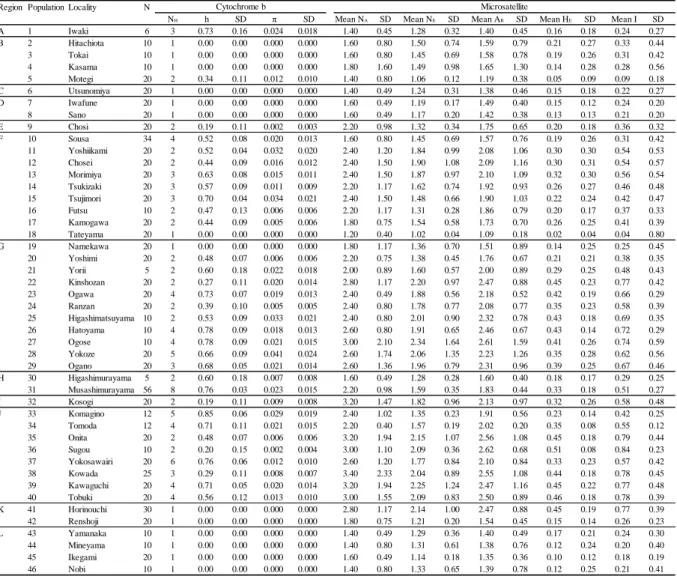
microsatellite (five loci) DNA analyses were made for 815 individuals from 46
2
populations in the 12 regions across their entire distribution range. As a result, populations were clearly separated into northern and southern groups, and genetic differentiation among 12 regions was also evident. Regional genetic differentiation seems to be affected by complicated geographical history, but genetic diversity of each population may be affected by recent habitat fragmentation. Some populations have lost genetic diversity in both mitochondrial and microsatellite DNAs because a positive correlation was detected between the mitochondrial and microsatellite DNA diversities.
However, female-biased bottleneck effects were also evident in several populations in which mitochondrial DNA diversity was more reduced than microsatellite DNA diversity. Even if we need recovery of the genetic diversity in a small population by transferring other individuals, particularly the females, we must pay attention to avoid genetic pollution.
Oita salamander Hynobius dunni Tago, 1931, endemic to eastern Kyushu and western Shikoku of southwestern Japan, is a lowland lentic breeder and has declined its distribution range. To contribute to the future conservation of this salamander, current population genetic structures and genetic diversities were examined for 12 populations of eastern Kyushu, by using a mitochondrial cytochrome b (569-bp) gene and three microsatellite loci. As a result, populations were genetically separated into northern and southern groups , and there were some genetic differences even in the northern regions based on microsatellite analysis. The southern group was restricted to the narrow area and had low genetic diversity in both mitochondrial and microsatellite DNAs. In the northern group, the mitochondrial and microsatellite DNA diversities were also low in some peripheral populations. Toward the accurate genetic management of this species, we must pay more attention to such genetic differentiation and diversity in a fine scale.
The two salamander species have larger genetic differences among breeding sites
and these populations are expected to conserve separately. However, closely related
populations may justify management as single unit. Genetic diversities of the two
species tended to decrease around the periphery of distribution range and completely
isolated populations. The genetic pollution should be carefully examining when
introduction to the inbred populations from other non-inbred populations for the
resurrection of their genetic diversity.
3 1. General introduction
The biological diversity of the earth is being rapidly decreased as a direct or indirect consequence of human activities (Frankham et al. 2002). A large number of species are already extinct and many other species have also reduced population sizes (World Conservation Monitoring Centre 1992). Currently, many species of the world require appropriate human intervention to improve their management (Frankham et al.
1999). According to Leakey and Lewin (1995), current extinction problem has been called the ‘sixth extinction’, as its magnitude compares with other five mass extinctions.
Extinction is a natural evolutionary process (e.g. mass extinction at the end of Cretaceous 65 million years ago ) , but the sixth extinction is different because species are being lost rapidly that outruns the birth of new species (Frankham et al. 2002). In response to these situations, International Union for Conservation of Nature and Natural Resources (IUCN) recognizes the need for conservation of three diversity levels (i.e.
species diversity, ecological diversity, and genetic diversity) (IUCN 2014). According to research conducted by IUCN (2014), threatened species of animals fall into one of the three categories (i.e., critically endangered (CR), endangered (EN), and vulnerable (VU)), and classified more than 10% of species in every one of the vertebrate taxa:
Mammalia = 21.7%, Aves = 13.2%, Reptilia = 21%, Amphibia = 30.5%, fishes (Pisces)
= 17.8%. Especially, class Amphibia has over 30% threatened taxon and is declining and disappearing worldwide at an increasing rate as compared to pre-1980 decades, even in protected areas (Blaustein and Wake 1990; Stuart et al. 2004). Basically, amphibians are susceptible to environmental change derives from some basic amphibian characteristics: (1) relatively small body size, (2) ectothermic physiology, (3) limited capacity for migration, (4) highly permeable skin, and (5) dependence on aquatic or moist habitats (Murphy et al. 2000). However, many declines cannot be explained by only these characteristics. Scientists have hypothesized six major threats: (1) habitat modification and destruction, (2) commercial over-exploitation, (3) introduced species, (4) environmental contaminants, (5) global climate change, and (6) emerging infectious diseases (e.g. Batrachochytrium dendrobatidis) (Collins and Storfer 2003). Most agree the primary threat is (1) (i.e., habitat modification and destruction) among six major hypotheses (Crump 2010).
Japanese Hynobius species can be divided into still-water breeding type and
running water breeding type (Sato, 1943). The species of former type mainly inhabit the
lowland areas, and also found around human dwellings. The urban
neighborhood-dwelling species, H. tokyoensis and H. dunni, can be strongly affected by
4
human activities, and an immediate conservation is needed. In conservation of these species, we should resolve the major three problems before conservation activities. First, we need to resolve the taxonomic problems. Incorrect ‘lumping’ of several distinct species into one recognized species or ‘splitting’ of one species into two or more recognized taxa may lead to erroneous conservation decisions (Frankham et al. 2002).
Therefore, we need to reveal the taxonomic status and phylogenetic relationships among populations. Second, we also need to resolve the ecological problems. Limited life history and long-term population monitoring data exist for most wild populations, so to predict the population viability may not be possible (Frankham et al. 2002). To conduct the effective conservation, information of species life histories and evidence of decreasing the population size are essential. Third, genetic problems are also important for conservation of wild populations. Genetically differentiated populations within species should be managed separately (Moritz 1995). To conduct the management, we should understand the fine-scale population genetic structure (e.g., phylogenetic relationships among populations, gene flow among populations, genetic diversity, etc.).
Genetics is involved directly in the first of these and is a crucial factor in species conservation (Frankham et al. 2002). Four primary questions are asked when seeking to conserve the endangered species. First, genetic monitoring using some genetic markers (e.g. mitochondrial or microsatellite DNAs) is important to clarify the demography or more complex evolutionary and ecological processes (Schwartz et al. 2007). Schwartz et al. (2007) separate the genetic monitoring into two categories. Category I includes the spatial population monitoring through the identification of individuals, populations, species, and other taxonomic levels, whereas category II includes the temporal population monitoring with several genetic parameters. Currently, many studies of the fine-scale spatial genetic monitoring using variable microsatellite markers have been conducted on salamander species around the world (e.g., Pabijan and Babik 2006;
Mullen et al. 2010; Chen et al. 2012; Blank et al. 2013; Unger et al. 2013; Sunny et al.
2014). In Japanese salamander species, there are several studies on population genetic structure using mitochondrial DNA (e.g., Matsui et al. 2008; Sakamoto et al. 2009; Aoki et al. 2013), but investigations of fine-scale population genetic structure using variable microsatellite markers are absent. Second, populations within a species may justify management as separate units if they have a unique genetic structure (Moritz 1995).
Also, to avoid the outbreeding depression, defining management units within species or
species is essential (Moritz 1995). The estimations of management unit on the Japanese
salamander species have been conducted by the mitochondrial or nuclear DNAs (e.g.,
Honda et al. 2012; Tominaga et al. 2013). However, the information may be insufficient
5
to estimate the management unit within species, because genetic variations of
mitochondrial and nuclear DNAs are usually not enough. Third, environmental change
is a continuous process and genetic diversity is essential for populations to evolve to
adapt against several environmental fluctuations (Frankham et al. 2002). Furthermore,
loss of genetic diversity is often associated with inbreeding and reduction in
reproductive fitness (Frankham et al. 2002). Thus, assessment of genetic diversity is a
primary objective in the management of threatened species (Frankham et al. 2002). In
Japanese lentic Hynobius species, assessment of genetic diversity on local populations
was also conducted using several mitochondrial DNA genes (e.g., Yamane and Nishida
2010; Azuma et al. 2013). Forth, genetic pollution is also important factor for
conservation, and it is flow of genes from one species (sub-species or population) to
another (Ellstrand 2001; Potts et al. 2003). Typically, hybridizations occur when humans
introduce exotic populations (or species) into the range of threatened populations
(Ellstrand et al. 1999). This phenomenon is a threat to the genetic integrity on several
species (Rhymer and Simberloff 1996). In Japan, there are no evidences of genetic
pollution on the urban neighborhood-dwelling salamanders. However, urban
neighborhood areas have a high potential for occurrence of genetic pollution. Finally,
the aim of this study is to answer of these four genetic matters (i.e., (1) inference of
spatial population genetic structure using the method of genetic monitoring with
mitochondrial and microsatellite markers, (2) estimation of management unit, (3)
assessment of genetic diversity, (4) detection of genetic pollution) on two urban
neighborhood-dwelling salamander species, H. tokyoensis and H. dunni, for their future
conservation.
6 2. Study species
2-1. Tokyo salamander
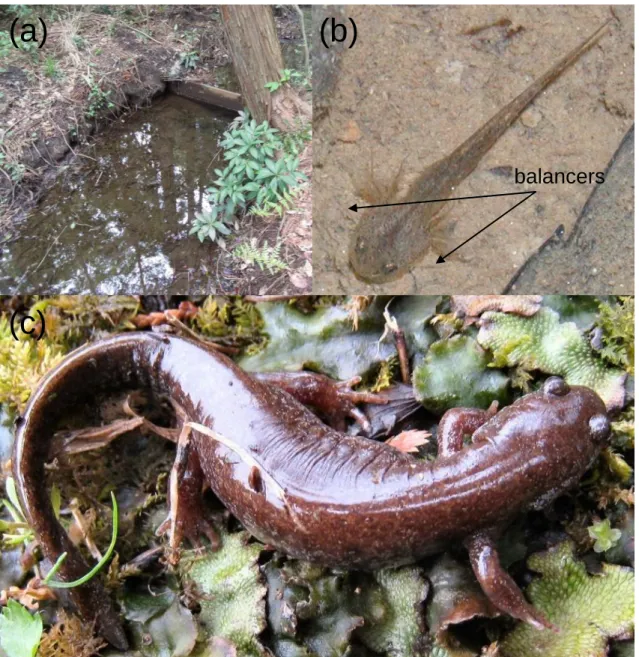
The Tokyo salamander, Hynobius tokyoensis (Tago, 1931) (Fig. 2-1), is endemic to Japan: the pacific coast of Fukushima Prefecture and thoughout the Kanto District, with the exception of Gunma Prefecture (Kusano et al. 2014). This species has a total length of 80–130 mm, generally 12 costal grooves, and shorter limbs (when the forelimb and hindlimb are adpressed to the flank, the toes are separated by the space of about 1 costal groove) (Takada and Ootani 2011). Dorsal color varies widely from yellowish brown to blackish brown, with dark brown individuals predominating and the flanks, cheeks, and limbs are densely speckled with light blue flecks (Takada and Ootani 2011). Two morphologically similar species inhabit around the distribution range of H. tokyoensis.
First, Hynobius lichenatus is morphologically very similar to H. tokyoensis, but has 11 costal grooves (sometimes 12), and relatively longer limbs (toes and fore- and hindfeet make contact when the limbs are adpressed to the body) (Takada and Ootani 2011).
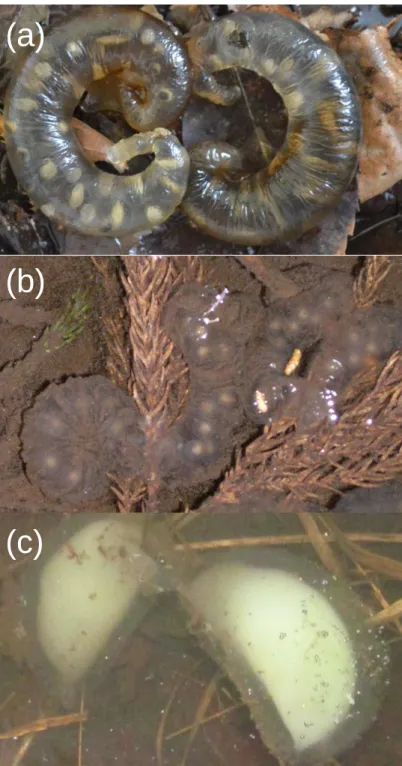
Second, Hynobius nigrescens is also morphologically very similar to H. tokyoensis, but has large body size (120–190 mm), 11 costal grooves (sometimes 12), and much longer limbs (when adpressed to the flank, the toes of the fore- and hindlimbs overlap by the space of 1–3 costal grooves) (Takada and Ootani 2011). Larvae of these three species are difficult to identify because have similar morphological characters. In this case identification can be made from characters of egg sacs (Fig. 2-2), which may differ tremendously, despite the morphological similarities among adults.
Breeding behavior may start while the water temperature is still cold (3–5°C). In
warmer distribution areas, such as the Boso Peninsula, egg sacs can be observed in
December or January, while in colder areas, such as the outskirts of Tokyo, egg sacs do
not begin to appear until February (Sparreboom 2014). Breeding may occur in fresh
water: rice paddies, seepage pools, roadside ditches (Goris and Maeda, 2004). Males
arrive at the breeding ponds first and hind in the mud or under debris in the daytime
(Goris and Maeda, 2004). After that, males prowl and select appropriate breeding points
for egg laying (mainly at night), which are defended against other males (Goris and
Maeda, 2004). When female was reached near the breeding points, males wag their tails
aggressively and begin to congregate at the preselected breeding sites (Goris and Maeda,
2004). After that, they group and swim about in clusters while female walks around
slowly (Goris and Maeda, 2004). Finally, female select and join one of the clusters and
oviposits pair of egg sacs, and attaches them to a suitable twig, leaf, or stem of grass
7
(Sparreboom 2014). Each pair of egg sacs contains a total of 15–192 eggs, and larger females produce more and larger eggs (Sparreboom 2014). In addition, the female produces a small clutch of large eggs under cool climatic conditions, and a large clutch of small eggs under warm conditions (Kusano et al. 2014). After egg laying, the males grasp the egg sacs and eject their sperm, and embryogenesis occur after fertilization (Goris and Maeda, 2004). The larvae of lentic Hynobius species have usually one pair of balancers on the cheeks after hatched (Fig. 2-1), and the balancers have been resorbed with the growth of larvae. They feed on plankton, Daphnia, Tubifex, blood worms, or eat each other (Goris and Maeda, 2004). Adults after breeding and juveniles after metamorphosis scatter widely in the forested areas around the breeding site (Kusano et al. 2014). They spend their lives in the maze of tunnels dug by earthworms, moles, or beetle larvae and they feed on earthworms, spiders, and other arthropods living in the litter layer (Goris and Maeda, 2004). They are especially active in autumn because are prepared for hibernation (Goris and Maeda, 2004). Sexual maturity is reached after 4–5 years, in males a little sooner than in females (Kusano et al. 2014).
2-2. Oita salamander
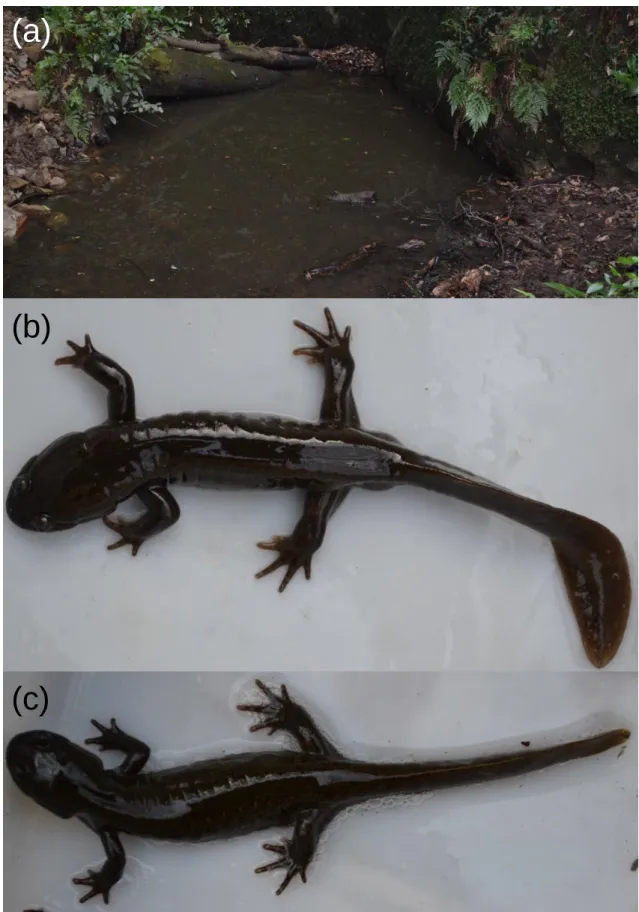
The Oita salamander, Hynobius dunni (Tago, 1931) (Fig. 2-3), is endemic to Japan and found in eastern Kyusyu and south western Kochi (Sato 1998). This species has a total length of 100–165 mm, 12 costal grooves (sometimes 11 or 13), and much longer limbs (toes and fore- and hindfeet make contact when the limbs are adpressed to the body) (Takada and Ootani 2011). The dorsal color is greenish brown to blackish brown with small darkish flecks, while the ventral color is bluish gray (Takada and Ootani 2011). During the breeding season, males have a Y-shaped cloaca (Sparreboom 2014).
Furthermore, head width, tail height and hind legs of males become enlarged, and at this time coloration also becomes more subdued in the males (Fig. 2-3) (Sparreboom 2014).
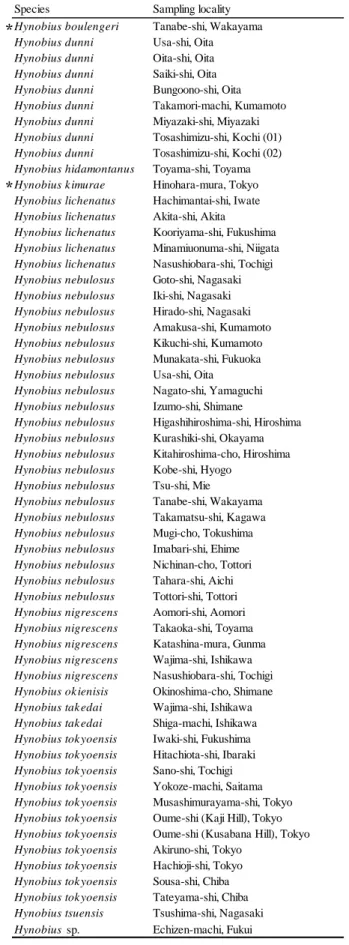
However, it is difficult to distinguish the sexes after the breeding season (Sparreboom 2014). One morphologically similar species, H. nebulosus, inhabit around the distribution range of H. dunni, but has stouter body, V-shaped vomero-palatine teeth series, yellow edges to the tail, shorter tail, 13 coastal grooves (sometimes 12), and relatively shorter limbs (toes do not touch when the fore- and hindlimbs are adpressed to the flank) (Sparreboom 2014). Despite the morphological similarities when the periods of adults and larvae, characters of egg sacs are differ tremendously (Fig. 2-4).
Each pair of egg sacs of H. dunni contains a total of 87–143 eggs (Sato 1998). Basically,
life history and breeding behavior are similar to H. tokyoensis.
8
Fig. 2-1. (a) Breeding pond of Hynobius tokyoensis; (b) larva and (c) adult of Hynobius tokyoensis.
(a) (b)
(c)
balancers
9
Fig. 2-2. Egg sacs of three morphologically similar species: (a) banana-shaped egg sacs of Hynobius tokyoensis, (b) coil-shaped egg sacs of Hynobius lichenatus, and (c) akebi-shaped egg sacs of Hynobius nigrescens.
(a)
(c)
(b)
10
Fig. 2-3. (a) The breeding site of H. dunni. (b) Male and (c) female individuals of H.
dunni.
(b)
(c)
(a)
11
Fig. 2-4. Egg sacs of two morphologically similar species: (a) banana-shaped egg sacs of Hynobius dunni and (b) non banana-shaped egg sacs of Hynobius nebulosus (populations of Oita Prefecture).
(a)
(b)
12
3. Molecular phylogenetic analysis of Japanese lentic Hynobius
3-1. Introduction
Increasing worldwide destruction and disturbance of natural ecosystems are precipitating catastrophic extinctions of species (Brook et al. 2006). In conservation of endangered species, many erroneous decisions may result if the taxonomic status of populations or species is not correctly assigned: (1) unrecognized endangered species may be allowed to become extinct; (2) incorrectly diagnosed species may be hybridized with other species; (3) resulting in reduced reproductive fitness; (4) resources may be wasted on abundant species or hybrid populations; (5) populations that could be used to improve the fitness of inbred populations may be overlooked; (6) endangered species may be denied legal protection while populations of common species may be granted protection (Frankham et al. 2002). Many species descriptions trace to limited information on the geographic distribution of a small number of traits (usually morphological) without genetic basis can lead to taxonomic problems (Avise 1996). To avoid the erroneous conservation activities, molecular techniques are important for protection of endangered species. Currently, the increasing use of molecular phylogenetic techniques has highlighted the prevalence of cryptic species, which are morphologically similar species with long independent evolutionary histories (Kozak et al. 2006).
The genus Hynobius is comprised of a diverse assemblage of over 30 species
distributed in eastern Asia (AmphibiaWeb 2015). More than half of the species in this
genus occur in Japan and approximately half of Japanese Hynobius species are
designated as an endangered species by the International Union for Conservation of
Nature and Natural Resources (IUCN) (International Union for Conservation of Nature
and Natural Resources 2014). According to Sato (1943), Japanese species of Hynobius
are split into the still-water breeding type (lentic breeders) and stream breeding type
(lotic breeders). Lotic breeders mainly found in mountain areas. On the other hand,
some lentic species are distributed in urban neighborhood. These species are clearly
more susceptible to human activities than the other species and urgent conservation
measures are essential. However, Japanese Hynobius may contain cryptic diversity
(Matsui et al. 2006) and most species of Hynobius are generally difficult to identify
without information on sample locality because of their morphological similarities
(Matsui et al. 2002). In conservation of these species, many inappropriate conservation
decisions can be made if the taxonomic status is incorrect (Frankham et al. 2002). This
13
study presents the phylogenetic relationship of Japanese lentic Hynobius and the taxonomic status of urban neighborhood-dwelling salamanders, H. tokyoensis and H.
dunni based on molecular analysis.
3-2. Materials and methods
3-2-1. Sampling
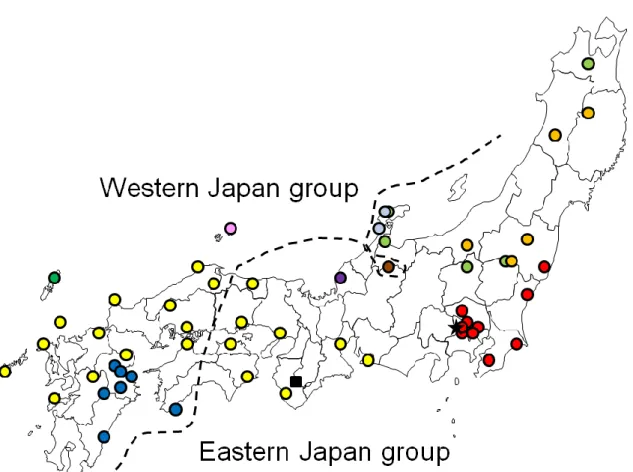
From February to July in 2007, 2008, 2010, 2013 and 2014, 56 individuals (include ten species) were sampled from 55 populations across its entire distribution range (Fig.
3-1, Table 3-1). When breeding season of salamanders (February to May), a single tailbud embryo was removed from each paired egg sac and preserved in 99.5% ethanol.
On the other hand, clipped caudal extremities were sampled from larvae or adults and preserved in 99.5% ethanol when non-breeding season of salamanders. Individuals of Hynobius kimurae and H. boulengeri collected at Tokyo and Wakayama Prefecture, respectively, were used as outgroup (Table 3-1; Fig. 3-1).
3-2-2. Mitochondrial DNA analysis
Total genomic DNA was extracted from the tail tips or single tailbud embryo and preserved in 99.5% ethanol, using a DNeasy Blood and Tissue Kit (Qiagen, Hilden, Germany). For all 56 individuals of lentic Hynobius species and individuals of two outgroup species (H. kimurae and H. boulengeri), the 1103-bp fragment of 16S rRNA and 630-bp fragment of cytochrome b (cyt b) genes were amplified using Ex Taq®
(TaKaRa, Tokyo, Japan) with primers 16SF
(5ʹ- GTCGTAACATGGTAAGTTTACCGGA -3ʹ) and 16SR
(5ʹ- GGATCAATTATGTTAAATATTTTAT -3ʹ) (in this study), and L14010
(5ʹ-TAHGGWGAHGGATTWGAWGCMACWGC-3ʹ) and H14778
(5ʹ-AARTAYGGGTGRAADGRRAYTTTRTCT-3ʹ) (Matsui et al., 2007). The PCR reaction mix (total volume 10 μl) contained 1.0 μl 10× Ex Taq Buffer, 0.8 μl 25 mM dNTP mix, 0.5 μl each of the forward and reverse primers (10 pM), 0.05 μl Taq polymerase, 6.15 μl distilled deionized water, and 1.0 μl template DNA. Using a T100™ thermal cycler (Bio-Rad, Hercules, CA, USA), the PCR protocol is as follows:
an initial 10-min denaturing step at 95°C, 30 cycles of 60 s at 95°C, 60 s at 53°C, and
120 s at 72°C, with a final 10-min extension at 72°C. The PCR products were purified
with Illustra™ ExoStar™ 1-Step (GE Healthcare, Buckinghamshire, UK) and
14
sequenced using BigDye® Terminator ver. 3.1 (Applied Biosystems, Foster City, CA, USA) on an ABI 3130xl Genetic Analyzer (Applied Biosystems). Direct sequencing data were aligned using MEGA5 (Tamura et al. 2011). Phylogenetic analyses of the aligned sequences were performed with the neighbor-joining (NJ) method based on p-distance and the maximum likelihood (ML) estimation based on Tamura-Nei model using MEGA5 (Tamura et al. 2011). The best-fit nucleotide substitution model was estimated based on the Bayesian Information Criterion (BIC: Schwarz, 1978) using MEGA5 (Tamura et al., 2011).
3-3. Results
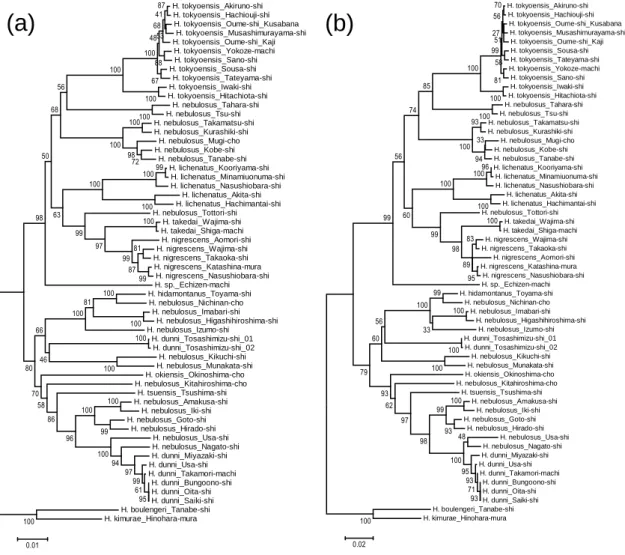
The phylogenetic trees were basically same between NJ and ML estimates (Fig.
3-2). In lentic Hynobius salamanders, two major groups were clearly distinguished with high bootstrap values (Fig. 3-2). The boundary of two groups was in Chugoku and Shikoku Districts (Fig. 3-1). Six species H. nigrescens, H. lichenatus, H. tokyoensis, H.
takedai, H. nebulosus, and H. sp. were included in eastern Japan group (Aomori to eastern part of Tottori, Okayama, Kagawa, and Tokushima Prefectures) (Fig. 3-1). On the other hand, four species H. okiensis, H. tsuensis, H. nebulosus, and H. dunni were included in western Japan group (western part of Tottori, Hiroshima, Ehime, and Kochi Prefectures to Nagasaki, Kumamoto, and Miyazaki Prefectures with the exception of H.
hidamontanus) (Fig. 3-1). Although H. hidamontanus inhabit eastern Japan, it belonged to the western Japan group (Figs. 3-1 and 3-2). Seven species (H. tokyoensis, H.
lichenatus, H. takedai, H. sp., H. nigrescens, H. tsuensis, and H. okiensis) were monophyletic species, but H. nebulosus and H. dunni were polyphyletic species (Fig.
3-2). Especially, despite the same species based on morphological characters, populations of H. nebulosus were included in both groups.
3-4. Discussion
Molecular phylogenetic analysis using mitochondrial DNA detected two groups
with high bootstrap values. Thus, Japanese lentic Hynobius may be divided into two
groups: eastern Japan group (east from eastern part of Tottori, Okayama, Kagawa, and
Tokushima Prefectures) and western Japan group (west from western part of Tottori,
Hiroshima, Ehime, and Kochi Prefectures). However, it is not known exactly why two
groups were genetically separated at this area despite no remarkable geographical
barriers. The Hakuba salamander H. hidamontanus may belong to western Japan group,
15
but the distribution range is clearly located in eastern Japan. Thus, a part of species belonging to the western Japan group may have expanded their distribution range to eastern Japan in the past. To clarify the phylogenetic position of H. hidamontanus, further analyses based on more individuals, localities (e.g. populations of Niigata and Nagano), and molecular markers (e.g. other mitochondrial and nuclear markers) are essential.
Monophyly of H. nebulosus is supported by several morphological characters (Sato 1943), and previous study using allozyme is also supported this opinion (Matsui et al.
2006). According to Matsui et al. (2006), four groups (i.e. the western, eastern, montane, and Chugoku groups) in H. nebulosus are recognized based on the three trees obtained and the result of the MDS analysis. However, these results have some phylogenetic problems. For example, the western group (Kyushu to westernmost Honshu) was distinct in all the analyses performed, although its support in the trees was weak (bootstrap value = 57). Additionally, the distinctness of the Chugoku group was ambiguous. On the other hand, current molecular phylogenetic study using mitochondrial DNA suggests polyphyly of H. nebulosus (Zheng et al. 2012).
Phylogenetic analysis of the present study also indicates the polyphyly of H. nebulosus.
Thus, taxonomic reassessment with additional morphological analysis and phylogenetic reassessment of H. nebulosus using high variable region of nuclear DNA are needed.
The monophyly of H. tokyoensis is supported by some previous studies (Yoshizawa et al. 2005; Hayashi and Kusano 2006; Matsui et al. 2007). Also the results of this study, H. tokyoensis may be monophyletic group based on both phylogenetic analysis (bootstrap value = 100) (Fig. 3-2). Monophyly of H. dunni is supported by several morphological characters and crossing experiment (Sato 1943; Sato and Seto 1993) and previous study using mitochondrial DNA also supported this opinion (Michigoshi 2000).
According to Michigoshi (2000), two major groups (i.e. Oita and Miyazaki-Kochi groups) in H. dunni are recognized based on the mitochondrial DNA analysis. However, phylogenetic analysis of this study did not include the Kyushu populations of H.
nebulosus and used the distantly related species (i.e. H. boulengeri) as outgroup. In the
present study, Kyushu populations of H. dunni may be monophyletic group based on
both phylogenetic analysis (bootstrap value ≥ 95%), but Kochi population of H. dunni
was genetically different from Kyushu populations (Fig. 3-2). Thus, taxonomic
reassessment with additional morphological analysis and phylogenetic reassessment of
Kochi population using high variable nuclear markers are needed.
16
Species Sampling locality
Hynobius boulengeri Tanabe-shi, Wakayama Hynobius dunni Usa-shi, Oita Hynobius dunni Oita-shi, Oita Hynobius dunni Saiki-shi, Oita Hynobius dunni Bungoono-shi, Oita Hynobius dunni Takamori-machi, Kumamoto Hynobius dunni Miyazaki-shi, Miyazaki Hynobius dunni Tosashimizu-shi, Kochi (01) Hynobius dunni Tosashimizu-shi, Kochi (02) Hynobius hidamontanus Toyama-shi, Toyama Hynobius k imurae Hinohara-mura, Tokyo Hynobius lichenatus Hachimantai-shi, Iwate Hynobius lichenatus Akita-shi, Akita Hynobius lichenatus Kooriyama-shi, Fukushima Hynobius lichenatus Minamiuonuma-shi, Niigata Hynobius lichenatus Nasushiobara-shi, Tochigi Hynobius nebulosus Goto-shi, Nagasaki Hynobius nebulosus Iki-shi, Nagasaki Hynobius nebulosus Hirado-shi, Nagasaki Hynobius nebulosus Amakusa-shi, Kumamoto Hynobius nebulosus Kikuchi-shi, Kumamoto Hynobius nebulosus Munakata-shi, Fukuoka Hynobius nebulosus Usa-shi, Oita Hynobius nebulosus Nagato-shi, Yamaguchi Hynobius nebulosus Izumo-shi, Shimane
Hynobius nebulosus Higashihiroshima-shi, Hiroshima Hynobius nebulosus Kurashiki-shi, Okayama Hynobius nebulosus Kitahiroshima-cho, Hiroshima Hynobius nebulosus Kobe-shi, Hyogo
Hynobius nebulosus Tsu-shi, Mie
Hynobius nebulosus Tanabe-shi, Wakayama Hynobius nebulosus Takamatsu-shi, Kagawa Hynobius nebulosus Mugi-cho, Tokushima Hynobius nebulosus Imabari-shi, Ehime Hynobius nebulosus Nichinan-cho, Tottori Hynobius nebulosus Tahara-shi, Aichi Hynobius nebulosus Tottori-shi, Tottori Hynobius nigrescens Aomori-shi, Aomori Hynobius nigrescens Takaoka-shi, Toyama Hynobius nigrescens Katashina-mura, Gunma Hynobius nigrescens Wajima-shi, Ishikawa Hynobius nigrescens Nasushiobara-shi, Tochigi Hynobius ok ienisis Okinoshima-cho, Shimane Hynobius tak edai Wajima-shi, Ishikawa Hynobius tak edai Shiga-machi, Ishikawa Hynobius tok yoensis Iwaki-shi, Fukushima Hynobius tok yoensis Hitachiota-shi, Ibaraki Hynobius tok yoensis Sano-shi, Tochigi Hynobius tok yoensis Yokoze-machi, Saitama Hynobius tok yoensis Musashimurayama-shi, Tokyo Hynobius tok yoensis Oume-shi (Kaji Hill), Tokyo Hynobius tok yoensis Oume-shi (Kusabana Hill), Tokyo Hynobius tok yoensis Akiruno-shi, Tokyo
Hynobius tok yoensis Hachioji-shi, Tokyo Hynobius tok yoensis Sousa-shi, Chiba Hynobius tok yoensis Tateyama-shi, Chiba Hynobius tsuensis Tsushima-shi, Nagasaki Hynobius sp. Echizen-machi, Fukui
Table 3-1. A list of analyzed samples in this study. Asterisks show the out group species.
*
*
17
Fig. 3-1. Sampled localities of lentic Hynobius used in the present study. Circles of yellowish green, orage, red, light blue, yellow, purple, pink, green, and blue indicate the sampled locations of H. nigrescens, H. lichenatus, H. tokyoensis, H. takedai, H.
nebulosus, H. sp., H. okiensis, H. tsuensis, and H. dunni, respectively. The closed star and closed square indicate sampled localities of outgroup species H. kimurae and H.
boulengeri, respectively. For the sample localities, see Table 3-1.
18
Fig. 3-2. NJ (a) and ML (b) phylogenetic trees based on 1103-bp16S rRNA and 630-bp cytochrome b sequences. The scale bar indicates the genetic distance (substitutions per site) of each tree. Numerals indicated near branches are bootstrap probabilities with 1,000 replications. For the sample names and localities, see Table 3-1.
H. tokyoensis_Akiruno-shi H. tokyoensis_Hachiouji-shi H. tokyoensis_Oume-shi_Kusabana
H. tokyoensis_Musashimurayama-shi H. tokyoensis_Oume-shi_Kaji H. tokyoensis_Yokoze-machi H. tokyoensis_Sano-shi H. tokyoensis_Sousa-shi
H. tokyoensis_Tateyama-shi H. tokyoensis_Iwaki-shi H. tokyoensis_Hitachiota-shi
H. nebulosus_Tahara-shi H. nebulosus_Tsu-shi H. nebulosus_Takamatsu-shi H. nebulosus_Kurashiki-shi
H. nebulosus_Mugi-cho H. nebulosus_Kobe-shi
H. nebulosus_Tanabe-shi H. lichenatus_Kooriyama-shi
H. lichenatus_Minamiuonuma-shi H. lichenatus_Nasushiobara-shi
H. lichenatus_Akita-shi H. lichenatus_Hachimantai-shi H. nebulosus_Tottori-shi
H. takedai_Wajima-shi H. takedai_Shiga-machi H. nigrescens_Aomori-shi H. nigrescens_Wajima-shi H. nigrescens_Takaoka-shi H. nigrescens_Katashina-mura
H. nigrescens_Nasushiobara-shi H. sp._Echizen-machi H. hidamontanus_Toyama-shi H. nebulosus_Nichinan-cho
H. nebulosus_Imabari-shi H. nebulosus_Higashihiroshima-shi H. nebulosus_Izumo-shi
H. dunni_Tosashimizu-shi_01 H. dunni_Tosashimizu-shi_02 H. nebulosus_Kikuchi-shi H. nebulosus_Munakata-shi H. okiensis_Okinoshima-cho H. nebulosus_Kitahiroshima-cho
H. tsuensis_Tsushima-shi H. nebulosus_Amakusa-shi
H. nebulosus_Iki-shi H. nebulosus_Goto-shi
H. nebulosus_Hirado-shi H. nebulosus_Usa-shi H. nebulosus_Nagato-shi H. dunni_Miyazaki-shi H. dunni_Usa-shi H. dunni_Takamori-machi
H. dunni_Bungoono-shi H. dunni_Oita-shi H. dunni_Saiki-shi H. boulengeri_Tanabe-shi H. kimurae_Hinohara-mura
100 100
10099
100 100 100
99 81 87 100
9872
99 100
100 100
87
53 41
88 68
67 48 100 100
100
97 100
100 99
81 100
100
99 56
63 68
50
98
46 66
80
70
58 100
86 96
100 94
97 99
61 95
0.01
H. tokyoensis_Akiruno-shi H. tokyoensis_Hachiouji-shi H. tokyoensis_Oume-shi_Kusabana H. tokyoensis_Musashimurayama-shi H. tokyoensis_Oume-shi_Kaji H. tokyoensis_Sousa-shi H. tokyoensis_Tateyama-shi H. tokyoensis_Yokoze-machi
H. tokyoensis_Sano-shi H. tokyoensis_Iwaki-shi H. tokyoensis_Hitachiota-shi H. nebulosus_Tahara-shi H. nebulosus_Tsu-shi H. nebulosus_Takamatsu-shi H. nebulosus_Kurashiki-shi
H. nebulosus_Mugi-cho H. nebulosus_Kobe-shi H. nebulosus_Tanabe-shi H. lichenatus_Kooriyama-shi H. lichenatus_Minamiuonuma-shi H. lichenatus_Nasushiobara-shi
H. lichenatus_Akita-shi H. lichenatus_Hachimantai-shi H. nebulosus_Tottori-shi
H. takedai_Wajima-shi H. takedai_Shiga-machi H. nigrescens_Wajima-shi H. nigrescens_Takaoka-shi H. nigrescens_Aomori-shi H. nigrescens_Katashina-mura H. nigrescens_Nasushiobara-shi H. sp._Echizen-machi H. hidamontanus_Toyama-shi H. nebulosus_Nichinan-cho
H. nebulosus_Imabari-shi H. nebulosus_Higashihiroshima-shi
H. nebulosus_Izumo-shi H. dunni_Tosashimizu-shi_01 H. dunni_Tosashimizu-shi_02 H. nebulosus_Kikuchi-shi H. nebulosus_Munakata-shi H. okiensis_Okinoshima-cho H. nebulosus_Kitahiroshima-cho
H. tsuensis_Tsushima-shi H. nebulosus_Amakusa-shi
H. nebulosus_Iki-shi H. nebulosus_Goto-shi
H. nebulosus_Hirado-shi H. nebulosus_Usa-shi H. nebulosus_Nagato-shi H. dunni_Miyazaki-shi H. dunni_Usa-shi H. dunni_Takamori-machi
H. dunni_Bungoono-shi H. dunni_Oita-shi H. dunni_Saiki-shi H. boulengeri_Tanabe-shi H. kimurae_Hinohara-mura 100
100 100
100
96
100 100
100
100 99
93 71 93 95 100
100 93 48 99 100
33
98 97 62 93
94 33 93
100
56 60
79
95 83
89 98 100
99 99 60
56 74
85
100 100
81 58 27 99 70 56
51
0.02