SAG
E- bas ed Ti l ed D
i s pl ay W
al l enhanc ed w
i t h
dynam
i c r out i ng f unc t i onal i t y t r i gger ed by
us er i nt er ac t i on
著者
Ki do Yos hi yuki , I c hi kaw
a Kohei , D
at e Sus um
u,
W
at as hi ba Yas uhi r o, Abe H
i r ot ake, Yam
anaka
H
i r oaki , Kaw
ai Ei j i , Takem
ur a H
ar uo, Shi m
oj o
Shi nj i
j our nal or
publ i c at i on t i t l e
Fut ur e gener at i on c om
put er s ys t em
s
vol um
e
56
page r ange
303- 314
year
2016- 03
権利
( C) 2015. Thi s m
anus c r i pt ver s i on i s m
ade
avai l abl e under t he CC- BY- N
C- N
D
4. 0 l i c ens e
ht t p: / / c r eat i vec om
m
ons . or g/ l i c ens es / by- nc - nd/ 4
. 0/
U
RL
ht t p: / / hdl . handl e. net / 2241/ 00138498
SAGE-based Tiled Display Wall Enhanced with
Dynamic Routing Functionality Triggered by User
Interaction
Yoshiyuki Kidoa, Kohei Ichikawab, Susumu Datea, Yasuhiro Watashibaa,
Hirotake Abec, Hiroaki Yamanakad, Eiji Kawaid, Haruo Takemuraa, Shinji
Shimojoa,d
a
Osaka University, Japan
b
Nara Institute of Science and Technology, Japan
c
University of Tsukuba, Japan
d
National Institute of Information and Communications Technology, Japan
Abstract
To empower scientists who are engaged in nation-wide or global-scale col-laborative projects for scientific discovery, a large amount of scientific data needs to be visualized and then shared among the scientists. Tiled Display Wall (TDW) systems has been widely accepted and used for visualization of large-scale scientific data. Scalable Adaptive Graphics Environment (SAGE) has received attention from scientists as a middleware that organizes multiple display monitors into a network-aware large display monitor. Using a SAGE TDW, scientists can display multiple visualized contents on a single display monitor, each of which can be located at geographically distant site man-aged by other organizations. However, SAGE does not have a mechanism for managing multiple visualized data streams heading for a single TDW. In a conventional network, data flows for a same destination tend to share a same link, resulting in drop of packets and therefore poor visual quality. Moreover, because of the flexible nature of SAGE, rate of each visual data
Email addresses: [email protected](Yoshiyuki Kido),
[email protected] (Kohei Ichikawa),[email protected](Susumu Date), [email protected](Yasuhiro Watashiba),
[email protected](Hirotake Abe),[email protected](Hiroaki Yamanaka),
[email protected](Eiji Kawai), [email protected](Haruo Takemura),
flows may change dynamically as a result of user interaction on a TDW, such as moving and resizing a visual window. For the reason above, we pro-pose and develop a dynamic route allocation method that switches packet flows onto network links where better performance is expected, in response to user-interaction such as window movement and resizing. Technically, we have leveraged OpenFlow, an implementation of Software Defined Network-ing (SDN), to integrate network programmability into SAGE. In this paper, we show how SAGE enhanced with the proposed method succeeded in avoid-ing network congestion and improvavoid-ing the quality of visualization on the tiled display wall over the wide area OpenFlow network on the Internet.
Keywords:
1. Introduction
To understand the meaning of a large amount of analysis results gener-ated through modern scientific techniques such as big data and data-intensive analysis, the results need to be visualized in an intuitive manner. The vi-sualized results also need to be shared among multiple researchers. Modern science deals with complex and challenging problems, and collaborative re-searchers often from different universities and institutes globally are essential. For example, to observe a supernova explosion in astronomy, astronomers have organized an international virtual observatory alliance to develop a fixed point observation and visualization system using many different observatories in the world [1].
To provide an intuitive understanding for large-scale scientific data, high-resolution visualization is indispensable. Tiled Display Wall (TDW) systems have been widely accepted for this purpose because of their scalability in resolution. TDW provides a single virtual large monitor composed of multiple sets of computers and displays. The resolution can easily be increased by adding other sets of computers and displays. High-resolution visualization in the TDW also allows multiple researchers to see a large display monitor simultaneously and collaborate with each other.
them on a single virtual monitor, while the other middleware are designed to mainly work in a single local environment. This feature of SAGE allows scientists to easily share large visualized data over network and promote global collaborations.
SAGE uses IP network to transfer visual data streams from a sender to a receiver in a straightforward way. This design choice contributes to achieve simplicity and ease of use of SAGE. However, this architectural design may give rise to some problems when we use SAGE over wide-area network. Each network streaming may generate a large volume of network traffic. To transfer a single full HD video with 30 fps, for example, approximately 1.4 Gbps traffic will be generated. In addition, the streaming traffic will be changed dynamically in volume depending on user-interaction such as window movement and resizing. Therefore, user-interaction to visualization on SAGE-based TDW sometimes results in network congestion, which further leads to a decrease in visualization quality caused from the frame rate drop. We have developed a dynamic route allocation method that controls packet flows to prevent links in a network from being heavily congested. Technically, we have leveraged OpenFlow, an implementation of Software Defined Networking, to integrate network programmability into SAGE. Our proposed method optimizes network routing in response to external events that may affect the balance of network flows, i.e. user-interactions. In the development environment of this research, we use JGN-X/RISE [5][6][7], a network testbed provided by NICT, Japan.
The remainder of this paper is organized as follows. Section 2 provides the technological background of this research. Section 3 will briefly describe our previous work, fault avoidance network functionality with SAGE and OpenFlow, and technical issues to be addressed in this research. Section 4 illustrates our proposed method, the dynamic route allocation method, in detail. In Section 5, we present some experimental results in our local environment, we conclude our research and suggest future work in Section 6.
2. Technological Background
2.1. SAGE
SAGE (Scalable Adaptive Graphic Environment) is a TDW middleware originally developed by the electronic visualization laboratory, University of Illinois at Chicago, to realize a scalable visualization [2]. SAGE allows users to stream the pixels of each application over the network. It is designed so that users can freely move and resize each application’s window over a TDW at run time. SAGE consists of Free Space Manager, SAGE Application Interface Library (SAIL), SAGE Receiver, and SAGE UI (User Interface), as illustrated in Fig. 1. The Free Space Manager (fsManager) controls pixel streams between SAIL and the SAGE Receivers. SAIL captures output pixels from applications, and streams them to appropriate SAGE Receivers. A SAGE Receiver can receive multiple pixel streams from different applications, and can display streamed pixels on the displays connected to the SAGE Receiver.
The Free Space Manager works similarly to a window manager in X11 window system. It handles the layout and placement of application windows on a TDW. Based on the information on the window layout, the Free Space Manager informs the SAIL linked with each application of how it should split the application images and where it should send the divided images. SAIL re-members how incoming images should be divided so that it can continuously send divided images to SAGE Receivers without communicating anything to the Free Space Manager. This direct access architecture from SAIL to SAGE Receivers is the core design concept in SAGE, which produces the scalability on SAGE.
SAGE UI is a graphical user interface that allows users to move and resize each application window on a TDW. SAGE UI connects to a Free Space Manager and delivers user commands (e.g. move, resize, etc.) to the Free Space Manager. Window layout modification through SAGE UI is immediately informed to the SAIL of the corresponding application and then SAIL may change the destination of each data stream to another SAGE receiver, if necessary. This may also cause drastic changes in network traffic when applications are deployed globally. User-interactions through SAGE UI therefore sometimes results in network congestion and as a result leads to decrease of visualization quality caused by the frame rate drop.
2.2. Software Defined Networking
Figure 1: Architecture of SAGE
Figure 2: Overview of OpenFlow Architecture
easier to operate and manage, and be able to respond to changing application and network conditions. SDN decouples the network control plane from the data/forwarding planes, enabling a centralized control of the network layer. OpenFlow is a network protocol designed to actualize the concept of SDN and used in communication between the network control plane (OpenFlow controller) and data planes (OpenFlow switches) [8][9].
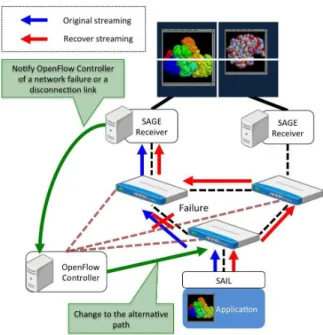
Figure 3: Network Failure Avoidance Mechanism built into SAGE using OpenFlow
compared to the flow entries, and if the packet matches a packet matching rule in a flow entry, the set of actions associated with the flow entry are per-formed. Packets that do not match any flow entry are sent to the OpenFlow controller, and then the OpenFlow controller decides how the packets should be handled and the OpenFlow controller can modify the flow tables. This centralization of the network intelligence is the key concept of SDN. In this research, we let the OpenFlow controller respond to the requests from SAGE and optimize network routing dynamically based on requests by employing the programmability of OpenFlow.
3. Previous Work and Remaining Challenge
the SAGE Receivers keep monitoring the frame rate of pixel streaming from the applications, if they encounter sudden frame drops, the SAGE Receivers asked the OpenFlow controller to search for an alternative route for the pixel streaming. This kind of quick recovery is hard to be achieved with traditional failure detection methods in the network layer.
In the previous work, we did not focus on dynamic changes of network traffic caused by user-interaction in SAGE. As mentioned in Section 1 such dynamic changes of network traffic may result in network congestion and then lead to a decrease in visualization quality. This problem can be also addressed by leveraging the direct interaction between the application layer and the network layer as proposed in the previous work. In SAGE, dynamic changes of network traffic are caused by 1) starting a new application, 2) moving an application window, and 3) resizing an application window. These events can be detected by the Free Space Manager of SAGE. Focusing on the network problem triggered by user-interaction, we propose an interface on the OpenFlow controller so that it can accept requests from the Free Space Manager and dynamically reroute the network path.
4. Proposed Method
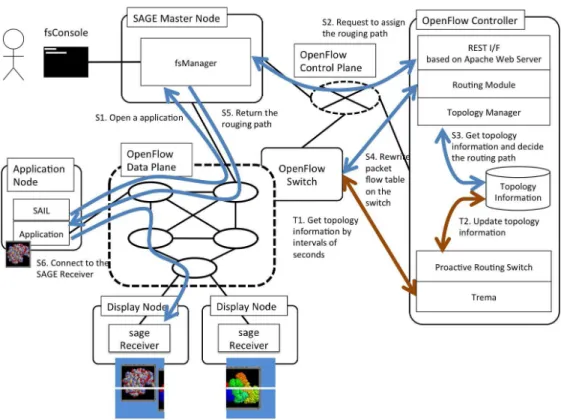
In this paper, we present our extended version of SAGE middleware with a dynamic route allocation method in response to user-interactions such as opening, closing, moving and resizing windows. Figure 4 shows an overview of our proposed system and how the system works.
To respond to the transition of network condition triggered by user in-teraction, routing measurement of the amount of packets in each flow is essential. Furthermore, this measurement must be performed immediately after any user interaction occurs. The measurement of the amount of pack-ets in flow is recorded for each physical port on OpenFlow switches. These records are aggregated to a database built on an OpenFlow controller.
Our proposed method is assumed to run in the same environment as our previous work does. The control logic in our proposed method can be summarized as the following two workflows: the background workflow and the user-interaction workflow. The background workflow contains the T1 and T2 brown arrows as shown in Fig. 4.
T2 T1 information is periodically recorded and updated on the database on the controller.
The user-interaction workflow responds to user operations and network rout-ing. The main tasks of this workflow is represented by the blue arrows labeled S1–S6, as shown in Fig. 4. The following is the step-by-step description how this workflow functions when a user operations (such as moving and resizing) are delivered into an application window:
S1 When a user operates a SAGE application window on an application node, the application node notifies the fsManager of the operational information and application information via the SAIL interface. The fsManager of operation information includes window size, vertical and horizontal coordinate.
S2 If the fsManager is informed of any user’s operational event occurred on the application node, the fsManager sends a message to the OpenFlow controller to request the OpenFlow controller to discover and assign a route for pixel streams of the corresponding application so that it avoids the network collisions.
S3 For route selection, the routing module in the OpenFlow controller needs to retrieve network topology information from the database.
S4 The routing module determines a route for network optimization so that a network collision on the network between the display node and ap-plication node does not occur.
S5 The fsManager sends a message of the route assignment to the OpenFlow controller.
S6 The application node connects to the display node via the optimized path.
Figure 4: Overview of System Architecture
5. Evaluation and Discussion
In this section, we report the evaluation results of our proposed method. We have conducted experiments in two scenarios in order to confirm the effectiveness of the dynamic route allocation method. In the first scenario, we observed the fluctuation of throughput when multiple applications were deployed simultaneously. In the second scenario, we observed the fluctuation of throughput when we moved the location of an application displayed on a TDW in the case that another application also exists.
5.1. Multiple Application Streams
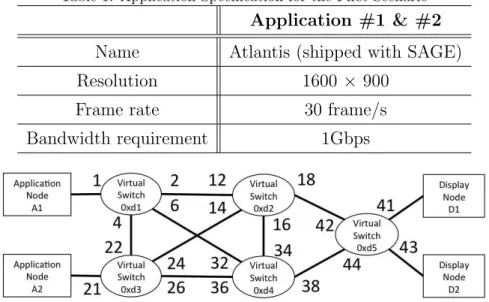
Table 1: Application Specification for the First Scenario
Application #1 & #2
Name Atlantis (shipped with SAGE) Resolution 1600 ×900
Frame rate 30 frame/s
Bandwidth requirement 1Gbps
Figure 5: Network Topology Model for the First Scenario
method, the two streams from different applications tend to share the same link, which as a result will cause network congestion and lead to frame rate drop. On the other hand, with our proposed method, the use of each link is monitored and the OpenFlow controller allocates appropriate route for each application stream.
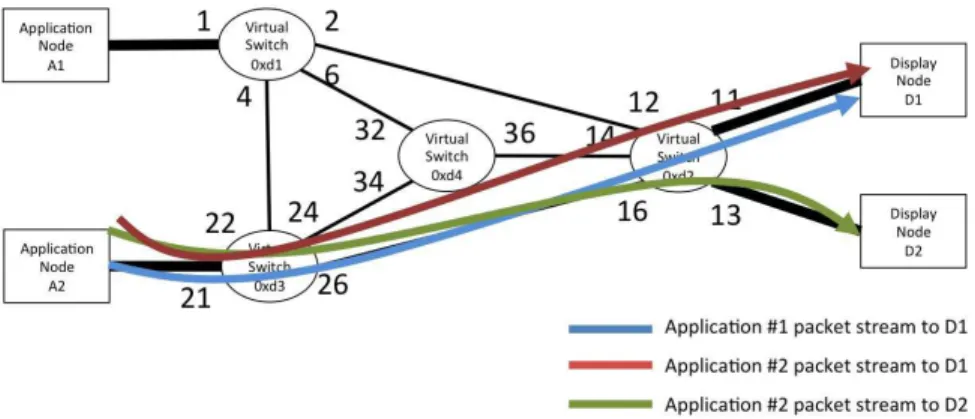
Figure 5 shows a logical network topology for the first scenario. NEC UNIVERGE PF5240 as an OpenFlow switch was used with an OpenFlow controller framework, Trema [11], in this evaluation. We divided the Open-Flow switch into five virtual switches numbered from 0xd1 to 0xd5. The topology shown in Fig. 5 is analogous to a wide-area network. Two appli-cation nodes and display nodes were connected to different switches, switch 0xd1, 0xd2, and 0xd5, respectively. These switches can be considered as edge switches for each different administrative domain site. These switches are then connected with multiple paths to each other. The numbers beside the switches represent physical port numbers on the OpenFlow switch. These port numbers later to show the results of the network throughput.
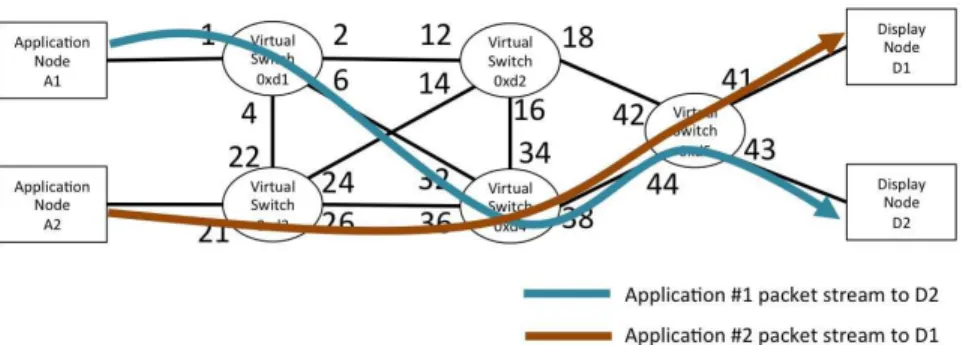
Figure 6: Congested Route Assignment without Our Proposed Method
another application #2 on application node A2 at the time of T=60. The application window of application #2 was specified to be displayed on the monitor of the display node D1. In the later part of this section, allocated paths and throughput are presented in cases with and without our proposed method.
5.1.1. Case 1: Without our proposed method
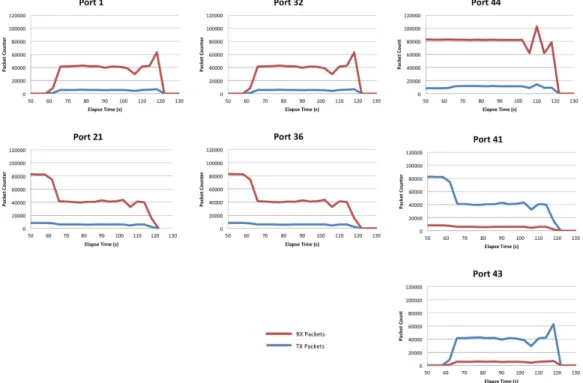
Without our proposed method, the shortest route in terms of hop count from the source to the destination is assigned for each packet flow and there-fore an identical link of the network tends to be shared by two applications even if there is still available bandwidth on other links. Figure 6 snapshots the allocated routes for each application in this case. In this case, a link between switch 0xd4 and 0xd5 was shared by the two applications. Fig-ure 7 shows packet count per second for both transmitted packets (TX) and received packets (RX) on each port on the OpenFlow switch.
As observed in Fig. 7, RX on port 44 was fully loaded during this case without our proposed method. However, the use of ports 21, 36 and 41 were reduced after application #2 was launched. This fact means that network congestion took place on the link between port 38 and port 44. Reduced packets were forwarded through the switch 0xd5 from the application #1. Figure 8 also shows frame rate drops on the two display nodes when the network congestion occurred.
5.1.2. Case 2: With our proposed method
Figure 7: Packet Count Per Second on Each Virtual Switch
Figure 9: Route Assignment with Our Proposed Method
Figure 10: Packet Count Per Second on Each Virtual Switch with Our Proposed Method
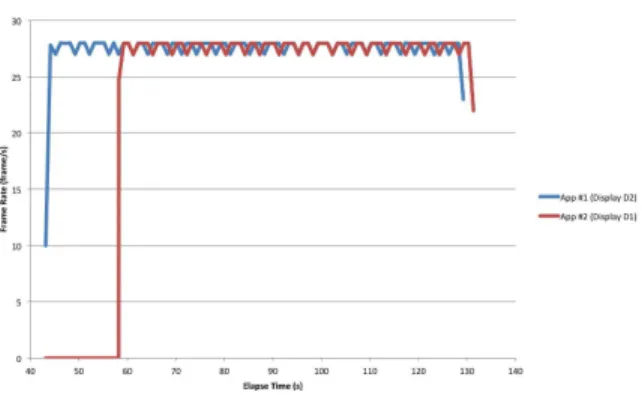
Figure 11: Frame Rate with Our Proposed Method
Table 2: The application specification for the 2nd scenario
Applications #1 & #2
Name Atlantis (shipped with SAGE) Resolution 1100 ×620
Frame rate 30 frame/s
Bandwidth requirement 500Mbps
5.2. Dynamic Traffic Changes caused by User-Interaction
The next scenario was conducted to confirm the effectiveness of our pro-posed method when the network congestion caused by application window movement. The setup of the application used in this scenario is described in Table 2. Without our dynamic route allocation method, the new application stream caused by user-interaction kept using an heavy-loaded link, which leads to frame rate drops. With our proposed method, the route assignment is always recalculated when the user-interaction affects on network traffic.
Figure 12: Network Topology Model for the Second Scenario
Figure 13: Congested Route Assignment without Our Proposed Method
thin lines are limited up to 500Mbps.
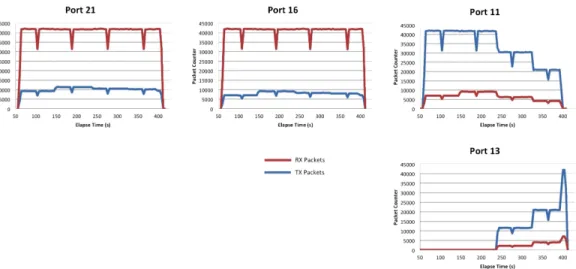
Figure 14: Packet Count Per Second on Each Virtual Switch
Figure 15: Frame Rate Drops on the TDW during Network Congestion
5.2.1. Case 1: Without our proposed method
Figure 16: Route Assignment with Our Proposed Method
each physical port on the OpenFlow switch.
As illustrated in Fig. 14, RX on port 16 was fully loaded throughout the experiment. In this case, port 21 could have consumed a more bandwidth. However, all streams got stacked at port 16 and could not fully utilize the local link. Fig. 15 shows how the frame rate drops as caused by network congestion. From this figure, the change in the network use caused by appli-cation window movement can be observed.
5.2.2. Case 2: with our proposed method
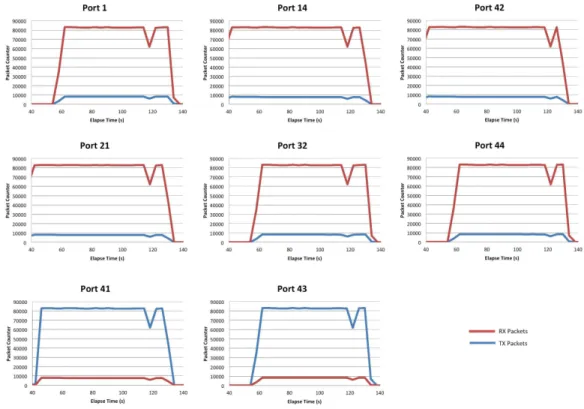
With our proposed method, the route assignment is always recalculated when the use of the network is changed by any user-interaction. Figure 16 shows the route assignments when we moved the window of application #2 in the center of displays D1 and D2. The blue line indicates the pixel stream of application #1, and the red and green lines indicates the two pixel streams of application #2. The user-interaction created another new stream and we had three application streams in total. However, our proposed method has succeeded to assign an appropriate route to each application stream.
Figure 17: Packet Count Per Second on Each Virtual Switch with Our Proposed Method
6. Conclusion
Figure 18: Frame Rate with Our Proposed Method
with TDW was triggered, which may cause unbalance in network traffic and consequently degradation of visualization quality. Our experimental results show that our proposed method can successfully avoid network congestion. For future work, we will apply our method to a real wide-area network and consider the influence of network delay beyond the Internet. Finally, consider to apply our proposed method to visual contents in higher resolution, such as 4K and 8K.
Acknowledgment
This research was partly supported by the collaborative research of Na-tional Institute of Information and Communications Technology (NICT) and Osaka University (Research on high functional network platform technology for large-scale distributed computing).
[1] P. J. Quinn, D. G. Barnes, I. Csabai, C. Cui, F. Genova, B. Hanisch, A. Kembhavi, S. C. Kim, A. Lawrence, O. Malkov, M. Ohishi, F. Pasian, D. Schade, W. Voges, The International Virtual Observatory Alliance: recent technical developments and the road ahead, Proc. SPIE 5493, Optimizing Scientific Return for Astronomy through Information Tech-nologies, 137 , Jun. 2004.
scalable adaptive graphics environment, Proc. of Supercomputing 2006 (SC06) , p.24, Nov. 2006.
[3] D. Rantzau, U. Lang, R. Lang, H. Nebel, A. Wierse and R. Ruehle, Collaborative and Interactive Visualization in a Distributed High Per-formance Software Environment, Proc. of the International Workshop on High Performance Computing for Computer Graphics and Visuali-sation, pp.207–216, Jul. 1995.
[4] K. U. Doerr and F. Kuester, CGLX: A Scalable High-Performance Visu-alization Framework for Networked Display Environments, IEEE Trans-action ov Visualization and Computer Graphics , vol.17, issue 3, pp.320– 332, Mar. 2011.
[5] I. Yamauchi, T. Miyake, Y. Mikamo, J. Shimada, K. Kobayash and H. Esaki, JGN II (Japan Gigabit Network II): A Research and Devel-opment System for Advanced Broadband Networks, Proc of the 2005 Symposium on Applications and the Internet Workshops (SAINT 2005)
, pp.34–37, Jan. 2005.
[6] National Institute of Information and Communications Technology, JGN-X,
http://www.jgn.nict.go.jp/english/
[7] S. Ishii, E. Kawai, Y. Kanaumi, S. Saito, T. Takata, K. Kobayashi and S. Shimojo, A Study on Designing OpenFlow Controller RISE 3.0, Proc of the 19th IEEE International Conference on Networks (ICON2013), pp.1–5, Dec. 2013.
[8] N. McKeown, T. Anderson, H. Balakrishnan, G. Parulkar, L. Peterson, J. Rexford, S. Shenker and J. Turner, OpenFlow: Enabling Innovation in Campus Networks,ACM SIGCOMM Computer Communication Review
, vol.44, issue 2, pp.69–74, Apr. 2008.
[9] The Open Flow Switch Specification, Version 1.1.0,
http://www.openflow.org/documents/openflow-spec-v1.1.0.pdf, (2011).
Middleware Architecture in the Internet (MidArch 2012)), pp.88–93, Jul. 2012.