• 検索結果がありません。

Comparison of surface temperatures between thermal infrared images and in situ data

N/A
N/A
Protected

Academic year: 2021

シェア "Comparison of surface temperatures between thermal infrared images and in situ data"

Copied!
4
0
0

読み込み中.... (全文を見る)

全文

(1)

Comparison of surface temperatures between thermal infrared images and in situ data

Bonggeun Song , Kyunghun Park, Sookuk Park, Taekyung Baek, Byongwoon Jun, Yongseung Kim, Jinhwan Choi, Hyeongkeun Park

ABSTRACT

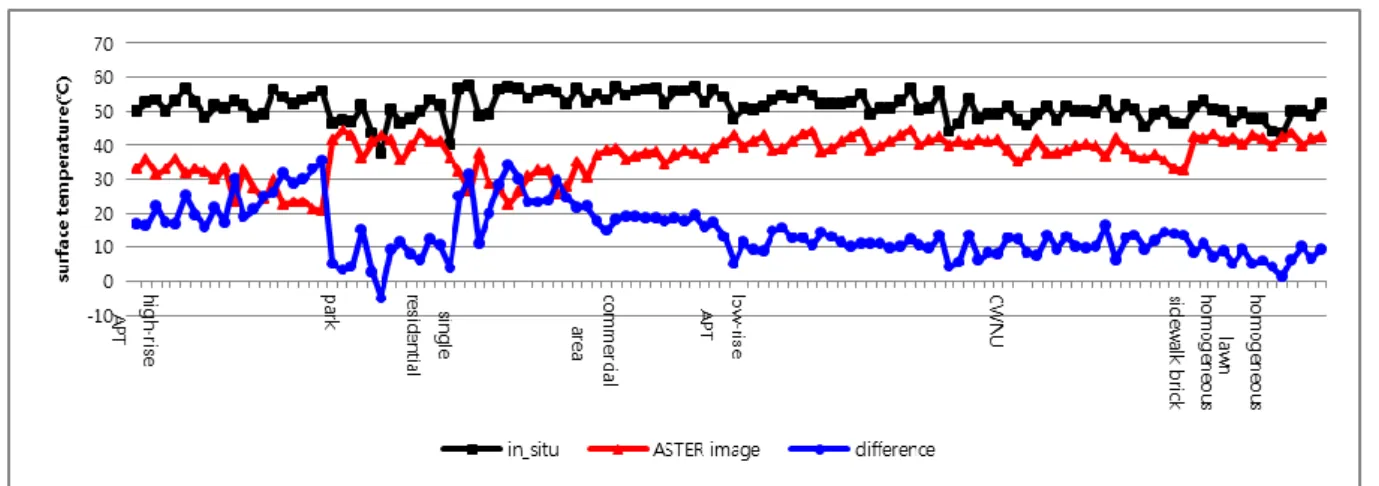
Applications of surface temperatures derived from thermal infrared bands of satellite images are increasingly being used to mitigate UHI. To investigate the accuracy of satellite image data, this study compared the satellite data with in situ data of 8 different land-use urban sites in the city of Changwon, Republic of Korea. The satellite image used to analyze surface temperatures is from ASTER thermal infrared bands, and thermal infrared thermometers are used for in situ measurement. The results show that differences of surface temperatures between the ASTER image and in situ data were greater in high-rise urban sites by a different of approximately 15℃. By treating shaded proportions separately from the sites, it was found that the differences were reduced most in high-rise sites, up to 4.2℃. For further studies, an energy balance model approach will be adopted to find other effects that cause the gaps.

Keywords : GIS, Surface temperature, Urban heat island, Satellite image, in situ

1. Introduction

Cities are facing serious urban heat island (UHI) phenomena caused by large volumes of artificial materials and high-rise buildings that are distributed intensively in urban areas, as well as reduced green spaces. Recently, land surface temperatures (LST) derived from thermal infrared bands of satellite images have been widely used in applications to mitigate UHI (Weng et al., 2004).

For urban climate and environmental studies, Quattrochi and Luvall (1999) noted "LST data are used mainly (1) for analyzing LST patterns and relationships with surface characteristics, (2) for assessing UHI and (3) for relating LSTs with surface energy fluxes in order to characterize landscape properties, patterns and processes." Also, LST can modulate the distribution of the air temperature in the lower layer of urban atmosphere by using the relationships of LST, air temperature and spatial surface geometry. Therefore, LST is an important variable for determining surface radiation, energy exchange and human thermal comfort

(Voogt and Oke, 1998).

However, there are issues concerning accuracy and verification between LST data derived from thermal infrared images and in situ LST data. This study compares the two different data using urban areas in Changwon, Republic of Korea, and investigates how to reduce the gaps between them.

2. Methodology

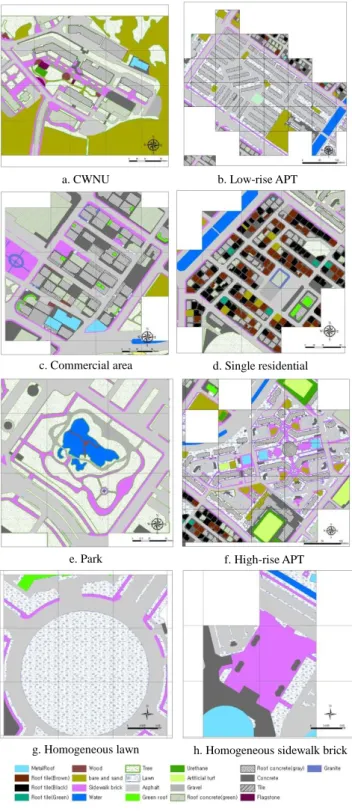
Eight different land-use sites were selected in the city of Changwon (35°14'01.02" N, 128°41'19.95" E):

Changwon National University (CWNU) campus, commercial area, single residential, park, high-rise apartment, low-rise apartment, homogeneous lawn, and homogeneous sidewalk brick (Fig. 1).

The sites were classified in 21 various land cover types, called surface fabrics, using an ArcGIS 9.3 program (http://www.esri.com). LST data derived thermal infrared bands of ASTER satellite images on July 28, 2012 (2:10 P. M.; UTC+9) were analyzed.

Additionally, surface fabrics were constructed in the same vector GRID resolution with ASTER satellite images, then surface fabric ratios in each GRID were calculated.

For in situ LST measurement, surface temperatures of surface fabrics in the 8 sites were measured with thermal Changwon National University, Dept. of Environmental

Engineering, 20 Changwondaehak-ro, Uichanggu, Changwon, Gyengnam, 641-773, Korea

+82-55-213-3747(Tel) +82-55-281-3011(Fax)

[email protected]

(2)

infrared thermometers (testo 831, www.testo.com;

accuracy, ±1.5℃), at the same time as the satellite's scanning. The measuring points included 323 sunny locations. To calculate the mean surface temperature of each GRID, the mean surface fabric temperatures were multiplied to surface fabric ratios:

∑ ×

=

= n 1

i si i

s

T A

T (1)

T

s

is a mean LST of each GRID. T

si

is a LST of i-th surface fabric. A

i

is an area ratio of i-th surface fabric.

To adopt shadow effects of vertical obstructions in urban areas, the 'hillshade' function of the ArcGIS program was used. Shaded surface fabric areas were simulated using LIDAR images with the sun's azimuth (188˚31´40.10˝) and altitude angles (63˚52´51.6˝) of the measurement time. The surface temperatures of shaded areas were assumed to be the same as air temperature.

After the processes above, the mean surface temperatures in the vector GRID were compared to ASTER surface temperatures spatially. It should be noted that some areas of high-rise APT and single residential sites were covered by cloud at the time, so several GRIDs were not included in the analysis.

3. Results and Discussion

3.1 LSTs measured in situ

LSTs of surface fabrics measured in situ are shown in Table 1. LST of wood was the highest (69.0℃). LSTs of most artificial materials (i.e. urethane, brick, concrete and asphalt) were much higher than those of natural materials (i.e. lawn, water, tree and green roof). Also, LSTs of dark-colored materials were higher than white- colored materials. For example, LST of black roof tile (60.8℃) was higher than those of brown roof tile (58.5℃) and green (55.1℃).

Lawn (mean, 35.2℃; variation, 29.0-45.5℃) and sand and bare fabrics (48.6℃; 39.3-65.3℃) had broad variations. Homogeneous lawn (43.5℃; 36.0-54.0℃) had also similar results of lawn. Lawn in urban areas has various water supplies. If lawn has enough water content, its LST will be low because of heat loss through evaporation. Park and high-rise APT sites were much lower than the other sites because they had better landscape management plans by the city parks and greens division, and the APT management office. Sand and bare soil fabric also shows various natural situations.

Sand has a much higher albedo than bare soil, so if a

fabric has more sands its LST will be lower. The same result was visible in artificial turf in the high-rise and low-rise APTs. The artificial turf in the low-rise APT had more sands on it and was 5.5℃ lower LST than that in the high-rise APT. Moreover, surface dirtiness resulted in various LSTs of the same fabrics, i.e. asphalt and concrete.

a. CWNU b. Low-rise APT

c. Commercial area d. Single residential

e. Park f. High-rise APT

g. Homogeneous lawn h. Homogeneous sidewalk brick

FIGURE 1. Classification for surface fabrics

(3)

3.2 Classification of surface fabrics

Land surface fabrics were classified into 21 types (Fig.

1). The CWNU was covered mostly by concrete and sidewalk brick, the low-rise APT and commercial area by gray colored concrete, and single residential by asphalt and roof tiles.

In the park various fabrics such as water, lawn, sidewalk brick, wood and tree were present. The high- rise APT has also various fabrics, i.e. asphalt, gray concrete, tile and tree.

Table 1. LST measured in situ by surface fabrics

Fabric No

Surface temperature (℃) mean Max Min

Metal Roof 1 47.8 - -

Roof tile(Brown) 12 58.5 67.9 49.5 Roof tile(Black) 6 60.8 69.7 54.1

Roof tile(Green) 1 55.1 - -

Wood 4 69.0 69.5 68.1

Sand and bare 20 48.6 65.3 39.3

Sidewalk brick 37 51.8 58.4 40.1

Water 6 30.8 31.0 30.0

Tree 65 34.7 44.8 22.2

Asphalt 70 59.4 63.8 40.2

Green roof 7 40.0 45.3 35.2

Urethane 2 66.2 67.0 65.4

Artificial turf 6 56.1 60.4 53.0

Gravel 14 52.3 56.1 44.1

Lawn 18 35.2 45.5 29.0

Concrete 8 54.2 57.4 48.9

Roof concrete(green) 7 57.4 59.6 52.2 Roof concrete(gray) 17 58.9 63.0 51.5

Tile 4 51.6 56.6 37.4

Flagstone 5 57.2 59.0 55.2

Granite 1 48.0 - -

Homogeneous(lawn) 6 43.5 54.0 36.0

Homogenous(sidewalk brick) 6 62.0 63.0 60.0 Air temperature: 35.8℃, Wind speed: 0.9m/s, Humidity: 45.6%

3.3 LSTs derived from thermal infrared bands of ASTER satellite image

LSTs are shown in Figs. 2 and 3. The range of values is 16.3-60.8℃. High surface temperature areas were found in more urbanized sites that were covered by impervious surfaces (i.e. concrete and asphalt) and situated in high-rise and dense buildings. On the other hand, in rural areas with distributed vegetation and grassland, LSTs were low. However, low surface temperatures (≤17.0℃) were dispersed throughout some areas in the images due to effects of cloud.

3.4 Comparison of LSTs between satellite images and in situ data

The measured in situ data were approximately 15℃

higher than LSTs from ASTER satellite images (Figs. 2 and 3). The park and homogeneous lawn sites had fewer differences than more dense sites.

After including the shadow effect, high-rise APT (32.5%) and commercial area (24.0%) sites had the most shaded areas, which reduced the differences greatly in the high-rise APT (4.2℃) and commercial area (4.0℃) (Table 2 and Fig. 4). Less shaded sites (i.e. park, homogeneous lawn and sidewalk brick) had smaller effects.

4. Conclusion

The study compared surface temperatures between ASTER satellite thermal infrared images and in situ data of 8 different land-use types.

The measured in situ data were approximately 15℃

higher surface temperatures than those of the thermal infrared images. When the shadow effect was included, the differences were reduced more in high-rise sites, up to 4.2℃.

This study tested different surface materials (fabrics) and shadow effects. The correlation of surface temperatures between the thermal infrared images and in situ data were not substantial. Therefore, a more advanced approach, such as an energy balance model analysis, will be investigated for further studies.

Acknowledgments

FIGURE 2. Surface temperatures derived from ASTER thermal infrared bands

①homogeneous sidewalk brick, ② homogeneous lawn,

③ CWNU, ④ park, ⑤ low-rise APT, ⑥ commercial

area, ⑦ single residential, ⑧ high-rise APT

(4)

This study is supported by Korea Aerospace Research Institute (2012-0091-0000) for a project entitled

“Development of Calibration Methods of Surface Temperature using Thermal Infrared Bands of Satellite Imagery and in Situ data”.

References

Quattrochi, D.A., Luvall, J.C. (1999) Thermal infrared remote sensing for analysis of landscape ecological processes: Methods and applications. Landscape

Ecology 14 (6), 577-598.

Voogt, J.A., Oke, T.R. (1998) Effects of urban surface geometry on remotely sensed surface temperature.

International Journal of Remote Sensing 19 (5), 895- 920.

Weng, Q., Lu, D., Schubring, J. (2004) Estimation of land surface temperature-vegetation abundance relationship for urban heat island studies. Remote sensing of Environment 89 (4), 467-483.

Table 2. Shading percentages in the sites and mean surface temperatures and variations before and after including shadow effect

Sites CWNU Low-high APT Commercial area

Single

residential Park High-rise APT Homogeneous lawn

Homogeneous sidewalk brick Shading

(%)

sunny shady sunny shady sunny shady sunny shady sunny shady sunny shady sunny shady sunny shady 89.65 10.35 81.21 18.79 76.05 23.95 85.31 14.69 90.16 9.84 67.50 32.50 96.56 3.44 89.61 10.39 Mean

surface temperature

(℃)

before after before after before after before After before after before after before after before after 49.02 47.84 51.66 49.38 55.19 51.18 53.45 51.20 46.46 46.17 52.27 48.03 48.00 48.07 50.17 49.60 variation 1.18 variation 2.28 variation 4.01 variation 2.25 variation 0.59 variation 4.24 variation -0.07 variation 0.57

FIGURE 4. Comparison of surface temperatures between thermal infrared images and in situ data after including shadow effect

FIGURE 3. Comparison of surface temperatures between thermal infrared images and in situ data

FIGURE 1. Classification for surface fabrics
FIGURE 2. Surface temperatures derived from  ASTER thermal infrared bands
Table  2.  Shading  percentages  in  the  sites  and  mean  surface  temperatures  and  variations  before  and  after  including shadow effect

参照

関連したドキュメント

6 HUMAN DETECTION BY TILTED SENSORS FROM CEILING Based on previous studies, this paper presents an approach to detect human 2D position, body orientation and motion by using

Key words: micro cutting, cutting temperature, infrared radiation pyrometer, optical fiber, thermal partition coefficient, diamond tool, melting point... 上田 ・佐藤 ・杉田:微

The purpose of the present paper is to investigate mathematically the infrared (IR) catastrophe for Nelson’s Hamiltonian [25], in particular non- existence of ground state and

Thus, in Section 5, we show in Theorem 5.1 that, in case of even dimension d > 2 of a quadric the bundle of endomorphisms of each indecomposable component of the Swan bundle

In this work, we have theoretically studied the effect of thermal radiation and thermal diffusion on unsteady MHD free convection heat and mass transfer flow of an

16 examined the simultaneous effects of variable viscosity, variable thermal conductivity, and Ohmic heating on the fluid flow and heat transfer past a continuously moving porous

So, the aim of this study is to analyze, numerically, the combined effect of thermal radiation and viscous dissipation on steady MHD flow and heat transfer of an upper-convected

Conley index, elliptic equation, critical point theory, fixed point index, superlinear problem.. Both authors are partially supportedby the Australian