京都府における個人漁業に関する漁業収益の要因分析
望月政志
京都府農林水産技術センター海洋センター
2017年3月
農林水産省の漁業センサスによれば,2013年の全国 の海面漁業経営体数は,この10年間で約3割減少し, 94,507経営体となっている。その主な減少要因として は,全体の約95%を占める個人経営体の衰退があげら れ,2003年に125,931経営体あった個人経営体数は, 2013年には89,470経営体にまで減少している。海面漁 業の経営体数は京都府においても減少傾向にあり,個 人経営体は2003年から2013年にかけて1,020経営体か ら794経営体へと約20%減少している。さらに,京都 府では,個人経営体の約90%に相当する経営体に後継 者がいない状況にある。 既存研究によると,個人漁業の一経営体当たりの平 均漁獲金額と漁家子弟の自営漁業継承率の間には高い 相関がみられる(山内,2010)ことから,漁業収益が 高くなれば漁家子弟の後継へのインセンティブが高ま ることが期待される。また,漁業就業者数の動向は他 産業の収入などの外的要因が大きく影響しており(林, 2008),個人漁業の新規就業者数を増やすためには, 漁業収益を高め他産業と比べても漁業所得が見劣りし ないようにすることが重要と考えられる。したがって, 漁業収益を高めることは漁家経営を良くするだけでな く,後継者確保にも寄与すると考えられる。また,個 人漁業では,主とする漁業以外に複数の漁業を営む複 合経営体が多いが,これまで複合経営に関する研究に ついては,操業の実態調査(森脇ら,2011,村山ら, 2006)はあるが,漁業収益に関する要因分析はされて こなかった。 そこで本研究では,主とする漁業の漁獲金額を高め る要因として,漁獲金額に占める魚種銘柄構成比の違 いに着目し,その影響について検討した。また,各経 営体が営んでいる漁業種類やその数といった複合経営 の内容の違いに着目し,それらが総漁獲金額に与える 影響について検討した。分析対象には,京都府内で経 営体数の多い釣・延縄漁業と採介藻漁業を主とする経 営体を選定した。 材料および方法 使用するデータ 漁獲金額は,京都府漁業協同組合 (以下,府漁協)がとりまとめた2015年の府漁協支所 別の漁業種類別魚種銘柄別漁獲金額および組合員コー ド別漁業種類別漁獲金額の資料(以下,府漁協資料) を用いた。府漁協支所(以下,支所)は,東から順に 大浦,舞鶴,宮津,養老,伊根,浦島,丹後,網野, 湊の9地域に配置されているが,本研究では伊根と浦 島については一つにまとめた。組合員コードは,基本 的には一組合員一コードとなっていることから,本研 究ではそれぞれの組合員コードを一つの経営体とみな した。 府漁協資料で区分されている個人漁業の漁業種類に は,たこ壺,釣,延縄,桁曳,刺網,小型定置網,船 曳,養殖,採貝,採藻,水視*,底曳網があるが,底 曳網については他と比べて生産規模が顕著に大きいこ とから分析対象から除外した。本研究では,釣と延縄 をあわせて釣・延縄漁業(HLF)と定義し,採貝,採 藻,水視を一つにあわせて採介藻漁業(CSS)と定義 して集計した。なお,釣・延縄漁業を主とする経営体
京都府における個人漁業に関する漁業収益の要因分析
望月政志
Factor analysis for the personal fishery revenue in Kyoto Prefecture
Masashi Mochizuki
This study analyzed the factors associated with personal fishery revenue in Kyoto Prefecture, which consisted mainly of handline and longline fishing (HLF) or collecting shellfish and seaweeds (CSS). We focused on differ-ences in the fish brand composition ratio and multiple management. As results, no difference was found in the mean amount of HLF fishery money per management body owing to a difference in the fish brand composition ratio. In the CSS, the mean amount of fishery money per management body of the area with a high proportion of Crassostrea nippona was larger than the area with a high proportion of Haliotis. It was more effective to have more than four types of HLF fisheries than to specialize in one fishery. The CSS management decided to increase the total amount of fishery money by engaging in more than five types of fisheries.
キーワード:個人漁業 漁獲金額 採介藻漁業 釣・延縄漁業 複合経営
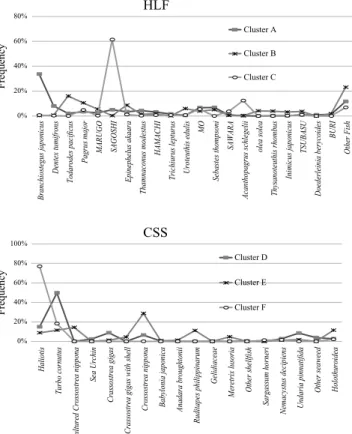
Fig. 2 Characteristic of each cluster by fish brand compo-sition ratio.
SAWARA: Scomberomorus niphonius more than about 1kg. SAGOSHI: Scomberomorus niphonius less than about 1kg.
BURI: Seriola quinqueradiata more than about 80cm in body length. MARUGO: Seriola quinqueradiata about 60-80cm in body length. HAMACHI: Seriola quinqueradiata about 40-60cm in body length.
TSUBASU: Seriola quinqueradiata less than about 40cm in body length. MO: Sebastiscus marmoratus,Sebastidae.
0% 20% 40% 60% 80% 100% Haliotis Turbo cornutus
Cultured Crossostrea nippona
Sea Urchin
Crassostrea gigas
Crassostrea gigas with shell
Crossostrea nippona Babylonia japonica Anadara broughtonii
Ruditapes philippinarum
Gelidiaceae
Meretrix lusoria Other shellfish
Sargassum horneri
Nemacystus decipiens Undaria pinnatifida Other seaweed Holothuroidea
Frequency CSS Cluster D Cluster E Cluster F 0% 20% 40% 60% 80% Branchiostegus japonicus Dentex tumifrons Todarodes pacificus Pagrus major MARUGO SAGOSHI Epinephelus akaara Thamnaconus modestus HAMACHI
Trichiurus lepturus Uroteuthis edulis
MO Sebastes thompsoni SAWARA Acanthopagrus schlegelii olea solea Thysanoteuthis rhombus Inimicus japonicus TSUBASU Doederleinia berycoides BURI Other Fish Frequency HLF Cluster A Cluster B Cluster C には,船曳や養殖を営む経営体はなかった。また,経 営体が営んでいる漁業種類のうち,総漁獲金額の30% 以上を占める漁業種類をその経営体が営む主な漁業と 定義し,その定義によって抽出した釣・延縄漁業249 経営体,採介藻漁業339経営体を分析対象とした。 魚種銘柄構成比に関する分析 釣・延縄漁業と採介藻 漁業の魚種銘柄別漁獲金額のデータを用いて,各魚種 銘柄が漁獲金額に占める割合を算出し,階層型クラス ター分析(Ward法,ユークリッド平方距離)により 各支所を分類した。また,各支所が属するクラスター の特徴を魚種銘柄構成比の平均値により示した。次に, 各クラスターの一経営体当たり平均漁獲金額の対数値 を算出し,その差の有無について平均値の比較を行っ た。平均値の比較には,一元配置分散分析を用いた。 一元配置分散分析で有意差があると判断された場合に は,多重比較検定を併せて行った。多重比較検定には, Tukey-Kramer法(Tukey, 1953; Kramer, 1956)を用い た。 複合経営に関する分析 各経営体が営む漁業種類やそ の数を説明変数とする順序ロジット分析を行った。各 経営体を総漁獲金額の小さい順にグループI,II,III, IVおよびVの5つのグループに区分し,それぞれにカ テゴリー変数を割り振り,この変数を目的変数とする 順序ロジット分析を行った。説明変数には,営んでい る漁業種類やその数に関するダミー変数を用いた。漁 業種類の数については,釣・延縄を釣と延縄に,採介 藻を採貝,採藻,水視に分け,たこ壺,桁曳,刺網, 小型定置網,船曳,養殖を含んだ合計11種類のうち, 経営体が営んでいる漁業の数とした。 本 研 究 で は , S t a t a 社 の 統 計 解 析 ソ フ ト ウ ェ ア Stata13.1を用いて分析を行った。 結果および考察 魚種銘柄構成比に関する分析 各支所の魚種銘柄構成 比についてのクラスター分析の結果をFig.1に示した。 両漁業とも3つのクラスターに分類された。釣・延縄 漁業では,伊根・浦島,養老,大浦,宮津支所はクラ スターA,丹後,網野,湊支所はクラスターB,舞鶴 支所はクラスターCに分類された。採介藻漁業では, 伊根・浦島,網野,大浦,丹後,湊支所はクラスター D,宮津,舞鶴支所はクラスターEに,養老支所はク ラスターFに分類された。
Fig. 1 Dendrogram of the cluster analysis by fish brand composition ratio for each fishery cooperative branch.
A
B
C
D
E
F
CSS
HLF
0.8
L2squared dissimilarity measure
0.4
Ine Yoro Oura Miyazu Tnago Amino Minato Maizuru Urashima
0
0.8
L2squared dissimilarity measure
0.4
0
Ine Amino Oura Tnago Minato Miyazu Maizuru Yoro Urashima
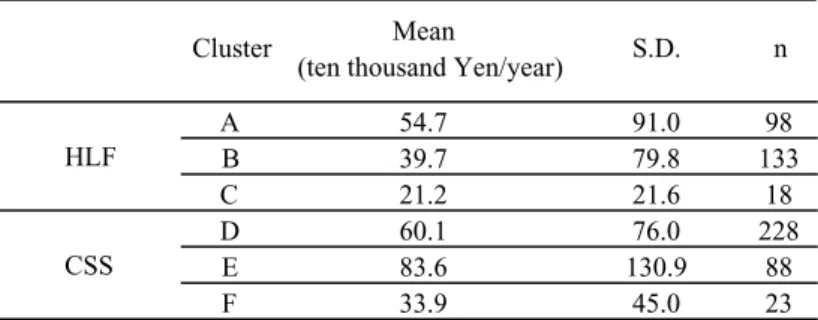
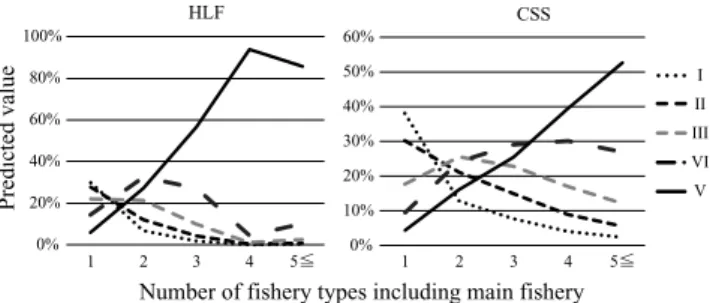
各クラスターの魚種銘柄構成比をFig.2に示した。 釣 ・ 延 縄 漁 業 で は , ク ラ ス タ ー A が ア カ ア マ ダ イ Branchiostegus japonicusの割合が高く(37%),クラス ターBでは特に目立った魚種銘柄は存在しないが,ス ルメイカ Todarodes pacificus,マダイPagrus major,キ ジハタ Epinephelus akaara の割合が比較的高かった ( 9 ∼ 1 6 % )。 ま た , ク ラ ス タ ー C は , サ ゴ シ Scomberomorus niphoniusの割合が高かった(61%)。 採介藻漁業では,クラスターDがサザエ Turbo cornu-tusの割合が高く(50%),クラスターEはサザエやア ワビ類 Haliotisの割合が低く(9∼12%),イワガキ Crossostrea nipponaの割合が高かった(天然イワガキ 29%,養殖イワガキ14%の合計43%)。クラスターFは, アワビ類 Haliotisの割合が高かった(77%)。 釣・延縄漁業,採介藻漁業の漁獲金額について, クラスター別の一経営体当たりの平均値と標準偏差 をTable 1に示した。釣・延縄漁業の平均漁獲金額で は,クラスターAが最も大きく,次いでクラスターB, クラスターCの順であった。採介藻漁業の平均漁獲金 額では,クラスターEの平均値が最も大きく,次いで クラスターD,クラスターFの順であった。 各クラスターの平均値について一元配置分散分析 を行った結果をTable 2に示した。釣・延縄漁業につ いては,Prob>Fが0.104となり,統計的に有意な差は 認められなかった。一方,採介藻漁業は,Prob>Fが 0.045となり,有意水準5%で平均値に差が認められた。 採介藻漁業の各クラスターの平均値について,多重 比較検定を行った結果をTable 3に示した。有意水準 5%でクラスター間の平均値に差があったのは,クラ スターEとFであった。クラスターDとF,クラスター DとEの平均値には,統計的に有意な差は認められな かった。 以上のように,釣・延縄漁業では,魚種銘柄構成比 の違いにより一経営体当たり平均漁獲金額に差がある とはいえなかった。一方,採介藻漁業では差があり, 魚種銘柄構成比に占めるイワガキの割合が高い地域の 一経営体当たり平均漁獲金額はアワビ類の割合が高い 地域よりも大きいことがわかった。 複合経営に関する分析 順序ロジット分析の推定に用 いた諸変数の定義および記述統計量をTable 4に,推 定結果をTable 5に示した。 釣・延縄,採介藻を主とする経営体の漁業種類数ダ ミーはすべて有意かつ正であることから,複数の漁業 を営む複合経営は単一経営に比べて総漁獲金額の大き いグループに属しやすいことがわかった。漁業種類ダ ミーはすべて有意でないことから,特定の漁業を営む ことにより総漁獲金額が高まることは認められなかっ た。 次に,順序ロジット分析の推定結果から漁業種類数 を変化させた場合の目的変数の予測値(確率分布)に ついてFig. 3に示した。釣・延縄漁業を主とする経営 体では,総漁獲金額の最も大きいグループVに属する 確率は,漁業種類数が1つで6%,2∼3つで27∼57%, 4つで94%,5つ以上で86%であった。総漁獲金額の最 も小さいグループIに属する確率は,漁業種類数が1つ で30%,2∼3つで2∼7%,4つ以上で0%であった。採 Table 1 Summary statistics: Value of management body production
by cluster
Cluster Mean
(ten thousand Yen/year) S.D. n
A 54.7 91.0 98 B 39.7 79.8 133 C 21.2 21.6 18 D 60.1 76.0 228 E 83.6 130.9 88 F 33.9 45.0 23 CSS HLF
Table 2 Analysis of variance (ANOVA) results based on the mean of the cluster
Sum of
squares df Mean square F Prob>F
Bartlett's test for equal variances Between groups 17.298 2 8.649 2.29 0.104 Within groups 929.349 246 3.778 Total 946.648 248 3.817 Between groups 16.929 2 8.465 3.12 0.045 Within groups 911.146 336 2.712 Total 928.075 338 2.746 HLF CSS chi2(2) = 2.9971 Prob>chi2 = 0.223 chi2(2) = 0.4566 Prob>chi2 = 0.796 Null hypothesis of ANOVA: There are no differences between group mean scores. Alternate hypothesis: There is a significant difference between group mean scores. Null Hypothesis of Bartlettís Test: The variances are equal. Alternate Hypothesis of Bartlettís Test: The variances are not equal.
介藻漁業を主とする経営体では,総漁獲金額の最も大 きいグループVに属する確率は,漁業種類数が1つで 4%,2∼4つで16∼40%,5つ以上で53%であった。総 漁獲金額の最も小さいグループIに属する確率は,漁 業種類数が1つで38%,2∼4つで4∼13%,5つ以上で 2%であった。
Table 3 Tukey-Kramer pairwise comparisons
* Significant at the 5% level.
Group vs group Mean
dif TK-test D vs F 3.165 2.435 0.729 2.863 D vs E 3.165 3.396 0.232 1.587 F vs E 2.435 3.396 0.961 3.525* Group means (logarithmic value) Mean S.D. Mean S.D. Objective variable
Ranking group HLF&CSS: I=1, II=2, III=3, IV=4, V=5. It have divided the fishermen into five
groups in increasing order of total fishery amount money (I<II<III<IV<V). 3.01 1.41 3.01 1.41
Explanatory variable
Dummy variable on number of fishery types including main fishery
2 types dummy HLF&CSS: the number of fishery types is two=1 other number=0 0.18 0.39 0.24 0.43 3 types dummy HLF&CSS the number of fishery types is three=1 other number=0 0.08 0.27 0.19 0.39 4 types dummy HLF&CSS: the number of fishery types is four=1 other number=0 0.03 0.17 0.12 0.33 5 or more types dummy HLF&CSS: the number of fishery types is five or more=1 other number=0 0.04 0.21 0.07 0.26 Dummy variable on types of fishery operating with the main fishery
Octopus trap pot dummy HLF&CSS: operating=1 not operating=0 0.12 0.33 0.23 0.42 Handline fishing dummy CSS: operating=1 not operating=0 - - 0.19 0.39 Longline fishing dummy CSS: operating=1 not operating=0 - - 0.01 0.09 Dredge net dummy HLF&CSS: operating=1 not operating=0 0.09 0.28 0.14 0.35 Gill net dummy HLF&CSS: operating=1 not operating=0 0.15 0.36 0.26 0.44 Small type set net dummy HLF&CSS: operating=1 not operating=0 0.03 0.17 0.07 0.25 Boat seine dummy CSS: operating=1 not operating=0 - - 0.01 0.08 Marine culture dummy CSS: operating=1 not operating=0 - - 0.03 0.17 Shellfish dummy HLF: operating=1 not operating=0 0.04 0.20 - -Seaweed dummy HLF: operating=1 not operating=0 0.02 0.14 - -SUISHI dummy* HLF: operating=1 not operating=0 0.14 0.34 -
-Variable Definition HLF CSS
* SUISHI is a fishery that collects shellfish or seaweed using a box hydroscope from the ship.
Table 4 Definition and descriptive statistics of the variablesused for the orderedlogit analysis
Table 5 Estimated result of ordered logit analysis
***, ** Significant at 1% and 5% levels.
2 types dummy 1.76 0.56 *** 1.43 0.30 ***
3 types dummy 3.01 0.97 *** 2.00 0.44 ***
4 types dummy 5.44 1.74 *** 2.65 0.59 ***
5 or more types dummy 4.54 2.27 ** 3.19 0.81 ***
Octopus trap pot dummy 0.37 0.62 0.05 0.33
Handline fishing dummy - -0.33 0.33
Longline fishing dummy - 1.62 1.36
Dredge net dummy 0.51 0.78 0.08 0.40
Gill net dummy -0.04 0.64 0.43 0.32
Small type set net dummy -1.46 1.24 0.32 0.46
Boat seine dummy - 0.56 1.11
Marine culture dummy - 0.88 0.56
Shellfish dummy -1.28 1.09 -Seaweed dummy -0.68 1.05 -SUISHI dummy -0.48 0.63 -/cut1 -0.94 0.17 -0.35 0.18 /cut2 0.21 0.16 0.91 0.19 /cut3 1.27 0.18 1.96 0.21 /cut4 2.65 0.24 3.21 0.25 Number of observation Log likelihood Pseudo R2 Ranking group HLF CSS
Standard error Standard error Estimated coefficient Estimated coefficient 339 -481.470 0.118 249 -351.087 0.124
以上のように,釣・延縄や採介藻を主な漁業とする 経営体では,1つの漁業のみを営む単一経営よりも複 数の漁業種類を営む複合経営の方がより総漁獲金額が 大きくなる確率が高く,釣・延縄漁業では4種類以上, 採介藻漁業では5種類以上の漁業を営む複合経営が総 漁獲金額を高めるのに有効であるといえる。 文 献 林 浩志.2008. 漁業就業者の減少要因に関する基礎 調査.漁港漁場漁村技術研究所調査研究論文集, 20: 7-11
Kramer, C.Y. 1956. Extension of multiple range tests to group means with unequal numbers of replications. Biometrics 12: 307-310. 森脇晋平,開内 洋,中村初男,小谷孝治,竹森昭夫. 2011. 沿岸漁業の複合経営に関する研究−Ⅱ― 島根半島沿岸域における「いわしすくい網漁業」 及び「いわし浮しき網漁業」の操業実態と漁況 ―.島根水技セ研報,3: 1-13. 村山達朗,沖野 晃,石田健次,若林英人,由木雄一. 2006. 沿岸漁業の複合経営に関する研究−Ⅰ― 島根県におけるいか釣り漁業とはえ縄漁業の実 態調査結果―.島根水試研報,13: 1-10. Tukey, J. W. 1953. The problem of multiple comparisons.
Unpublished manuscript. Princeton University. 山内昌和.2010. 自営漁業就業者の再生産と将来見通 しに関する人口学的検討―漁業センサスの大海 区別データを基に―.「沿岸漁業における漁家 世帯の就業動向に関する実証的研究−平成21年 度事業報告−」(東京水産振興会編).187-210. 東京水産振興会,東京.
Fig. 3 Predicted value of composition ratio for ranking groups I-V. Refer to Table 4 for the definition of rank-ing groups I-V.
0% 20% 40% 60% 80% 100% 1 2 3 4 5≦ HLF 0% 10% 20% 30% 40% 50% 60% 1 2 3 4 5≦ CSS I II III VI V Predicted value