JAIST Repository
https://dspace.jaist.ac.jp/
Title A new resonance of the surface SHG from GaAs(001) in air
Author(s) Tanaka, Hideki; Mizutani, Goro; Ushioda, Sukekatsu
Citation Surface Science, 402-404: 533-536 Issue Date 1998-05-15
Type Journal Article
Text version author
URL http://hdl.handle.net/10119/4501
Rights
NOTICE: This is the author's version of a work accepted for publication by Elsevier. H. Tanaka, G. Mizutani, and S. Ushioda, Surface Science , 402-404, 1998, 533-536,
http://dx.doi.org/10.1016/S0039-6028(97)00968-0 Description
A NEW RESONANCE OF THE SURFACE SHG FROM GaAs(OOl) IN AIR Hideki Tanaka\ Goro MizutaniA,B and Sukekatsu UshiodaA
ASchool of Materials Science, Japan Advanced Institute of Science and Technology Tatsunokuchi-machi, Nomi-gun, Ishikawa 923-12, Japan
B"Fields and Reactions", PRESTO, Japan Science and Technology Corporation 1-1-1, Yanagi-machi, Okayama, Okayama-ken700, Japan
(Received )
The reflected optical second harmonic intensity from GaAs(OOI) has been measured in air as a function of the incident photon energy. We have found a resonance enhancement peak at ---IA5eV in the p-polarized input and p-polarized output (p-inlp-out) configuration. Because the sum frequency generation (SFG) intensity shows a one-photon resonance at the same photon energy, the observed structure in the SH intensity curve is also due to a one-photon resonance. The bulk SH response of GaAs was separately observed in the p-inls-out polarization configuration and does not show a resonance at this photon energy. Thus we conclude that the observed resonance at ---1.45eV originates from the naturally oxidized surface of GaAs(OO I).
The electronic states at the interfaces between GaAs and other materials play an important role in the operation of devices. A number of experimental and theoretical studies have been made on these interfaces. However, many
experimental studies have concentrated on the midgap states [1,4]. The interface electronic states in other energy regions have attracted little attention, but should be important if such states exist.
Optical second harmonic generation (SHG) serves as a method of surface analysis with high sensitivity to the electronic states at surfaces[6]. Using a light source with a fixed photon energy, several authors analyzed the reflected SH intensity pattern from the GaAs(OOI) surface[7-10]. They found that surface SHG of GaAs has an appreciable contribution to the total signal intensity. Using a tunable light source, Qi et al [4] found midgap interface states at buried
metallGaAs junctions, and Yeganeh et al [11] found interfacial electronic structures ofZnSe/GaAs(OOl) heterojunctions at 2.92eV and 2.72eV. The resonance at 2.92eV was assigned to the E1 transition of the buried GaAs, and the
resonance at 2.72eV was assigned to a transition within the ZnSe layer. In the present work, we have measured the reflected optical second harmonic intensity from GaAs(OOl) in air as a function of the incident photon energy from nm=1.37eV to 1.57eV. An oxide layer is formed on GaAs(OOI) in au. Weare interested in observing the electronic states of an oxidized surface of GaAs. In this work, we have found a resonance enhancement of SHG peaked at
1.45eV. From this result and the result of the sum frequency generation (SFG) experiment, we have concluded that this enhancement of SHG is a one-photon resonance.
The sample was a polished wafer of a Si doped n-type GaAs(lOO) single crystal with the carrier density 2X 1018cm-3• It was first etched in a solution of
HZS04:HzOz:HzO(=4: 1: 1) for 3 minutes, rinsed with deionized (DI) water, and was dried with Nz gas. All the experiments were performed in air at room temperature. Hence a native oxide layer is expected to have formed on the sample before the measurement.
The experimental setup for the SHG measurement was described elsewhere[9]. The light source of the fundamental frequency is an optical
parametric oscillator (Spectra Physics MOPO-730) driven by a frequency-tripbled Q-switched Nd3+:YAG laser (Spectra Physics GCR-250). In sum frequency
generation (SFG) experiments, the light beam from the OPO and the output beam of wavelength 1.06~m from the Q-switched Nd3+: YAG laser were focused onto the same spot on the sample surface.
In Fig. 2 (a) and (b) we show the polar plots of the SH intensity from the GaAs(OO 1) sample as a function of the sample rotation angle in p-inlp-out polarization configuration, at the excitation photon energies of =1.40eVand
=1.45eV, respectively. We define as the angle between the plane of
the exciting light is 45° from the surlace nonnal. These SH intensities are plotted along the radial direction.
We see four peaks in each of Fig. 2(a) and (b). These peaks originate from the nonlinearity of Ga-As-Ga-As- chains in the bulk structure along [110] and [1 TO] directions. Thus the patterns in Fig. 2 should have a four-fold symmetry, if there is no surlace contribution. The lowered symmetry seen in Fig. 2 is due to the interlerence between the isotropic surlace SHG and the bulk SHG. This
isotropic surlace SHG arises from the nonlinear polarization induced by the surlace . 'b"l" I t (2) (2) (2) [9]
nonlmear susceptl 1 ltye emen s Xs,zzz or Xsxzx = XS,}Zy .
We see that the ratios of the peak heights of the lower peaks ( =45° and 225°) to that of the higher peaks ( =135° and 315°) are different for Fig. 2(a) and (b). This difference indicates that the intensity ratio of the surlace nonlinear effect to the bulk nonlinear effect varies as the excitation photon energy is changed.
Fig. 3(a) shows the SH intensity from GaAs(OOI) in air as a function of the excitation photon energy The dots represent the SH intensity for =315° (Curve A) and the open circles represent the SH intensity for =45° (Curve B). We see a peak in Curve A and a dip in Curve B at .-...-1.45eV. As a reference we show in the inset the SH intensity from GaAs(OOI) in air as a function of the excitation photon energy in a wide energy range when the incident plane is
-
-
-parallel to the [110] direction. We see that the variation of the SH intensity near =1.45eV is very sharp compared with that in other energy regions.
From a consideration based on the bulk and surface nonlinear optical susceptibilities, we will show that the peak and the dip observed in Fig. 3(a) originate from a surface effect. The nonlinear polarization induced in GaAs can be written as:
P
20J (z) =P
bu1k (z)+
P
surj (z)(2) - - (2) -
= XbulkEinEin
+
Xsurj (z)Ein Ein (1).-Here the term
P
bu1k (z) on the right hand side is the bulk dipolar nonlinear(2 )
polarization, and the term Psurj (z) is the surface nonlinear polarization. Xbulk is the bulk nonlinear susceptibility of GaAs. X;~;j (z) is the surface nonlinear susceptibility and is non-zero only near the surface. The phase of the bulk
-nonlinear polarization
P
bu1k (z) is shifted by when the sample rotaion angle is changed from one peak position to the adjacent one in Fig. 2(a). If the electric-field radiated by the isotropic nonlinear polarization Psurj (z) [9] is superposed on
-that by
P
bu1k (z), they interfere constructively at =45° and 225°, and destructively at negative interference at =135° and 315°. Here the surface nonlinear-polarization Psurj (z) is not so large as to change the sign of the electric field radiated by the bulk nonlinear polarization
P
bu1k (z). Now, if we increase the bulk nonlinear susceptibility, all four peaks in Fig. 2(a) will become larger. Onthe other hand, if we increase the surface nonlinear susceptibility, the peaks with constructive interference (Peak A in Fig. 2(a)) will rise and the peak with
destructive interference (Peak B in Fig. 2(a)) will become smaller. We see that Fig. 3(a) corresponds to the latter case, because Curve A has a peak and Curve B has a dip at ---1.45eV. Thus we can conclude that the surface nonlinearity changes its magnitude at ---1.45eV and makes structures in Curves A and B in Fig.3(a).
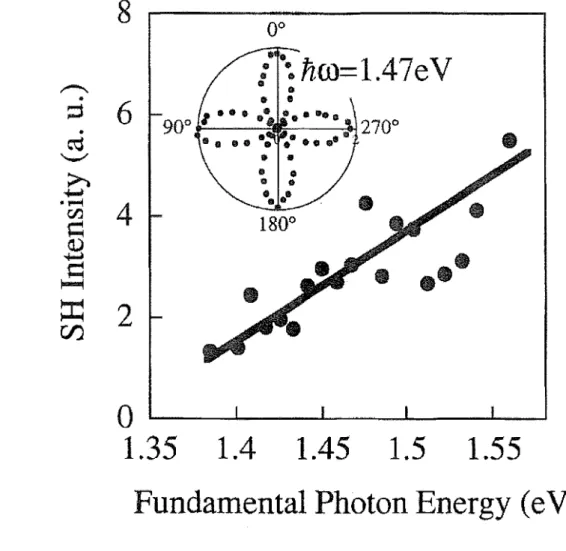
In order to confirm the conclusion of the previous paragraph, we have checked whether the magnitude of bulk nonlinearity changes in the energy region of interest. We performed a measurement in p-in/s-out polarization configuration. The effective surface nonlinear susceptibility elements x~~1zz or x~21zx= X~~~y for the GaAs(OOl) surface [9] do not contribute to the SH intensity in the p-in/s-out polarization configuration. Thus all the signal in the p-inls-out polarization
configuration arises from the bulk. Fig. 4 shows the SH intensity from GaAs(OOl) in air for the p-in/s-out polarization configuration for =0° as a
function of the excitation photon energy In the inset of Fig. 4 we show as a reference the polar plots of the SH intensity in the p-in/s-out polarization
configuration, at the excitation photon energy of =1.47eV. We see no structure in the SH intensity in Fig. 4. For GaAs there is an Eo gap transition at
=1.43eV and an Er gap transition at 2 =2.95eV. However, Fig. 4 shows no sharp change in the magnitude of bulk nonlinearity of the GaAs in this photon
energy range. From this fact we conclude that the structure seen in Fig. 3 does
not originate from the variation of the bulk nonlinearity.
There is alsO a possibility that the structure in Fig. 3 originates from the
structure in the Fresnel factors. However, this possibility is ruled out for the
following reasons. The Fresnel factors at the two sample rotation angles A and B
in Fig. 2(a) are the same, because GaAs is an optically isotropic medium in the
sense of linear optics. Hence if the Fresnel factors change as a function of the
incident photon energy , the SH intensity should change in the same way in
Curves A and B in Fig. 3(a). We see that this is not the case in Fig. 3(a). Hence
the variation of the SH intensity seen in Fig. 3(a) is not due to the variation of the
Fresnel factors.
From the arguments of the above paragraphs we should conclude that the
variation in the SH intensity seen in Fig. 3(a) can be attributed to the variation of
the magnitude of the surface nonlinearity in this photon energy range.
In order to check whether the above surface resonance is a one-photon
resonance or a two-photon resonance, we performed a sum-frequency generation
experiment. In Fig. 3(b) we show the sum frequency intensity from GaAs(OOI) in
air at the sample rotation angle of =315°. The photon energy of one light beam
was fixed at 1. 17eV and the photon energy of the other light beam was varied.
The horizontal axis of Fig. 3(b) is the photon energy of the latter light beam. As
that both structures seen in the SHG experiment (Fig. 3(a)) and the SFG
experiment (Fig. 3(b)) originate from a one-photon resonance.
At present we do not know the physical origin of the one-photon resonance
of surface states at the photon energy --1.45eV. The observed resonance is
near the bulk Eo band gap in energy (1.43eV) at room temperature. However,
because its resonance profile in Fig. 3(a) is different from that of the bulk response
profile in Fig. 4, we believe that the structure in Curves A and B in Fig. 3(a) does
not originate from the bulk Eo gap. Pashley et al observed surface electronic
density of states near the valence and conduction bands by scanning tunneling
spectroscopy[l4]. However, the observed density of states are so broad that we
cannot find a sharp peak like the one observed in our experiment. We may find a
peak of joint density of states at this energy difference in a theoretical band
diagram. Chang and Aspnes predicts existence of surface states both near the
conduction band and the valence band[2]. This combination of surface states may
correspond to the resonance discovered in our work. However, their calculation
was done for a clean surface, and we will need more experiments to establish a
correspondence between the experiment and the theory.
In conclusion, we have found a one-photon-resonant enhancement of
reflected SHG peaked at --1.45eV from GaAs(OOl) in air. We have concluded
that this SHG originates from the electronic state of the oxidized surface of
References
[1] W. E. Spicer, T. Kendelewicz, N. Newman, R. Cao, C. McCants, K. Miyano, I.
Lindau, Appl. Surf. Sci. 33/34, 1009 (1988).
[4] J. Qi, Angerer, M. S. Yeganeh, and A.G. Yodh, Phys. Rev. Lett. 75, 3174 (1995).
[6] Si/CaF2
[8] C.Yamada and T. Kimura, Phys. Rev. B49, 14372 (1994).
[9] M Takebayashi, G. Mizutani and S. Ushioda, Opt. Commun. 133, 116 (1997). [10] D. J. Bottomley, G. Luepke, J. G. Mihaychuk, and H. M. van Driel, J. Appl. Phys. 74, 6072(1993).
[11] M. S. Yeganeh, J. Qi, 1. P. Culver, and A. G.Yodh, Phys. Rev. B49, 11196 (1994).
[13] S. R. Armstrong, R. D. Hoare, M. E. Pemble, I. M. Povery, A. Stafford, A. G.
Taylor, B. A. Joyce, J. H. Neave and J. Zhang, Surf. Sci. 291, L751 (1993). [14] M. D. Pashley, K. W. Haberem, R. M. Feenstra, and P. D. Kirchner, Phys. Rev. B48, 4612 (1993).
[15] P. K. Larsen, 1. F. van der Veen, A. Mazur, J. Pollmann, 1. H. Neave and B. A. Joyce, Phys. Rev. B26, 3222 (1982).
Figure Captions
Fig. 2 The polar plots of the SH intensity from the GaAs(OOl) sample as a function of the sample rotation angle in p-inlp-out polarization configuration, at the excitation photon energy =1.40eV(a) and = 1.45eV(b). is the angle between the plane of incidence and the [100] direction on the GaAs(OOI) face.
Fig. 3 (a) The SH intensity from GaAs(OOI) in air as a function of the excitation photon energy Dots represent the SH intensity for =315° (Curve A) and open circles represent the SH intensity for =45° (Curve B). The inset shows the SH intensity in a wide energy range when the incident plane is parallel to [110] direction. In this figure SH intensity in p-in/s-out polarization configuration divided by that in p-inlp-out polarization configuration is shown and the efficiency of the detection system is not corrected for.
(b) The sum frequency intensity from the GaAs(OOI) in air using two light beams. The horizontal axis represents the varied photon energy of one light beam. The photon energy of the other light beam is fixed at 1. 17eV. Fig. 4 The SH intensity from GaAs(OOl) in air in p-in/s-out polarization
configuration for =0° (see Fig. 2(c» as a function of the excitation photon energy
•
•
•
••••
,...., o ... \00 0 ... o,
•
... 00 o o ~ ,...., ... o o ... ~ o o ... 00•
•
•
o o C6r-=---=~"t;---~
•
•
~ o oI