Title Enterotoxin Production and Growth of Staphylococcus aureusunder Various Environmental Conditions( 本文(Fulltext) )
Author(s) Shaheem, Elahi
Report No.(Doctoral Degree) 博士(獣医学) 甲第543号 Issue Date 2019-09-20 Type 博士論文 Version ETD URL http://hdl.handle.net/20.500.12099/79042 ※この資料の著作権は、各資料の著者・学協会・出版社等に帰属します。
Enterotoxin Production and Growth of
Staphylococcus aureus
under
Various Environmental Conditions
(各種環境条件下における黄色ブドウ球菌のエンテロトキシン産生
と増殖)
2019
The United Graduate School of Veterinary Sciences, Gifu University
(Tokyo University of Agriculture and Technology)
Chapter I General introduction
……….……… (1)I-1 Food-borne Disease……….……….……….…. (2)
I-2 Staphylococcus aureus ……….………...……..…….…..……….. (2)
I-3 Pathogenicity and virulence factors of staphylococci ………….…………...… (3)
I-4 Laboratory diagnosis of staphylococci ……….……….…... (4)
I-4-1 Microscopic and culture characteristic of S. aureus …...…….………(4)
I-4-2 Coagulase test ………..……..…... (5)
1-4-3 Real-time reverse transcription polymerase chain reaction (RT-PCR)….... (6)
I-5 Resistance and chemotherapy ………..………..………..…… (6)
I-6 Staphylococcal food poisoning (SFP) ………..……… (7)
I-7 Staphylococcal enterotoxins (SE) types ……….……….….… (9)
I-8 Enterotoxin production and growth of S. aureus under factors affecting growth and toxin production………..….……….…..… (11)
I-9- 1 Temperature ……….…..………... (11)
I-9- 2 pH ……….…………..…….….… (11)
I-9- 3 Water activity (Aw )………..….……….….….….…. (12)
Chapter II
SEA Production and Growth of S. aureus at Various
temperatures, and sea gene Expression of Strain 11658
……… (13)II-1 Background……….……….….………..……… (14)
II-2 Materials and Methods ………..………..……….… (16)
II-2-1 S. aureus strains ………..……… (16)
II-2-2 Culture ……….………... (16)
II-2-4 Cell counting ……….……….… (17)
II-2-5 Gene expression ……….………..….. (17)
II-2-6 Data analysis ……….………... (18)
II-3 Results and Discussion ……….……… (19)
II-3-1 SEA production and growth of strain 11658 at various temperatures ………... (19)
II-3-2 SEA production, expression of sea gene, and growth of strain 11658 in shaking and stationary cultures at the optimal temperature ………..……...….. (20)
II-3-3 SEA production and growth of several SEA producers at various temperatures ……….………...….. (22)
Chapter III Boundaries of SEA Production and Growth of S. aureus at
Various Temperatures and Salt Concentrations
………….………….… (31)III-1 Background ……….….… (32)
III-2 Materials and Methods ………….………....……..…. (33)
III-2-1 S. aureus cells ……….……….……….…. (32)
III-2-2 Sample preparation ……….……….……… (34)
III-2-3- SEA measurement ……….……….……. (34)
III-2-4 Cell counts ……….……….…..……. (35)
III-2-5 Model fitting ……….………….…...……. (35)
III-2-6 Validation of model performance ……….……….………. (36)
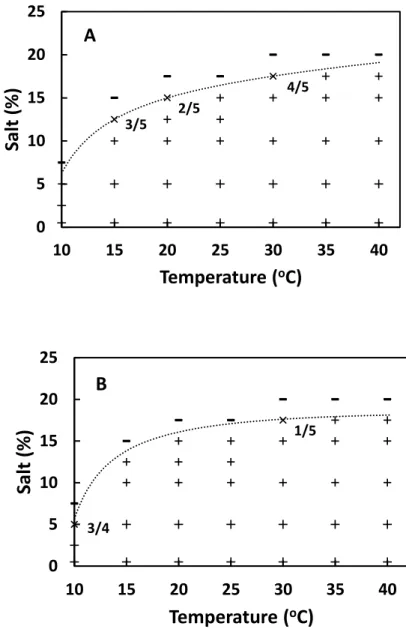
III-3-1 Boundary of SEA production on temperature and salt concentration
………...……….….. (36)
III-3-2 Boundary of staphylococcal growth on temperature and salt concentration ……….……...….. (37)
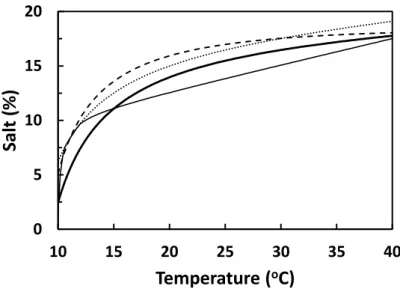
III-3-3 Comparison of SEA production and cell growth on temperature and salt concentration ………...………. (37)
III-3-4 Validation with external experimental data ……..………...……….. (37)
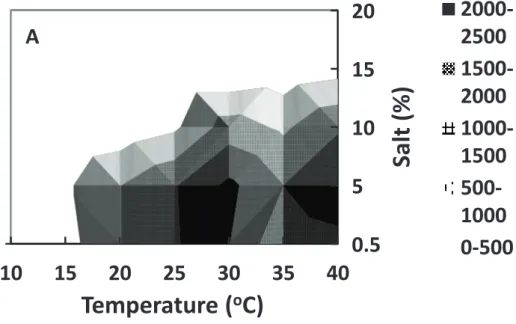
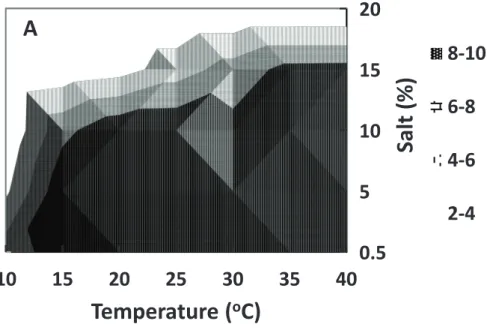
III-3-5 SEA production and cell growth at various temperatures and salt concentrations ………...……..….. (38)
Chapter IV General Conclusion
……….. (49)Acknowledgments ……..……….……….. (50)
Abbreviations
AW Water activity
ATC Akaike’s Information Center BHI Brain heart infusion
CFU Colony forming unit FBD Food-borne Disease
RT-PCR Real-time reverse transcription polymerase chain reaction
SFP Staphylococcal Food Poisoning SE Staphylococcal Enterotoxin
Chapter I
General introduction
I-1 Food-borne Disease
Food-borne disease (FBD) happens from consumption of food or water with contaminated microorganisms or chemicals (WHO, 2015). Le Lior et al. (2003) reported that 250 FBDs have been recognized and the clinical symptom of each FBD depends on the causative agents. The most common symptoms are vomiting and diarrhea, but some FBDs display as the neurological, gynecological, immunological and other symptoms (WHO, 2015).
Food-borne infectious disease develops by pathogens, while food-borne poisoning happens by toxic chemicals. Le Lior et al. (2003) reported that FBD outbreaks are defined as the incidence of two or more cases with the same clinical sign by intake of a common food. For example, in the United State annually about 76 million illnesses were suspected to be FBD, but only the causative agents of 14 million of the cases were identified.
In the United States food-borne diseases caused 325,000 hospitalizations and 5,000 deaths annually (Kadariya et al., 2014). It is estimated that two the thirds of the FBDs outbreaks are induced by bacterial agents (Le Lior et al., 2003). They described that among the majority of bacteria involved in FBDs in France between 1999 and 2000, S. aureus was the second most leading cause of gastrointestinal illness (Le Lior et al., 2003). Also, FBD records have revealed that SFP is the second cause of FBD outbreaks in Atlanta, United State between 1977 and 1981 (Holmberg and Blake, 1984).
I-2 Staphylococcus aureus
Staphylococcus aureus is a bacterium, classified as Gram-positive. The shape of the bacterium is round and looks like clusters of grape under a microscope. S. aureus is a facultative anaerobic bacterium, non-motile and does not form spores (Riemann and Bryan, 1979). S. aureus reproduces asexually by binary fission, and complete separation of the daughter cells. S. aureus is widely distributed and can be found in dust, water and normal flora of the skin and mucous membrane especially upper respiratory system of humans and animals. It is reported that up to 50% of people carry Staphylococci especially S. aureus as their normal part of the body (Riemann and Bryan, 1979; Soltys, 1979; Le Lior et al., 2003). Sometimes S. aureus roles as an opportunistic pathogen and cause a variety of diseases
skin syndrome, and abscesses to life-threatening illness like pneumonia, meningitis, osteomyelitis, endocarditis, toxic shock syndrome, bacteraemia, and sepsis (Soltys, 1979; Tong et al., 2015).
Staphylococci are also the common causative agent of hospital-acquired infections (Klein et al., 2007) and the cause of wound infection after surgery (Soltys, 1979; Destiny pharma, 2019). In the United States, around 500,000 patients in hospitals were infected with S. aureus and up to 50,000 deaths are reported each year (NIH, 1999; Schlecht et al., 2015). One of the major problems of staphylococci leading illness is the incidence of Staphylococcal food poisoning (SFP) over the world.
I-3 Pathogenicity and virulence factors of staphylococci:
Man and animals live with pathogenic staphylococci from birth until death, disease might occur only when the resistance is lowered. It is known that staphylococci from active lesions are more capable of initiating a new infection than those by the carriers (Soltys, 1979). This may because of that their virulence has been enhanced as the result of selection. Pathogenicity of most pathogenic staphylococci depends on the production of many factors, which is changing their level of pathogenicity. Some of S. aureus toxin production appears to be associated with phage (Riemann and Bryan, 1979; Soltys, 1979).
The several factors which may play part in the pathogenicity of staphylococci are the production of various enzymes like coagulase, hyaluronidase, phosphatase, DNase, penicillinase, protease, lipases, lysozymes, and lactic dehydrogenase (Soltys, 1979). S. aureus produces haemolysins like alpha, beta, and delta haemolysins and toxins like enterotoxins, leucocidin, exfoliatin, and various cellular antigens (Soltys, 1979). Staphylococci cause a wide range of diseases in humans and animals through toxin production and direct penetration (Soltys, 1979). The staphylococci produce enterotoxins by growing in improperly stored food items (Riemann and Bryan, 1979).
The toxicity grade of substances produced by S. aureus is different (Soltys, 1979). Among the substances mentioned above, the enterotoxins by S. aureus are much important because of their clear involvement in SFP (Soltys, 1979; Riemann and Bryan, 1979). Moreover, the toxins are used as a tool in the classification of staphylococci to determine their enterotoxigenic limits. There is no correlation between the production of enterotoxins and
other produced substances by staphylococci (Soltys, 1979). But, there is some evidence that coagulase and DNase positive staphylococci can produce enterotoxin (Riemann and Bryan, 1979; Soltys, 1979).
I-4 Laboratory diagnosis of staphylococci
The methods for identification of staphylococci are ranging from Gram staining reaction, microscopic appearance, cultural characteristics, biochemical reactions, and gene expression using Real-time reverse transcription polymerase chain reaction (RT-PCR) (Blair, 1958; Soltys, 1979).
I-4-1 Microscopic and culture characteristic of S. aureus:
S. aureus appears grape-like clusters through a microscope after staining with Gram-staining (Soltys, 1979). Direct smears of Gram-positive cocci from a lesion, agar culture, and broth provide indicative diagnosis information (Soltys, 1979). Microscopic Gram-stained S.
aureus from an agar culture appear as spherical and irregular clusters (Blair, 1958; Soltys,
1979). S. aureus from a broth culture appears as the small clusters, single cocci, pairs or short chains. Only by morphology S. aureus recognition is not enough. S. aureus is non-motile bacteria (Blair, 1958; Soltys, 1979).
To differentiate S. aureus from other cocci needs to use media and tests to accomplish identification. S. aureus can grow in all common media that contain carbohydrate, blood, and milk (Blair, 1958; Soltys, 1979). S. aureus colonies on a solid media look round, raised, smooth and pigmentation differs from gold to yellow, half-white and white (Soltys, 1979). Pigmentation of S. aureus colonies depends on several factors like the presence of oxygen, culture type, and culture incubation time at 37o C for one day or holding for two days (Blair, 1958). For example, S. aureus colonies on Nutrient agar appear white, half-white to yellow for 2 days incubation.
For more informative differentiation of S. aureus, selective media are recommended (Soltys, 1979). Mannitol-salt agar is a selective medium and differentiates S. aureus from other staphylococci like S. epidermidis by mannitol fermentation (Blair, 1958; Soltys, 1979).
aureus colonies on blood agar are raised, golden and shiny, 1 to 2 mm in diameter and
surrounded by a clear zone of haemolysis (Blair, 1958; Microbiology Picture, 2018).
On milk agar, S. aureus colonies are similar to that on blood agar, but with deep golden pigmentation. Also, clear areas can be found around colonies indicating digestion of milk casein by staphylococcal proteases (Blair, 1958; Willis et al., 1966).
Baird-parker agar is a selective media used to isolate and enumerate staphylococci coagulase-positive from food samples (Mendoza et al., 1991). Pyruvate and tellurite in Baird-parker agar stimulate the growth of S. aureus selectively and egg yolk as a differentiation agent. S. aureus colonies will appear from dark grey to black, shiny and 1 to 1.5 mm in diameter (Mendoza et al., 1991). The black colour of colonies is because of the tellurite reduction in a medium. The clear zone around the colonies is the results of proteolysis or lipolysis. An opaque zone is the result of lipase or lecithinase activity (Mendoza et al., 1991; Hardy Diagnostic accessed, 2019).
In a liquid medium of nutritionally enough, S. aureus in a static culture shows heavy turbidity, sedimentation, and a ring of growth at the surface of the liquid. Pigmentation performs in a moving culture, not usually in unmoving culture (Blair, 1958).
S. aureus has large, round, golden-yellow colonies, often with hemolysis when it was grown on blood agar plates. S. aureus produces many haemolysins; the two alpha-haemolysin and beta-haemolysin are the most famous haemolysins (Blair, 1958; Soltys, 1979). The alpha-haemolysin produces lysis on sheep and rabbit blood agars and cannot react against human erythrocytes (Soltys, 1979; Zhang et al., 2016). Although beta-haemolysin reacts on sheep, bovine, and human blood agars but do not react against rabbit red blood cells (Blair, 1958; Soltys, 1979).
I-4-2 Coagulase test
One of the abilities of pathogenic staphylococci is the production of coagulase reaction. Coagulase converts fibrinogen of plasma to fibrin and produces coagulation of blood plasma (Blair, 1958; Microbeonline, 2019). In many laboratories workers and researchers use a coagulation test as the most relatable test for the identification and differentiation of pathogenic coagulase-positive and pathogenic non- coagulase producing staphylococci
(Soltys, 1979). Non-pathogenic and other cocci cannot produce plasma coagulation (Blair, 1958).
1-4-3 Real-time reverse transcription polymerase chain reaction (RT-PCR)
Real-time reverse transcription polymerase chain reaction (RT-PCR) is a laboratory-based technique (ScienceDirect, 2009). It is a highly sensitive and specific method. Because of reliable detection and quantification, RT-PCR has become a powerful tool for the expression of a targeted gene. RT-PCR is usually used to check for genetically based diseases and to label gene expression in various tissue types, cell types, and over developmental time courses (ScienceDirect, 2009). Also, RT-PCR uses to clone cDNAs for further study with other molecular biology techniques. Researchers use RT- PCR to see the profile of the SE gene (se gene) expression in different steps of S. aureus growth with varying conditions of growth. A study monitored se genes expression of 28 enterotoxigenic staphylococci using qRT-PCR (Derzelle et al., 2009). The examined strains showed four distinct patterns of SE expression 1) transcription was not changed throughout bacterial growth 2) slight decrease in transcript levels after exponential phase 3)induction of expression at the end of an exponential phase or 4) modest increase of mRNA at the end of the exponential phase.
I-5 Resistance and chemotherapy
Staphylococci are non-sporulating bacteria, but they are more resistant microbe than the other non-sporulating bacteria (Soltys, 1979). Staphylococci can tolerate 70o C for half an hour or longer (Soltys, 1979). Staphylococci are usually sensitive to the certain concentration of antibiotic and disinfectants.
Formerly, staphylococci were sensitive to most of antibiotics, but now because of too much use of antibiotics and chemotherapy, many strains are resistant to antibiotics (Soltys, 1979). For example, penicillin-resistant strains of S. aureus become resistant by the production of penicillinase. Antibiotic resistance may develop by a genetic basis mechanism (Jensen and Lyon 2009; Foster, 2017).
I-6 Staphylococcal food poisoning (SFP):
SFP is a gastrointestinal disorder that occurs by ingestion of contaminated food with one or more staphylococcal enterotoxins, which are produced by some S. aureus (Roussel et al., 2015).
Symptoms of SFP have a rapid onset (2–8 h) and include nausea, violent vomiting, and abdominal cramping, with or without diarrhea. The disease is usually self-limiting and resolves within 24–48 h after onset. Sometimes SEs can be severe enough to infants, elderly or debilitated people (Argudin et al., 2010; MSD Manuals, 2019)
The susceptibility to SFP may vary by the individuals (Riemann and Bryan, 1979; Soltys, 1979). For instance, it was reported that a human volunteer, became ill by taking only 0.5 ml of filtrate culture of staphylococci, while another volunteer did not develop the disease by consuming 13 ml of the same filtrate (Riemann and Bryan, 1979). Moreover, a study showed that two individuals became ill by ingestion of 3.5 µg of enterotoxin B, but four other individuals did not become ill by taking 14 µg, voluntarily. A recent study reported that the total intake dose of SEA by the individuals were 20-100 ng in an outbreak in Kansai, Japan (Asao et al., 2003).
Usually developing SFP is depends on many factors. For illustration, that is related to the amount of consumed enterotoxin and contaminated food with the toxins, the distribution of toxin through the food unequally, and individual immunity (Riemann and Bryan, 1979; Soltys, 1979).
Immunity of individual against staphylococcal enterotoxins is based on the first or prior exposure to the enterotoxins and production of antibodies (Soltys, 1979). Since humans and animals constantly exposed to S. aureus, and it is not surprising that their sera contain antibodies to S. aureus. Experimental studies have shown that antibacterial and antitoxin antibodies dose not completely prevent the occurrence of staphylococcal disease, but the symptoms might be less severe (Riemann and Bryan, 1979; Soltys, 1979).
SFP is one of the common food-borne illnesses in the United States (Holmberg and Blake, 1984). In an investigation through 1977 to 1981, SFP was ranked as the second common cause of FBD affecting 7,000 individuals (Holmberg and Blake,1984).
In Japan and New Zealand SEP is a notifiable illness. In Hungary, in 1974, among food-borne diseases, 40% of outbreaks were staphylococcal food intoxication (Riemann and Bryan, 1979). In Japan, 20-25%, and in the United States, 25-30% of outbreaks were attributed to the SFP (Riemann and Bryan, 1979).
SFP occurs throughout the year and the incidence number is higher in summer (Riemann and Bryan, 1979). They reported that the data of SFP outbreaks were somewhat higher in May to September in 1972 and 1973 in Atlanta, Georgia (Riemann and Bryan, 1979).
In general, human is one of the sources of the causative agent of SFP. Human carries S.
aureus as their parts of normal skin flora. The main reservoir of the human body for S. aureus
is their nasal cavity (Williams, 1963). The individual nasal carriage rate is different and it is reported about 40-50% for adult and somewhat higher for children (Williams, 1963; Kluytmans et al., 1995). The most common skin sources are the hands, arms, and face. Besides, S. aureus can be found in the eyes, throat, in the hair, and intestinal canal (Riemann and Bryan, 1979; Soltys, 1979). So, the organism distributes from the mentioned sources to the air and dust, onto clothing, and more importantly may contaminate food. The two most relevant sources of food contamination are the nasal cavity and hand by food handlers (Riemann and Bryan, 1979; Jay et al., 2005).
Also, it is well known that S. aureus causes staphylococcal mastitis in dairy cows. Use of milk or milk product from infected cows causes food intoxications, too (Riemann and Bryan, 1979; Le Loir et al., 2003; Argudin et al., 2010).
It is not easy to determine food contamination sources with SEs. But, in most cases, it was found that food contaminated sources were the food handlers. A study of outbreak released that baked ham was contaminated by the handler during the slicing of ham (Riemann and Bryan, 1979). In another case, isolated S. aureus from an outbreak was the same as the nasal staphylococci of the person who packaged the baked ham (Riemann and Bryan, 1979).
Also, it is valuable to mention that the equipment is one of the sources of food contamination with S. aureus. Contamination may happen during the food processes from the start until market and consumption (Riemann and Bryan, 1979; Food safety.gov. 2019).
I-7 Staphylococcal enterotoxins (SE) types:
Using serologic methods, several different enterotoxins are recognized. Up to now, many SEs are recognized like classical types; SEA, SEB, SEC (with the SEC1, SEC2, and SEC3, SEC), SED and SEE. The new SEs types are also recorded like (SEG, SEH, SEI, SER, SES, SET) and staphylococcal Enterotoxins like protein (SElJ, SElK, SElL, SElM, SElN, SElO, SElP, SElQ, SElU, SElU2, and SElV). TSST-1, the toxic shock staphylococcal toxin, initially designated as SEF, lacks emetic activity (Soltys, 1979; Le Loir et al., 2003)
SEA, SED, and SEE share 70–90% sequence homology, while only 40–60% with SEB, SEC, and TSST-1 (Irina et al., 2010). Aantibodies against SEA react to SEE and some antibodies against SEB react with SECs (Jay et al., 2005). SEC3 is chemically and serologically related to SRC2 and SEC1. However, they differ anti-genetically, but antibodies can cross-react to each other (Jay et al., 2005).
The SEs are proteins and made of lysine, aspartic acid, glutamic acid, histidine, arginine, threonine, serine, proline, glycine, alanine, half-cystine, valine, methionine, isoleucine, leucine, phenylalanine, tryptophan, amide NH3 and tyrosine (Riemann and Bryan, 1979). Their mature length is approximately 220–240 amino acids, depending on the toxin (Irina et al., 2010), and their molecular size is on average ~25 kD (Riemann and Bryan, 1979; Irina et al., 2010). Most of the SEs possesses a cysteine loop, which is probably involved in the emetic activity (Le Loir et al., 2003).
Irina et al. (2010) reported that SEB is caused food poisoning, has been studied for potential use as an inhaled bioweapon. SECs isolated from animals (like bovine, and ovine) and causes lymphocyte proliferation (Marr et al., 1993). The all classical type of SEs (A to E) has emetic activity (Argudin et al., 2010).
SEs production is associated by gene coding. Most of genes coding are located on movable features such as plasmids, bacteriophages, chromosomes, and pathogenicity islands (Le Loir et al., 2003; Argudin et al., 2010; Irina et al., 2010). Hennekinnne et al. (2011) indicated that the synthesis of the SEA and SEE is phage associated, while SEB, SEC, and SED are associated by other genetic basis like plasmids and chromosomes, and pathogenicity
islands. Paulin et al. (2012) reported that productions of SEB, SEC, and SED are linked to quorum sensing through the accessory gene regulatory (agr) system.
Irina et al. (2010) described that SEs are known as the pyrogenic toxin superantigens (SAgs), that have the ability to stimulate large population of T cells, about 20- 30%. The excessive density of T cells leads to the massive release of chemokines and proinflammatory cytokines that may lead to potentially fatal toxic shock syndrome (Le Loir et al., 2003; Argudin et al., 2010; Irina et al., 2010). SEs have been thought to be entitled according to their emetic activities (Lina et al., 2004). Only SAgs that induce vomiting after oral administration in a primate model would be selected as the SEs (Argudin et al., 2010). Related toxins that lack emetic activity or have not been tested for that should be designated as staphylococcal enterotoxin-like (SEls) SAgs (Le Loir et al., 2003; Argudin et al., 2010). Riemann and Bryan, (1979) indicated that SEs are highly stable, and resistant to most of the proteolytic enzymes like pepsin, trypsin chymotrypsin, renin, and papain. Therefore, SEs keep their activity in the digestive tract after consumption. However, SEB can be damaged by pepsin at a pH around 2, but it resists pepsin at high pHs. As the normal condition, the pH of the stomach became high after food ingestion. SEs are heat resistant (Riemann and Bryan, 1979; Le Lior et al., 2003). SEs are thought to be more heat stable in foodstuff than in the laboratory medium (Le Loir et al., 2003).
Heat treatment during sterilization can inactivate SEs at a low concentration (Soltys, 1979; Le Loir et al., 2003; Argudin et al., 2010). Heat treatment of SEs in an acidic medium leads to the loss of immunological and biological activity (Le Loir et al., 2003; Argudin et al., 2010). Le Loir et al. (2003) reported that SEA and SED lose their serological activity, but they were still active in kittens in a vivo assay after heat treatment.
Inactivation of SEA, SEB, and SEC are different by SE Type, SE concentration, food matrix, and the pH (Schwabe et al., 1990). In some cases, heat inactivation is reversible in a high pH (Schwabe et al., 1990). Therefore, based on these records, SEs resist heath and a low pH at which SE producing strains can be killed easily (Le Loir et al., 2003; Argudin et al., 2010).
I-8 Enterotoxin production and growth of Staphylococcus aureus under factors affecting growth and toxin production;
Factors that affect the growth of S. aureus may affect the production of their toxins as well. The major factors that influence growth and toxin production are temperature, pH, water activity and atmospheric condition (Riemann and Bryan, 1979).
I-8-1 Temperature:
Many studies described that S. aureus can grow throughout the range from 7o C to 48o C, and the optimal temperature is reported from 35 o Cto 37o C (Riemann and Bryan, 1979; Jay et al., 2005). The minimum and maximum temperatures for SEs production were reported to be 10 o Cand 45o C, respectively while the optimal temperature for enterotoxin production was 37 o C - 45 o C (Hennekinne et al., 2011), and the toxin production was reported lesser at 25 o C and 30o C (Riemann and Bryan, 1979). Riemann and Bryan (1979) reported that SEB was produced 10 to 20 µg/ml at 16 o C and 20o C, while SEB produced 340 µg/ml at 37 o C. On the other hand, the growth of S. aureus was almost the same in both high and low temperatures mentioned above (Riemann and Bryan, 1979).
Riemann and Bryan, 1979 reported that SEA to SED were produced by S. aureus strains into brain-heart infusion broth (BHI) over a range of 19 o C to 39o C. SEA, SEC, and SED were produced at 45o C, but SEB was not produced. SEB was produced at 13 o C, while the D producer strain did not grow (Riemann and Bryan, 1979, Schmitt et al., 1990).
I-8-2 pH:
Most of the S. aureus can grow at pH ranging from 4 to 9.8 with optimum 6 to 7 (Riemann and Bryan, 1979; Hennekinne et al., 2011). S. aureus strains grow at a given pH depending on the type of medium, salt concentration, the size of the inoculum, and the atmosphere (Riemann and Bryan, 1979; Schwabe et al., 1990). The conditions for
staphylococcal growth are not so limited than for enterotoxin production. For instance, the pH for enterotoxin production is limited from 5.15 to 9 (Notermans and Heuvelman, 1983). Also, it is mentionable that the pH and salt combination makes pH rang narrower as the salt level was increased (Riemann and Bryan, 1979).
I-8-3 Water activities (Aw):
Aw is one of the most valuable factors for staphylococcal growth and enterotoxin
production. Some strains of S. aureus could grow at a lowest Aw as 0.83 and the optimum Aw was 0.98 (Hennekinne et al., 2011). However, other strains were able to grow at Aw 0.89 and 0.88 in laboratory medium and potato dough, respectively (Riemann and Bryan, 1979). Aw for enterotoxin production was accepted to be 0.85-0.99, and the optimum was reported 0.98 (Hennekinne et al., 2011).
Usually, SE production varies by a medium. For example, SEA was produced in some medium at Aw 0.90, but not in potato dough bellow 0.95 (Riemann and Bryan, 1979). SEB could be produced at 0.93 in potato and 0.97 in another medium (Riemann and Bryan, 1979; Notermans and Heuvelman, 1983).
Chapter II
SEA Production and Growth of S. aureus at Various temperatures, and sea
gene Expression of Strain 11658
II-1 Background
Staphylococcal food poisoning (SFP) outbreak is one of the major concerns of public health problem over the world (Asao et al., 2003; Schelin et al., 2011). For instance, in the total number of bacterial food poisoning outbreaks, SFP ranks as the third in the United States (Le Loir et al., 2003). A massive outbreak occurred in Osaka, with more than 14,000 patients who took milk products contaminated with SEA, in 2000, Japan (Asao et al., 2014).
SFP occurs by consumption of contaminated food with staphylococcal enterotoxins (SEs). Until now, 21 types of staphylococcal enterotoxins have been recognized. Jay et al., (2005) reported that the frequencies of the outbreaks are different by staphylococcal enterotoxin (SE) types.
From classical toxin types, A to E, the incidence of outbreaks by staphylococcal enterotoxin type A (SEA) is recorded as a more common type than the other types (Huang et al., 1987). The second most responsible for staphylococcal outbreaks are associated with staphylococcal enterotoxin type D (SED) (Lancet et al., 1981), and the fewest reported by staphylococcal enterotoxin type E (SEE) (Jay et al., 2005).
Toxin production and growth of S. aureus might be affected by environmental factors like temperature, pH, water activity, aerobic and anaerobic conditions, and salt concentrations (Bergdoll et al., 1979). Also, production of SEs is differed by strain, SE type, culture type, shaking and non-shaking culture, and the assay for SEA detection, and other factors (Czop and Bergdoll, 1979; Otero et al., 1990). The maximum and minimum temperature for SE production is ranged from 10oC to 45oC. (Woodburn et al., 1973; Bergdoll, 1979). The optimal temperature for SE production is accepted as 35 oC to 40oC (Vandenbosch et al., 1973).
Formerly, SE production was detected by the traditional assays, like Ouchterlony plate technique and the double gel-diffusion technique (Bergdoll, 1979). Also, Woodburn et al. (1973) reported that SEA production was more rapid in shading culture at 37 oC than without shaking. However, the assay, double-gel-diffusion test, they used for SEA detection was qualitative.
Now, new technology progressed in sensitivity and selectivity like fluoroimmunoassays have been developed (Park et al., 1994; Bennett, 1995). The new sensor technology can give a quantitative result of the SE amount in samples using a standard curve (Fujikawa and Morozumi, 2006; Sabike et al., 2014).
There are many reports of SEs production and properties of S. aureus strains under various environmental factors (Bergdoll, 1979). Recently, SEA producing strains are divided into high, medium, and low SEA producers, according to the amount of SEA production in the shaking culture at 37oC (Cao et al., 2012). They also expressed that the diversity in the SEA production was associated with the SEA gene expression level, sea, encoded on a phage. S. aureus is a facultative anaerobe bacterium. Accordingly, S. aureus can grow in shaking culture by respiration with oxygen, while in stationary culture, cells would grow by fermentation without oxygen. Tsutsuura et al. (2013) studied the temperature dependence of SEA in shaking culture.
The kinetical differences in SEA production and cell growth of S. aureus between shaking and stationary cultures have not been studied intensively. Therefore, through this study, we first investigated the characteristics of SEA production and growth of S. aureus strains at different temperatures in shaking and stationary cultures. The strain used in this study was strain 11658, which was studied intensively for its SEA production and in pasteurized milk or cheese curd during a cheese-making process (Aoyama et al., 2008). Explicitly, in this study, the difference between shaking and stationary cultures was analyzed in terms of SEA production and growth of the SEA producer in broth at various temperatures. The toxin amounts of culture samples were detected quantitatively using the fluoroimmunoassay described above. Furthermore, the kinetics of the expression level of the sea in S. aureus cells was studied concerning SEA production. Secondly, SEA production by several SEA producers was studied at various temperatures to characterize the toxin production of these strains.
II-2 Materials and Methods II-2-1 S. aureus strains
S. aureus strains 11658 (Aoyama et al., 2008) and 11727 were kindly provide by Prof. M. Sugai and Dr. Y. Sato of Hiroshima University, Japan. Strain 13008 was also kindly provided by Dr. A. Hirai of Tokyo Metropolitan Institute of Public Health, Japan. Strains f4 and St.1 were isolated from humans in our laboratory. These strains were all SEA producers and did not produce any other classical staphylococcal enterotoxin types B to E, as determined using a reversed passive latex agglutination test (Denka Seiken, Tokyo, Japan).
II-2-2 Culture
Bacterial strains were grown on Baird–Parker agar plates (Oxoid, Hants, UK) at 37°C for 2 days. Some well-grown colonies were then inoculated into brain heart infusion (BHI) broth (Becton, Dickinson and Company, Sparks, USA) and then cultured with shaking at 110 strokes/min and 37°C for 1 day on a shaker (MK161, Yamato, Tokyo, Japan). Cells were washed with saline (0.85% NaCl solution) by centrifugation at 15,000 × g for 15 min. Cells were thoroughly suspended in saline and then diluted to 105 CFU/mlwith saline. The cell suspension was inoculated into BHI broth at a ratio of 1:100 in volume to give a final concentration of 103 CFU/mland then dispensed into test tubes in 8 ml aliquots. The test tubes were stored with shaking at 110 strokes/min or without shaking at given temperatures in an incubator for certain periods. For each condition, three independent experiments were performed with one sample per experiment.
II-2-3 SEA measurement
The SEA concentrations in the supernatants of cultured samples were measured using an enzyme-linked fluorescence assay, VIDAS Staph enterotoxin II (bioMerieux, Marcy-l’Etoile, France) using a mini-VIDAS automated system. The supernatants of the samples were obtained by centrifugation at 15,000 × g for 15 min. The toxin estimation was done with a standard curve obtained with purified SEA (Fujikawa and Morozumi 2006; Sabike et al. 2014). Purified SEA was kindly provided by Denka Seiken Co. (Tokyo, Japan).
II-2-4 Cell counting
Viable cell counts of samples were measured using a plating method. Namely, samples were serially diluted 10-fold with saline, and then 0.1 ml portions of dilution were plated on nutrient or standard agar plates (two plates per dilution) (Nissui Pharmaceuticals, Tokyo, Japan). After incubation at 37°C for 2 days, the colonies on the agar plates were counted, and the mean population was calculated.
II-2-5 Gene expression
The measurement of SEA gene expression consisted of sequential steps of (i) preparation of RNA samples, (ii) cDNA construction, and (iii) relative quantification of mRNA by TaqMan real-time PCR (Wong and Medrano, 2005; Miyazaki et al., 2008).
(i) RNA was extracted from cells using a modification of the method by Lovenklev et al. (2004). Briefly, cells were collected from 2 ml of cell suspension cultured as described above by centrifugation and subsequently phenol and glass beads (acid-washed, φ≤106 µm) were added into the cells to homogenize them. Other steps in RNA extraction were conducted in accordance with the manufacturer’s protocol (ISOGEN, NIPPON GENE, Toyama, Japan). After RNA extraction, DNase treatment with DNase I (TaKaRa Bio, Kusatsu, Japan) was conducted to purify the samples for measurement. The total RNA concentration was confirmed using a Qubit assay (Life Technology, Eugene, USA). The samples were then stored at -30°C until use for cDNA construction.
(ii) First-strand cDNA was synthesized in two separate reverse transcription assays using the reverse primers for sea and gyrB reference gene in a final volume of 20 µl in accordance with the manufacturer’s protocol (TaKaRa Bio). The reverse transcription reaction for each sample was performed using a thermal cycler (TaKaRa Bio).
(iii) Primers and probe for the sea gene were newly designed using Primer Quest software on the basis of consensus sequences constructed from multiple alignment results of 41 strains of
S. aureus sea gene sequences deposited in the NCBI database (Integrated DNA Technologies,
Iowa, USA) as reported by Masuda et al. (2015). The primers and probe for sea developed in this study were:
Forward primer: 5’- GGATCTTCAAGCAAGACGTTAT-3’ Probe: 5’- CGTGTTTCATACTTCTACAGAACCTTCGG-3’ Reverse primer: 5’- CTGTCCTTGAGCACCAAATAAA -3’
To normalize the expression level of the sea gene, the mRNA of gyrB gene was also quantified using the primers and probe reported by Voyich et al. (2016):
Forward primer: 5’-CAAATGATCACAGCATTTGGTACAG-3’ Probe: 5’-AATCGGTGGCGACTTTGATCTAGCGAAAG-3’ Reverse primer: 5’-CGGCATCAGTCATAATGACGAT-3’
All probes were labeled with the fluorescent reporter dye FAM (6-Carboxyfluorecein) at the 5’ end and with the fluorescent quencher dye TAMRA (6-Carboxytetramethylrhodamine) at the 3’ end. TaqMan real-time PCR was performed by mixing of 12.5 µl of TaKaRa premix Ex Taq (TaKaRa Bio), 2 µl of diluted cDNA, a primer-probe mixture (4 µl and 2 µl of mixture were added for sea assay and gyrB assay, respectively), and nuclease-free water to a final volume of 25 µl. Nuclease-free water and genomic DNA extracted from S. aureus were used as negative and positive controls, respectively. Gene expression was measured using a real time thermal cycler (TP800, TaKaRa Bio), and the thermal conditions were as follows: the first denaturation step was 1 cycle at 95°C for 30 sec, and then monitored 40 cycles by holding at 95°C for 5 sec and 63°C for 30 sec. The relative quantification of the sea and gyrB genes was calculated with each standard curve in accordance with the manufacturer’s protocol (TaKaRa Bio).
II-2-6 Data analysis.
The average and standard error at data points were calculated for three independent experiments. The averages of growth and SEA production at data points were analyzed using an extended logistic model (Fujikawa et al., 2004; Fujikawa and Morozumi, 2006). The relationship between SEA production (or microbial population) and temperature was analyzed using Spearman’s rank correlation method (Tsutsuura et al., 2013) with statistical analysis software, R.
II-3 Results and Discussion
II-3-1 SEA production and growth of strain 11658 at various temperatures
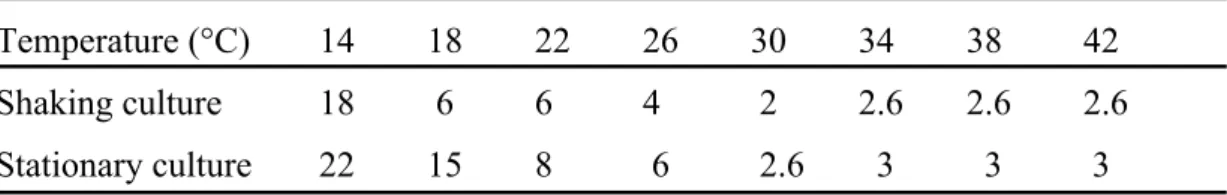
Strain 11658 was studied as an example of SEA producer to determine its characteristics in toxin production at various temperatures ranging from 14°C to 46°C in shaking and stationary cultures. The time points when this strain produced SEA at maximum concentrations in shaking and stationary cultures at these temperatures are shown in Table 2-1. Toxin production reached its maximum fastest at 30°C in both the shaking and stationary cultures. Neither staphylococcal growth nor subsequent SEA production was observed at 46°C in both culture conditions.
The pattern of the maximum SEA concentration of the strain in the shaking culture at various temperatures showed an upwardly convex shape with a peak at 30°C (Fig. 2- 1A), showing that the optimal temperature for SEA production by this strain was 30°C. In the stationary culture, the maximum SEA concentrations at these temperatures were much lower than those in shaking cultures and did not have a peak (Fig. 2-1A). Of interest, the maximum toxin concentration in stationary cultures increased gradually with temperature (Fig. 2- 1A).
The cell populations of the culture samples were measured at the times when the maximum toxin concentrations were observed (Table 2-1 and Fig.2-1B). These populations were designated as the maximum populations. The temperature dependency of the maximum population in shaking and stationary cultures is shown in Fig. 2-1B. The maximum populations at the temperatures examined ranged from 9.5 to 10.4 log CFU/ml. No clear correlation of the maximum population (in log) in shaking cultures with these temperatures was observed at ρ=-0.07 using Spearman’s rank correlation. Similar results were observed in the stationary cultures (Fig. 2-1B).
The maximum SEA concentrations in shaking cultures at these temperatures were much higher than those in stationary cultures, as shown in Fig. 2-1A. The differences in the maximum concentrations between the two cultures at these temperatures are shown in Table 2-2. The ratio of shaking culture over stationary culture in SEA production varied from 3.48 to 22.6 by the temperature. The maximum populations in shaking culture were higher than those in stationary culture at all temperatures examined, as shown in Fig. 2-1B. The differences in maximum population between the two culture methods were almost constant with an average of 9.91±1.85 (or 0.99±0.029 in log) in the temperature range shown in Table 2-2.
SEA productivity, which was defined as the maximum SEA amount per cell in the present study, was examined between the two culture methods at various temperatures. Namely, toxin productivity (ng/CFU) was calculated by dividing the maximum SEA concentration (ng/ml) by the maximum population (CFU/ml), the results of which are presented in Fig. 2-1. Toxin productivity was generally higher at higher temperatures over 30°C for both culture methods (Table 2-3). This increase was more remarkable in the stationary culture than in the shaking culture. Thus, the toxin productivity in the stationary culture was higher than that in the shaking culture at higher temperatures from 26°C to 42°C, as shown by ratios of <1 in Table 2-3. This could come from the fact that toxin productivity was strongly affected by the population. Namely, a difference of a factor of ten (one log) in the population was observed between the two culture methods, whereas the difference in SEA production was not so great, especially at higher temperatures (Fig. 2-1).
II-3-2 SEA production, expression of sea gene, and growth of strain 11658 in shaking and stationary cultures at the optimal temperature.
The kinetics of SEA production and growth of strain 11658 at the optimal temperature (30°C) were further studied for both culture methods. Microbial growth in the shaking culture was similar to that in the stationary culture (Fig. 2-2A). Namely, the periods of the lag phase for the two cultures were very short and close to each other, being 1.6 h and 1.4 h in shaking and stationary cultures, respectively. The rate constants of growth, which are the slopes of the log phase, for the two culture methods were also similar, at 1.1 (1/h) and 1.2 (1/h) in shaking and stationary cultures, respectively. The only difference between the cultures was observed in the late log and the stationary phases of growth. The maximum population in the stationary phase in the shaking culture was about 1 log CFU/ml higher than that in the stationary culture (Fig. 2-2A and Table 2-2).
The toxin production curves in the shaking and stationary cultures were both sigmoidal (Fig. 2-2A). Compared with cell growth, SEA production was delayed in both cultures; the time differences in the lag period between cell growth and toxin production in the shaking and stationary cultures were both about 12 h. Some quantitative differences were observed between the cultures. SEA production in the shaking culture was more remarkable in the late
culture (31 ng/ml/h). A large difference was also seen in the maximum SEA concentration between the cultures; the maximum concentration in the shaking culture (2,000 ng/ml) was 10 times higher than that in the stationary culture (200 ng/ml) (Fig. 2-2A). The toxin concentration reached its maximum in the stationary phase of growth (about 48 hours of incubation) in the shaking culture. This was also observed for other SEA-producing strains (Wallin-Carlquist et al., 2010; Cao et al., 2012; Tsutsuura et al., 2013). The time in the stationary culture was not clear because of its low production, but was estimated to be also about 48 hours of incubation (Fig. 2-2A). This length of time was the same as in the shaking culture. To our knowledge, there have been no reports on the period required to reach the maximum SEA concentration in stationary culture of a staphylococcal strain.
The kinetics of the expression of the SEA gene, sea, in microbial cells during the incubation period in shaking and stationary cultures was studied to the time when the SEA concentration reached its maximum (Fig.2- 2B, C). Here the relative expression quantity of
sea gene transcription was determined in reference to the housekeeping gene encoding gyrB.
The toxin gene expression levels in the two cultures had both peaked at 20 hours of incubation, which was in the early stage of toxin production (Fig. 2-2B, C). sea expression amounts at data points in microbial cells were accumulated along with the incubation time to see the dynamics of sea gene expression followed by SEA synthesis. The toxin production curves and the total, accumulated gene expression curves with time were all sigmoidal (Fig. 2-2B, C). Total gene expression in the cells preceded toxin production in both culture methods. Namely, the time lags between total sea expression and SEA production were observed in both cultures (Fig. 2-2B, C).
The kinetics between the gene expression and the production of a given protein has rarely been reported, to the best our knowledge. The time lags measured in the present study could be for the process between messenger RNA transcription and protein synthesis in the central dogma of molecular biology proposed by Crick (1958). Cao et al. (2012) reported that the time difference between the build-up of sea mRNA and that of extracellular SEA was approximately 6 h in their strain, Mu 50. It appears that they measured the time difference between the peaks of the two factors during incubation, which differed from our kinetic analysis.
The Mu 50 strain analyzed by Cao et al. (2012) produced an extremely high amount of SEA (about 10,400 ng/ml) after a 24-hour incubation with shaking in BHI at 37°C. The base
sequences for SEA and the relative quantification test used by Cao et al. (2012) were different from those in the present study, because we could not utilize the method of Cao et al. (2012) in our preliminary studies. However, the patterns of gene expression and toxin production of strain 11658 and Mu 50 during the incubation period were similar. This suggested that the kinetics of sea mRNA expression and subsequent SEA production observed in our study could be general.
II-3-3 SEA production and growth of several SEA producers at various temperatures
.
The characteristics of SEA production and the growth of several SEA-producing strains (13008, St.1, f4, and 11727) were studied at various temperatures in shaking culture. The maximum concentrations of SEA and the maximum cell populations of bacterial strains were studied at various temperatures ranging from 22°C to 42°C. Bacterial cells of the tested strains were incubated until the toxin concentrations reached the maximum at each temperature. The incubation times at 22°C, 26°C, 30°C, 34°C, 38°C, and 42°C were 6, 4, 2, 2, 2, and 2 days, respectively.SEA production in this temperature range varied with the strains (Fig. 2-3A). Strain 13008, which produced very high amounts of SEA at various temperatures, showed the maximum concentration at 38°C. Strain St.1 also produced high amounts of SEA at 22 to 34°C and had a peak at 26°C. Strain f4, a high producer, did not show a clear peak in this temperature range, whereas the concentration at 22°C was slightly higher than those at other temperatures. Strain 11727, a low SEA producer, did not show a peak in this temperature range, whereas the SEA concentration at 22°C was slightly higher than those at other temperatures. The SEA production of strain 11658, which was studied precisely above, was an intermediate producer among the strains examined in the present study.
Compared with SEA production, no clear differences in the maximum cell population were observed among the SEA producers at temperatures between 22°C and 42°C (Fig. 2-3B); the averages of the maximum populations of the five strains at 22°C, 26°C, 30°C, 34°C, 38°C were 10.0±0.25, 10.0±0.18, 10.0±0.18, 9.9±0.11, 9.6±0.31, and 9.2±0.29 log CFU/ml, respectively.
characteristics were observed for the strains (Table 2-4). Among the strains clear differences were observed in the optimal temperature and maximum SEA concentration of the strains, but there were small differences in the maximum cell population.
The optimal temperature range for SE production by S. aureus has been reported to be between 30°C and 40°C (Vandenbosch et al., 1973) or between 34°C and 40°C (Schelin et al., 2011). The optimal temperature of strain 11658 studied above (30°C) was within the range given by Vandenbosch et al. (1973), while those of the other three strains in Table 2-3 were also lower than these temperature ranges. The maximum SEA concentrations differed extensively according to the strain, from 180 to 5240 ng/ml (Table 2-4). Cao et al. (2012) also found a huge difference in SEA production among S. aureus strains incubated at 37°C.
Large differences in SEA productivity were observed among the five strains; the highest SEA productivity (0.64 fg/CFU), which was observed for strain 13008, was 21 times higher than the lowest (0.03 fg/CFU) by strain 11727 (Table 2-4). Tsutsuura et al. (2013) also reported that SEA productivity in shaking culture varied with the temperature, strain, and inoculum size. Although the strains and culture conditions in the present study were different from those of Tsutsuura et al. (2013), the values shown in Table 2-3 were within their ranges.
Some of the above strains were also used in preliminary studies of SEA production in stationary culture (data not shown). Consequently, the SEA productivities of strains 13008 and f4 in stationary culture at 30°C, 34°C, and 38°C were higher than in shaking culture, similar to that of strain 11658 (Table 2-3). On the other hand, the SEA productivity of strain 11727 in stationary culture was lower than in shaking culture at these temperatures. These results also suggested that toxin productivity differed according to the culture conditions and was strain specific.
Cao et al. (2012) divided their SEA producers into three groups: a high producer group (>1,000 ng/ml), an intermediate group (10–1,000 ng/ml), and a low group (<10 ng/ml) according to toxin production at 37°C. When these categories were applied to our strains, the results of the culture at 38°C, which was the closest to 37°C, indicated that 3 of the 5 strains (strains 13008, f4, and 11658) were high producers and two (strains 11727 and St.1) were intermediate producers (Fig. 2-3). However, strain St.1 produced higher amounts of SEA at lower temperatures (Fig. 2-3); it produced as much as 3780 ng/ml at 26°C, showing that this strain is potentially a high producer. Therefore, the present study suggested that each staphylococcal strain has its own specific optimal temperature for SEA production. Namely,
toxin production by a given strain at a single temperature, such as at 37°C, might not be suitable to fully characterize that strain.
The present study showed the diversity of SEA production among staphylococcal strains; SEA production varied with the environmental conditions including the temperature and culture method. The reasons for this diversity were unknown. Cao et al. (2012) demonstrated that sea expression in a SEA-producing strain is correlated with the clonal lineage of sea-carrying phages. Therefore, it can be expected that the dynamics of the growth of the phages in staphylococcal cells in various conditions could be a clue to understand the variety of SEA production.
A.
B.
Fig. 2-1. Maximum SEA production and cell population of strain 11658 at various temperatures in shaking and stationary cultures.
A. SEA production, B. cell population. Cells were grown in shaking (●) and stationary (■) cultures at various temperatures between 14°C and 42°C. Bars show the standard errors at data points.
0
500
1000
1500
2000
2500
10
20
30
40
SE
A (
ng
/m
l)
Temperature (
oC)
5
7
9
11
10
20
30
40
lo
g (
CF
U/m
l)
Temperature (
oC)
A. B.
0
500
1000
1500
2000
2500
2
4
6
8
10
0
20
40
60
80
SE
A (n
g/m
l)
lo
g (
CF
U/m
l)
T i m e (h)
0
500
1000
1500
2000
2500
0
5
10
15
20
25
0
10
20
30
40
50
R E (1
/m
l)
SE
A (
ng
/m
l)
T i m e (h)
C.
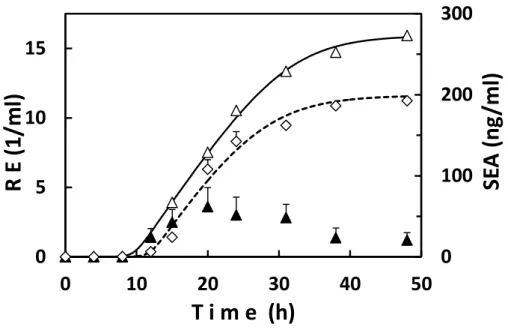
Fig. 2-2. Kinetics of SEA production, expression of SEA gene, and growth of strain 11658 in shaking and stationary cultures.
A. SEA production and growth in shaking and stationary cultures, B. Production and gene expression of SEA in shaking culture. C. Production and gene expression of SEA in stationary culture.Staphylococcal growth during the incubation at 30°C was measured in shaking (●) and stationary (○) cultures. SEA production during the incubation was also measured in shaking (◆) and stationary (◇) cultures. SEA gene expression (▲) was measured in a culture and then summed over time (△). RE shows the relative expression of sea. The data points and the SEA production curve shown in Fig. 2-2A are depicted again in Fig. 2-2B, C for reference. Bars show the standard errors at data points. Curves are described with an extended logistic model. A.
0
100
200
300
0
5
10
15
0
10
20
30
40
50
R E (
1/m
l)
SE
A (
ng
/m
l)
T i m e (h)
B.
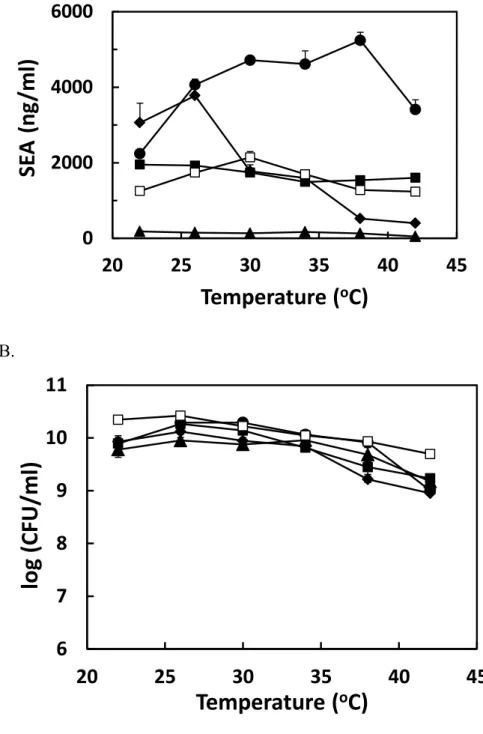
Fig. 2-3. Maximum SEA production and cell population of SEA producers at various temperatures in shaking culture.
A. SEA production, B. cell population. Staphylococcal strains of 13008 (●), St.1 (◆), f4 (■), and 11727 (▲) were grown at various temperatures between 14°C and 42°C. Data points of strain 11658 (□), which are shown in Fig. 2-1, are depicted again for reference. Bars show the standard errors at data points.
0
2000
4000
6000
20
25
30
35
40
45
SE
A
(n
g/m
l)
Temperature (
oC)
6
7
8
9
10
11
20
25
30
35
40
45
lo
g (
CF
U/m
l)
Temperature (
oC)
Table 2-1. Incubation periods needed for maximum SEA production of strain 11658 at various temperatures. Temperature (°C) 14 18 22 26 30 34 38 42 Shaking culture 18 6 6 4 2 2.6 2.6 2.6 Stationary culture 22 15 8 6 2.6 3 3 3 Unit: days.
Table 2-2. Differences in SEA production and growth of strain 11658 between shaking and stationary cultures.
Temperature (oC) 14 18 22 26 30 34 38 42 SEA production 6.35 21.4 22.6 9.06 9.36 6.72 4.25 3.48 Growth 7.12 9.20 11.1 13.0 11.1 8.53 8.86 10.3 (in log) (0.85) (0.96) (1.05) (1.11) (1.05) (0.93) (0.95) (1.01)
Table 2-3. SEA productivity of strain 11658 in shaking and stationary cultures. Temperature (oC) 14 18 22 26 30 34 38 42 Shaking (fg/CFU) 0.041 0.078 0.057 0.066 0.13 0.15 0.15 0.25 Stationary (fg/CFU) 0.046 0.034 0.028 0.095 0.15 0.19 0.31 0.74 Ratio 0.89 2.3 2.0 0.70 0.84 0.79 0.48 0.34
The ratio is obtained by dividing toxin productivity in shaking culture by that in stationary culture.
Chapter III
Boundaries of SEA Production and Growth of S. aureus at Various
Temperatures and Salt Concentrations
III-1 Background
Staphylococcal food poisoning (SFP) is one of the most prevalent food-borne diseases over the world (Pereira et al., 2009; Schelin et al., 2011; CDC, 2016). SFP happens by ingestion of contaminated food with sufficient amount of one or more preformed staphylococcal enterotoxins (SEs) (Argudin et al., 2010, Roussel et al., 2015).
Staphylococcus aureus produces a wide range of enterotoxins. Until now, more than 20 SEs are recognized, and types A to E are subdivided as the classical type (Schelin et al., 2011; Hu and Nakane, 2014). Among classical types, the staphylococcal enterotoxin type A (SEA) is the most dominant type for SFP outbreaks worldwide (Huang et al., 1987). It is well known that temperature is one of the most influential environmental factors for SE production, also, pH, water activity (Aw) and atmospheric conditions (Bergdoll et al., 1979)
S. aureus is a salt-tolerant bacterium (Jay et al., 2005). Therefore S. aureus can
dominantly grow and produce SEs in salted foods containing natural microflora. Thus there was a need to find the toxin production of S. aureus at a different salt concentration in a given food to prevent the occurrence of SFP.
SE production varies by S. aureus strains and the toxin type (Czop and Bergdoll, 1974; Otero et al., 1990). In our previous study, the kinetics of SEA production and growth of S.
aureus were studied in commercial milk and raw milk. This was because a huge
staphylococcal outbreak was occurred due to contaminated commercial milk in Osaka, Japan (Asao et al., 2003; Fujikawa and Morozumi, 2006; Sabike et al., 2014).
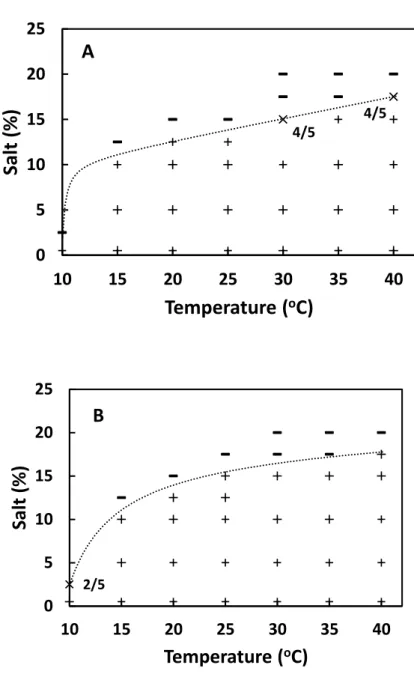
For instance, many researchers have studied probabilistic features of growth/no growth of target microbes under various environmental conditions so far. For S. aureus, several researchers have published papers on modelling the growth/no growth boundaries with a logistic regression model (Lanciotti et al., 2001; Stewart et al., 2002; Vermeulen et al., 2007; Valero et al., 2009). Especially Valero et al. (2009) intensively studied the growth/no growth boundaries of S. aureus under various conditions of temperature, pH, and water activity with the logistic regression model. However, there was no published a paper on the boundary of SE production under various environmental conditions.
Recently Ding et al. (2016) first modelled the boundary of SEA production/no production of S. aureus under various conditions of water activity, pH, and temperature with a logistic
al. (2013) also showed the boundary for Bacillus cereus enterotoxin production as a function of pH and temperature with a logistic regression model.
On the other hand, S. aureus is a facultative anaerobe. S. aureus cells in shaking culture would grow mostly by respiration with oxygen, whereas cells in stationary culture would grow mainly by fermentation without oxygen. Thus, the boundaries of SEA production/no production and growth/no growth of cells in shaking culture might be different from those in stationary culture.
Beneath these circumstances, a comprehensive study on the boundaries of both SEA production and staphylococcal growth under various environmental conditions with a logistic regression model would be very informative for food safety. In the present study, consequently, the comprehensive study was performed on the environmental factors of temperature and salt concentration in shaking and stationary cultures. Subsequently, the boundaries of SEA production and growth of S. aureus in shaking and stationary cultures could be presented with the logistic regression model. Further, the maximum concentrations of SEA and the cell population under various conditions of temperature and salt concentration in the two cultures were also studied.
III-2 Materials and Methods III-2-1 S. aureus cells.
A cocktail of five S. aureus strains was used in this study (Stewart et al., 2002; Valero et al., 2009). S. aureus 11658 (Aoyama et al., 2008) and 11727 were kindly provided by Prof. M. Sugai and Dr. Y. Sato of Hiroshima University, Japan. S. aureus 13008 was also kindly provided by Dr. A. Hirai of Tokyo Metropolitan Institute of Public Health, Japan. S. aureus f4 and St.1 were isolated from humans in our laboratory. These strains were all SEA producers and did not produce any other classical staphylococcal enterotoxin types B to E, as determined using a reversed passive latex agglutination test (Denka Seiken, Tokyo, Japan) (Fujikawa and Igarashi, 1988).
Staphylococcal strains were activated on Baird–Parker agar plates (Oxoid, Hants, UK) at 37°C for 2 days. Cells of some well-grown colonies were then inoculated into brain heart infusion (BHI) broth (Becton, Dickinson and Company, Sparks, USA) and then cultured with shaking at 110 strokes/min and 37°C for 24 h. Cells were washed once with saline (0.85% NaCl solution) by centrifugation at 15,000 × g for 15 min. Cells were thoroughly suspended
in saline and then diluted to 105 CFU/mlwith saline. A cocktail was then made with equal volumes of the five cell suspensions.
III-2-2 Sample preparation.
BHI broths were prepared at various salt concentrations ranging from 0.5 to 20% (w/v). The original BHI contained 0.5% (w/v) salt (Becton and Dickinson). The cocktail suspension prepared above was inoculated into the BHI broths with different salt concentrations at a ratio of 1:100 (v/v) to give a final concentration of 103 CFU/ml. The cell suspensions were dispensed into test tubes in 8 ml aliquots.
Samples at each salt concentration were incubated with shaking at 110 strokes/min or without shaking at a given temperature ranging from 10 to 40°C. The incubation periods of shaking and stationary cultures at various temperatures were shown in Table 3-1. The periods to reach the maximum SEA concentrations at those temperatures had been determined in our preliminary study.
Five samples were prepared for each condition of temperature and salt concentration. Under the conditions suitable for SEA production and staphylococcal growth, three samples were prepared for each condition.
III-2-3 SEA measurement.
SEA concentrations in cultured BHI samples were measured using a sensitive enzyme-linked fluorescence assay, VIDAS Staph enterotoxin II (bioMerieux, Marcy-l’Etoile, France) using a mini-VIDAS automated system. Namely, the culture samples were centrifuged at 15,000 × g for 15 min and the supernatants of the samples were examined for the optical test values with the VIDAS system. The SEA concentrations of the samples were estimated from the test values with a standard curve obtained with purified SEA (Fujikawa and Morozumi, 2006; Sabike et al., 2014). Purified SEA was kindly provided by Denka Seiken. The range of the SEA concentration assayed with the standard curve was 0.03-1.0 ng/ml. Sample supernatants were diluted when necessary (VIDAS technical pamphlet). Samples with ≥0.1 ng/ml SEA were taken as SEA-positive. The measured concentrations of samples were also used for the maximum toxin production analysis.
III-2-4 Cell counts.
Viable staphylococcal cell counts of cultured samples were measured using a plating method. Namely, samples were serially diluted 10-fold with saline, and then 0.1 ml portions of dilution were plated on nutrient agar plates (two plates per dilution) (Nissui Pharmaceuticals, Tokyo, Japan). After incubation at 37°C for 2 days, the colonies grown on the agar plates were counted, and the mean was calculated as the cell concentration of a sample. Samples whose cell concentrations were higher than the initial concentration were taken as growth-positive. The measured concentrations of samples were also used for the maximum cell concentration analysis.
III-2-5 Model fitting.
The probabilities of SEA production and growth under various environmental conditions were fitted to a logistic regression model. Namely, the probability of SEA production or staphylococcal growth, p was expressed with a logit equation (Equation 1).
)
1
ln(
)
(
log
p
p
p
it
−
=
(1)The logit equation used in the present study was a second-order linear logistic regression model, as shown in Equation 2 (Valero et al, 2009; Ding et al., 2016).
5 4 3 2 2 1
)
(
log
it
p
=
a
T
+
a
ST
+
a
S
+
a
T
+
a
(2)Here T is temperature (oC) and S the salt concentration (%). And a1, a2, a3, a4, and a5 are the coefficients. Model fitting was performed with statistical software, R (ver. 3.4.3). The coefficients of equation (2) were evaluated with R. With the evaluated coefficients and a given value of p such as 0.1, a boundary was generated by using Microsoft Excel.
III-2-6 Validation of model performance.
With the internal data, Akaike's Information Criterion, AIC, of the logistic regression model was estimated for of-fit by R. With a smaller AIC value, the better goodness-of-fit of a model is confirmed. The model performance was also validated with external, independent data under selected experimental conditions of temperature and salt