Second - order neural networkと自己組織化マップを使った ジェスチャー認識のための動作特徴抽出
4
0
0
全文
(2) 3.. Motion Feature Extraction. 3.1.. 3.2.. Moving Hand Extraction. The RGB colors in the video images are translated into L*a*b* color space in order to extract a moving hand-region. We modified second-order neural network (SONN) for moving hand region extraction. The binary output Oij(t) is calculated as follows, 1 if U ij (t ) ≥ Θ ij (t ) Oij (t ) = otherwise 0. v(t ) = G (t ) − G (t − ∆t ). Then we define velocity array vector V(t) as an array of v(t).. V (t ) = [v (t ), v (t − 1), L , v (t − nV − 1)] The output signal yfij of the ith jth output. neuron is calculated as follows, 1 if i = i win ∩ j = j win yijf = otherwise 0. Θ ij (t ) = θ o 1 + ξ ∑ U ij (t ) (l h × l w ) i, j . m iwin jwin − V = min m ij − V i, j. U ij (t ) = Fij (t )(1 + β Lij (t )). where iwin and jwin are the indices of the winner neuron, mij is the codebook vector. We define motion feature as following.. Fij (t ) = exp (− τ F )Fij (t − 1) + γ F ∑ WijklF O kl (t − 1) + ∑ WijklR R kl (t ) k,l. x(t ) = [i win , j win ]. k ,l. The codebook vectors mij are adjusted by SOM learning rule.. L Lij (t ) = exp(− τ L )Lij (t − 1) + γ L ∑Wijkl (Okl (t − 1) − 1) k ,l. m i j (s f + 1) = m ij (s f. Rij (t ) = γ R (S ij (t ) + exp (− τ R )Rij (t − 1)). S ij (t ) =. L* ij. D. b* ij. 3. (. I a * (t ) − m ij a* Dija * (t ) = exp 2 − σ a2* . (. I b * (t ) − m ij b* Dijb * (t ) = exp 2 − σ b2* . ). ). 2. {V − m (s ij f p . )}. m [iw , jw ] (s f ) − V p = min m [i , j ] (s f ) − V p. DijL* (t ) = C L* I ijL* (t ) − I ijL* (t − 1) 2. ). [i, j ] − [i w , j w ] 2 + η (s f )exp − σ n2 (s f ) . (t ) + D (t ) + D (t ) a* ij. Motion Feature Map. The velocity of the gravitation center G is defined as. i, j. I a * (t ) − I a * (t − 1) ij ij . 4.. I b * (t ) − I b * (t − 1) ij ij . where Uij is the internal activity and Sij is the input stimuli. IL*ij, Ia*ij and Ib*ij are the input value at pixel (i, j) for L*, a* and b* respectively. WFijkl, WLijkl, WRijkl are Gaussian kernels. Θ ij is the dynamic threshold. An example of hand gesture is shown in Figure 1.. Recognition. In the recognition part, dynamic programming (DP) matching is implemented. The motion pattern X is defined as a sequence of the input motion feature x(t),. X = {x(1), x(2),L, x(t ), L x(t max )}. The template Rq of the category q is also defined as a sequence of the motion feature rq(u). R q = {rq (1), rq (2 )L , rq (u ), L rq (u max )} An accumulated cost Cq(X, t, u) and a length of the path Lq(X, t, u) is calculated by the DP matching rule. Normalized accumulation cost yDPq(X) is acquired by following.. Figure 1. Moving hand extraction. y qDP (X ) =. −6− - 2 -. C q (X, t max , u max ) Lq (X, t max , u max ).
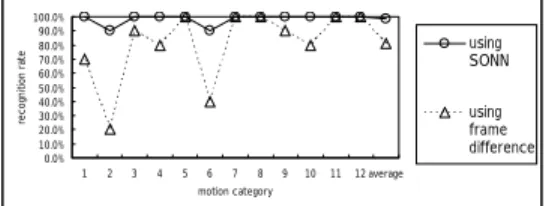
(3) Recognition result is obtained by finding the category with minimum yDPq(X). The template is figured out as averaged vectors of time normalized input patterns.. The six examinees performed all gestures 10 times. The results are shown in Figure 4.. 5.. recognition rate. 100.0%. Experiments. 5.1.. Training Conditions. 60.0% 40.0% 20.0% 0.0% 1. 2. 3. 4. 5. 6. 7. 8. 9. 10. 11. 12 total. scene scene scene scene scene scene scene scene scene. Figure 4. 5.2.2.. Recognition rates. Comparative Experiments. At first, we replace the SONN in our system with frame difference technique. This system also uses skin-color regions using L*a*b* color space. The recognition results for this modification are shown in Figure 5. 100.0% 90.0% 80.0% 70.0% 60.0% 50.0% 40.0% 30.0% 20.0% 10.0% 0.0% 1. 2. 3. 4. 5. 6. 7. 8. 9. 10. 11. 12. scene scene scene scene scene scene scene scene scene. total. motion category. Figure 3. 5.2.. Figure 5 Recognition rates of the system using frame difference technique In order to verify the noise reduction ability of the SONN, we prepared additional test data as scene N. The scene N contains an ornament waving by wind at the background. The recognition rates of the system using frame difference are compared with those of the system using SONN for the scene N in Figure 6.. Motion Feature Map. recognition rate. Figure 2. Example of feature trajectory. Experimental Results. 100.0% 90.0% 80.0% 70.0% 60.0% 50.0% 40.0% 30.0% 20.0% 10.0% 0.0%. using SONN using frame difference 1. 2. 3. 4. 5. 6. 7. 8. 9. 10. 11. 12 average. motion category. 5.2.1.. Recognition Rates. At first, we have tested other 360 untrained data to recognize the gestures in “known” situations. They performed all gesture patterns 10 times. Then we have tested other 600 untrained data to recognize the gestures at “unknown” situations. We label them as scene 1 to 6.. A B C 1 2 3 4 5 6. motion category. recognition rate. The system is trained to recognize twelve hand-gesture patterns. Training data were obtained from three examinees at different backgrounds. We label them as scene A, B and C. Three examinees performed all gesture patterns 6 times. The obtained motion feature map calculated by SOM is shown in Figure 2, and an example of feature trajectory for a test movie is shown in Figure 3.. 80.0%. Figure 6. Comparison of the recognition rates for scene N The second comparative system does not employ the motion feature map. The recognition results are shown in Figure 7.. −7− - 3 -. A B C 1 2 3 4 5 6.
(4) recognition rate. 100.0% 90.0% 80.0% 70.0% 60.0% 50.0% 40.0% 30.0% 20.0% 10.0% 0.0% 1. 2. 3. 4. 5. 6. 7. 8. 9. 10. 11. 12. total. scene scene scene scene scene scene scene scene scene. A B C 1 2 3 4 5 6. motion category. recognition rate. Figure 7 Recognition rates of the system without motion feature map In addition, we translated the video images of the scene 3 into various sized images. Comparisons of the recognition rates for the image distortions are shown in Figure 8 and Figure 9.. 7.. 100.0% 90.0% 80.0% 70.0% 60.0% 50.0% 40.0% 30.0% 20.0% 10.0% 0.0% 1. 2. 3. 4. recognition rate. Figure 8. 5. 6 7 8 9 motion category. 10 11 12 total. 2. 3. Figure 9. scene 3 (with SOM) h-75% (with SOM) h-50% (with SOM) v-75% (with SOM) v-50% (with SOM) scene 3 (without SOM) h-75% (without SOM) h-50% (without SOM) v-75% (without SOM) v-50% (without SOM). Comparison for diminution. 100.0% 90.0% 80.0% 70.0% 60.0% 50.0% 40.0% 30.0% 20.0% 10.0% 0.0% 1. 6.. indicates the robustness of the motion feature map to scaling up distortions. This is caused by the fact that the SOM optimizes upper and lower thresholds for input vectors are defined automatically. Topological distances between the competitive neurons in the map approximate statistical distances in the feature space since the SOM quantizes and approximates data distribution with keeping their topology. This trait is suited to data normalization for the DP matching.. 4. 5. 6 7 8 9 motion category. 10 11 12 total. scene 3 (with SOM) v-200% (with SOM) v-300% (with SOM) h-200% (with SOM) h-300% (with SOM) scene 3 (without SOM) v-200% (without SOM) v-300% (without SOM) h-200% (without SOM) h-300% (without SOM). Conclusion. We propose a neural preprocess approach for video-based gesture recognition. Our experimental results show that the system has a good performance to classify twelve hand gesture patterns. For situations with noisy backgrounds, the SONN acts on more appropriately than frame difference technique. The SOM provides the robustness to spatial scaling distortion of input video images, and topological property of SOM is quite suitable to normalizing feature vectors for DP matching technique.. References. Comparison for expansion. Discussion. The recognition results of our system are shown in Figure 4. The results show that the system has a high performance for recognizing gestures by various persons at various backgrounds. As illustrated in Figure 1, SONN well extracts moving hand regions. Figure 6 shows the recognition rates of the both systems for noisy background. The SONN acts on scenes at noisy backgrounds more appropriately than the frame difference technique. The results of the comparative experiments in Figure 8 and Figure 9 show the robustness. The results in Figure 8 show that the motion feature map alleviates the effects of scaling down distortions. Figure 9 significantly. 1 Kubota, T. : Massively parallel networks for edge localization and contour integration – adaptable relaxation approach, Neural Networks, Vol.17, pp.411-425, (2004). 2 Katayama, K., Ando, M. and Horiguchi, T. : Models of MT and MST areas using wake-sleep algorithm, Neural Networks, Vol.17, pp.339-351, (2004). 3 Yoshiike, N. and Takefuji, Y. : Object segmentation using maximum neural networks for the gesture recognition system, Neurocomputing 51 (2003) 213-224 4 Chashikawa, T. and Takefuji, Y. : Extracting Moving Object Areas Based on Second-order Neural Network, IPSJ Vol.44, No.SIG 14(TOM 9), pp. 31-47, 2003. 5 Kohonen, T. : Self-Organizing Maps, Springer-Verlag, Berlin (1995).. −8− - 4 - E.
(5)
図


関連したドキュメント
In the on-line training, a small number of the train- ing data are given in successively, and the network adjusts the connection weights to minimize the output error for the
The connection weights of the trained multilayer neural network are investigated in order to analyze feature extracted by the neural network in the learning process. Magnitude of
In this artificial neural network, meteorological data around the generation point of long swell is adopted as input data, and wave data of prediction point is used as output data.
pair of ables whih provide power supply and om-.
Wormsinthehabituatedstatesevokedbyonesitetoucharestill
The aim of this paper is to present modified neural network algorithms to predict whether it is best to buy, hold, or sell shares trading signals of stock market indices.. Most
In the present paper, the methods of independent component analysis ICA and principal component analysis PCA are integrated into BP neural network for forecasting financial time
Rybko, A.N., Stationary distributions of time homogeneous Markov processes modeling message switching communication networks, Problems of Information Transmission 17.
