高分解能原始星観測
の現状と将来展望
元木業人
国立天文台 水沢VLBI観測所
2016年度第46回
天文・天体物理若手
夏の学校
もくじ
1. イントロ: 宇宙の物質進化と星形成
1. 原始星観測の現状 (手法、現状、問題点)
1. 今後の展望〜2030年代へ向けて
自己紹介
• 元木 業人(モトギ カズヒト)
• 生年月日…1983年5月25日(満33才)
• 出身地…栃木県小山市
• 趣味…自転車旅行、演劇(脚本演出、役者)、カラオケ
• 専門…大質量星形成、電波干渉計、VLBI
• 学歴・研究歴
2002年 3月〜
栃木県立栃木高等学校 卒業
2003年 4月〜
北海道大学 理学部 物理学科 入学
2006年 4月〜
北海道大学 理学部 宇宙物理学研究室に配属
2010年 4月〜
学振DC研究員@北海道大学
2011年12月
博士(理学)取得
2012年 1月〜3月
学振PD研究員@北海道大学
2012年 4月〜
学振PD研究員@山口大学
2015年 4月〜
国立天文台 水沢VLBI観測所研究員
1.Introduction
• 宇宙の形 → 時空構造の起源・進化(宇宙論)
• 宇宙の中身→ 物質の起源・進化(天文学)
いずれも現代物理学の究極のテーマ
宇宙の物質進化
• 宇宙の晴れ上がり時…H, He, Liのみが存在
• 現在の宇宙
…113種を超える元素、多様な無機・有機分子、
惑星、生物、人間
• 星による元素合成
恒星核融合 + 超新星爆発 (+中性子星合体?)
→産まれてくる星の”質量と数”が
定量的な進化を決定
星形成
“星形成”とはどんな学問か?
• 「どんな条件で どの重さの星が いくつ産まれるか?」
(= Mass Function) を研究する
• 実際にはいくつかのレベルにテーマが別れる
1: 初期条件 (分子雲形成、衝突合体)
2: 分裂降着過程 (星団形成クランプ/コア形成)
3: 原始星進化とフィードバック (星形成効率の決定)
→高分解能観測の寄与は主に③
ALMAで捉えられた原始惑星円盤
TW Hydra
HL tau
Andre et al. (2016)
ALMA Partnership et al. (2015)
構造スケール vs 分解能@1 kpc
(2015年現在)
10
510
410
310
210
10
0サイズ(AU)
星周円盤
星団形成クランプ
星周エンベロープ
(not 回転平衡)
周星団エンベ
ロープ/コア
HII 領域
SMA/PdBI/ATCA
J-VLA (Q)
ALMA (ES)
Subaru (NIR)
VLBI
(メーザー)
VLTI (NIR)
単一鏡
YSO
(< 0.3 AU)
原始星観測手法
1. 直接分解撮像
→現状では分解能不足で不可
2. Spectral Energy Distribution
→中心星のエネルギー収支/進化段階を反映
3. 星周構造観測
→降着円盤、ジェット/アウトフロー
4. 時間変動
SEDによる原始星研究
Input:
赤外線のエネルギー分布
Model:
原始星
星周構造
(円盤、アウトフロー、etc)
Output:
星パラメータ
星周構造パラメータ
SEDにみる原始星進化(低質量)
◯進化段階とSED形状の対応
0: 星無しコア
0: 重力収縮による原始星の誕生
(< 10
4yr)
1-2: 降着による質量獲得
(10
5– 10
6yr)
2-3: 重力収縮による温度上昇
(林/Henyey トラック〜10
7yr)
→ZAMS到達
◯Spitzer打ち上げ時SEDモデルブーム
(e.g., Whitney et al. 2003; 2004)
→劇的に物事は変わってない...
大質量星形成におけるSED
◯降着と収縮が平行
→ほとんどClass Iに対応
→Class II – III相当は存在せず
◯短波長で暗い天体ほど若い点は同じ
1. IRAS 時代
12, 25, 60, 100 μmのカラー
→High mass protostellar object の発見
(e.g., Sridharan et al. 1997)
2. MSX – Spitzer 時代 (1998 〜 )
8 μm dark / 24 μm bright
→赤外線暗黒星雲中のHMPO
(e.g., Motte et al. 2007)
3. Spitzer – Herschel時代 (2011 〜)
24 μm dark / 70 μm bright
→Class 0天体に対応
→Pre-high mass object ?
(e.g., Henning et al. 2011)
HMYSOのSED例 (Grave & Kumar 2009)
SED 研究の利点/欠点
利点
1. 空間分解不要
2. 統計的研究が容易 (豊富なアーカイブデータ)
欠点
1. パラメータが多過ぎる
(星質量、円盤半径、厚み、見込み角、エンベロープ質量/形状、etc)
→データ点が自由度を満たせない
2. モデルの妥当性に依存
→原始星進化モデルの不定性
→星周構造の個性
3. アーカイブデータが時間変動に対応できない
→実際の原始星は時に赤外線領域で活動的
• 降着円盤
質量降着率
角運動量輸送
円盤分裂による
連星形成
• ジェット/アウトフロー
質量放出率
星形成効率
角運動量輸送
磁束の引き抜き
星周構造観測
降着期の円盤観測
• 若い天体ほどサイズが小さく観測が困難
→Class0 と T-tauriでは1桁の差
• 電波干渉計による”回転体”探しの歴史
(SMA/CARMA 2000年代)
• ALMAによる詳細な力学構造観測の時代へ
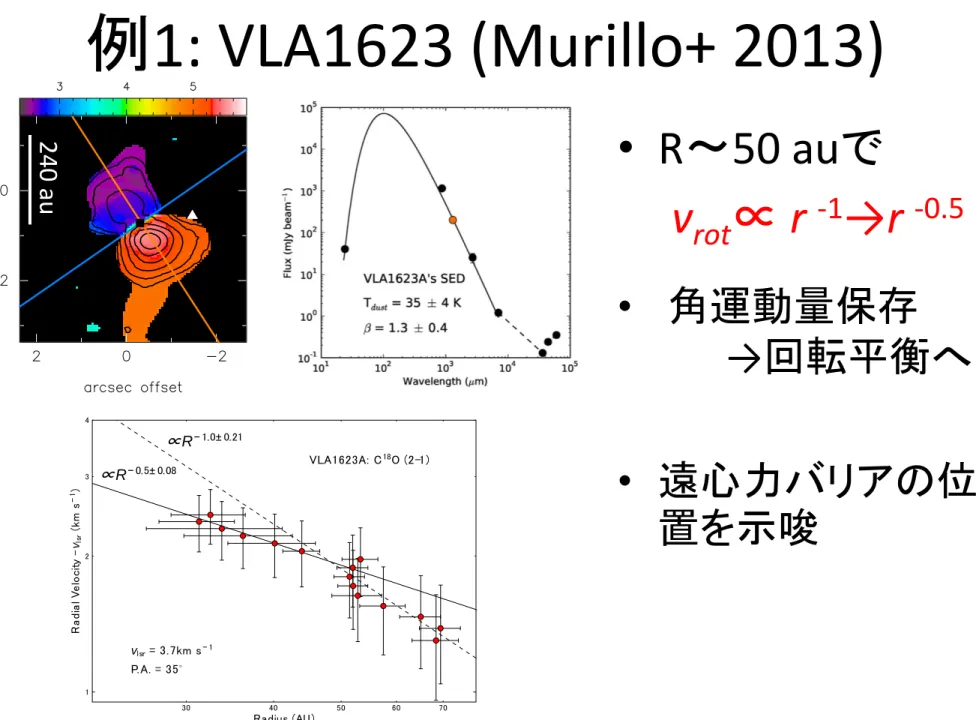
例1: VLA1623 (Murillo+ 2013)
• R〜50 auで
v
rot
∝ r
-1
→r
-0.5
• 角運動量保存
→回転平衡へ
• 遠心力バリアの位
置を示唆
N. M. Murillo et al.: A Keplerian disk around a Class 0 source: ALMA observations of VLA1623A
30 40 50 60 70 Radius (AU) 1 2 3 4 R a d ia l V e lo c ity -vls r (k m s − 1) VLA1623A: C18O (2-1) P.A. = 35◦ vlsr= 3.7km s− 1 ∝R− 0.5± 0.08 ∝R− 1.0± 0.21
Fig. 4.UV-space PV diagram of C18O. v
lsr= 3.7 km s−1. The red points
indicate the redshifted (v > 5.0 km s−1) emission. The velocity range covered in this diagram is indicated in Fig.3. Blueshifted emission (v < 2.8 km s−1) is not included in the diagram since it is strongly affected by foreground emission (see Fig.3and Sect.3.2). The points are fit with a power law of the form v = aRn. The solid line shows the fit to the high-velocity points (v > 5.7 km s−1), while the dashed line shows the fit to the low-velocity points (v < 5.7 km s−1). This suggests that the pure Keplerian disk extends to a radius of 50 AU.
the structure. The entire range of possible vlsr(3.4 to 4.0 km s−1)
was fit. The results of the fit for any vlsr are within the error
of the fit presented here, which uses the mean vlsr, 3.7 km s−1. Thus we find that the high-velocity points (v > 5.7 km s−1) are well fit by v ∝R−0.5 ±0.08, giving a central protostellar mass M∗
of 0.22 ±0.02 M⊙. On the other hand, the low-velocity points
(5 km s−1< v < 5.7 km s−1) are well fit by v ∝R−1. This suggests that there is a turnover point at 50 AU, where the inner parts, i.e.
R ≤ 50 AU, are under the effect of pure Keplerian rotation and
the outer parts are undergoing infall. In the following section, we argue that the lower velocity points are affected by optical depth and absorption, and that R can be larger.
4.2.ModelingofC18O(2–1)
Based on the results from the PV diagrams, which suggest there is a rotationally supported component in the observed
C18O emission, we proceed to further investigate the structure
and its kinematics using an analytical thin disk model with the addition of absorbing foreground material. The model does not include radiative transfer or excitation since the goal is to study the kinematics and structure of the observed disk. The input
pa-rameters include the outer radius Rout of the disk, source
posi-tion, PA, inclination i of the disk, the mass of the central source
M∗, and the temperature and column density gradients of the disk surface. Generated maps are convolved to the observed clean beam. The model output is in the form of position-position-velocity (xyv) data cubes in FITS format.
For all of the models we fix the central protostellar mass
M∗= 0.2 M⊙, which was obtained from the PV diagram analysis
(see Sect.4.1), and the position angle to 35◦, since these
parame-ters are well constrained from the PV diagrams (see Sect.4.1and
Figs.2and4). We set vlsr = 4.0 km s−1, which is the symmetry axis of the spectrum. The distance is set to 120 pc, and the source position is set slightly offset by 0.02′′×0.04′′to the SW from
VLA1623A’s position to match the center of the C18O emission,
i.e. the rotation axis.
Other free parameters in the model are line width vwidth, in-clination i, and outer radius Rout. These values are constrained to best fit the observations. The attempted value ranges for each parameter are 0.1 km s−1 ≤ vwidth ≤ 1.0 km s−1; 0◦ (face-on) ≤
i ≤ 90◦ (edge-on); 100 AU ≤ R
out ≤ 200 AU. The best fit for
al-most all models was obtained with vwidth = 0.2 km s−1, i = 55◦,
and Rout = 180 AU, except for the free-falling disk model, where
Rout= 130 AU. Since we do not have a way to constrain the
tem-perature and column density gradients, we assume the observed emission is optically thin, and set the density as a constant and adjust the temperature gradient to match the observed spectral profile.
As discussed in Sect.3.2, we suspect the presence of absorb-ing material along the line of sight of VLA1623, which would affect the observed emission and spectral profile, and thus influ-ence the model fitting. From the data presented here we can not be completely certain of the characteristics of the absorbing ma-terial. Thus, we adjust the model velocities, peak opacity, and widths of the foreground clouds aiming to best fit the observed spectral profile. We assume that the foreground clouds only ab-sorb with opacity following a Gaussian-like profile of the form
τ(v) ∝exp −0.5 v − v0
σ 2
· (1)
By adjusting the absorbing material parameters to fit the ob-served spectral profile, we find that the best results are obtained by introducing three absorbing layers, one corresponding to the
envelope at 4.0 km s−1, and two corresponding to possible
fore-ground clouds at 1.6 and 3.0 km s−1. The characteristics of the
absorbing material for each model are listed in Table3.
To study the kinematical structure of the disk, we mod-eled five cases: (1) free-falling disk; (2) free-falling outer disk plus inner Keplerian disk; (3) conservation of angular
momen-tum (AM); (4) infalling (v ∝ R−1) outer envelope plus inner
Keplerian disk; and (5) pure Keplerian disk. For Cases 2, 3, and 4, we define a critical radius Rcritparameter (1 AU ≤ Rcrit<
Rout) that defines the radius at which the transition from one ve-locity structure to the other occurs. Figure 5illustrates the ve-locity structure distribution of each of the modeled cases. In
Sect.4.3we briefly describe each model and the results obtained.
Figure 6 presents the best fitting results for the five cases
modeled. We overlay the observed and modeled spatial distri-bution, spectral profile, and image-space PV diagram. Model spectral profiles are shown both with and without foreground absorption. The image-space PV diagram for each model was constructed along the disk’s major axis. The best fit parameters
obtained for each of the models are shown in Fig.6and listed in
Table2. To determine the best fit model of all five cases
exam-ined, we first compared each model and observations by eye and then through the residuals obtained by subtracting the channel maps of the observations and model. We deemed the model with the least residual the best fit (discarding the filaments to the north
and south). AppendixBshows the channel map for each model,
compared with observations and the corresponding residual.
4.3.Modelresults
Free falling disk: in the very early stages of star formation, the
envelope of a protostar is thought to be under free fall collapse. Thus, if there was any disk-like structure around the protostar at this stage, its motion would be that of free fall as well, i.e. a free-falling disk (Fig.5). In our model, we study a free-falling disk
A103, page 5 of16
例2: L1527 IRS
• 遠心力バリア領域
にSOのリング
→ダストからの叩き出
し?
(Sakai +2014)
• R〜50 – 100 auで
v
rot∝ r
-1→r
-0.5(Ohashi +2014)
(Sakai + 2014)
カラー: c-C3H2
コンター: SO
(Ohashi + 2014)
例3: L1489IRS (Yen + 2014)
• ケプラー円盤
(R〜700 AU)
+ infall streams
• 接続半径(300 AU)
にSOリング
700 AU
例4:L1551NE (Takakuwa+ 2013)
• 周連星円盤
+ 渦状腕
(R〜300 au)
• ケプラー回転
+ 重力トル
ク
物理量の特徴もろもろ
• 比角運動量
〜 10
20
– 10
21
cm
2
s
-1
→Class 0における遠心力半径は大凡50 – 100 au
• 質量比 : M
*
>> M
disk
→M
*
< M
disk
の最初期天体は未発見
• 温度勾配 (T ∝ r
α
)
HL-tau
(Class II)
-0.65
L1489
(Class I)
-0.3
L1551NE (Class I)
-0.2
低質量星との違いは何か?
• 極めてDynamicalなコア/クランプ形成
(e.g.,分子雲衝突、乱流衝突)
→大降着流の実現(輻射圧問題の回避)
• クランプからの質量供給
円盤 + エンベロープ + 周星団クランプ
低質量星と同様の
Core collapse
大質量星(星団形成)
大質量星周囲の階層的降着構造
A& A 555, A112 (2013) a 1 pc F1 F2 F3 F4 F5 F6 1 pc b 1 pc MM2 MM1 c 0.2 pc MM2Fig. 1. a) M id-infrared Spitzer composite image (red: 8 µm; green: 4.5 µm; blue: 3.6 µm) of SDC335. The 6 fi laments identifi ed by eye are indicated with yellow dashed lines, emphasizing their converging pattern. The di↵use 4.5 µm emission associated with the two IR sources in the centre is usually interpreted as a signature of powerful outflow activity. The positions of the two cores are marked with black crosses. b) Herschel column density image of SDC335. The locations of the fi laments and cores are marked similarly as in the a) panel. The fi nal angular resolution of this image is 2500(yellow circle), that of Herschel at 350 µm (see text). The contours range from 3.5 ⇥ 1022 to 9.5 ⇥ 1022 cm−2in steps of
2 ⇥ 1022 cm−2, and from 2.15 ⇥ 1023 to 4.15 ⇥ 1023cm−2in steps of 1 ⇥ 1023 cm−2. The two yellow contours defi ne the regions in which we
calculated the SDC335 and Centre region masses quoted in Table1. c) ALM A 3.2 mm dust continuum emission of the central region of SDC335 where two cores are identifi ed, M M 1 and M M 2. The rms noise is 0.4 mJy/beam. The contours range from 2 to 22 in steps of 5 mJy/beam, and from 22 to 62 in steps of 10 mJy/beam. The yellow ellipse represents the ALM A beam size.
witnessing the early stages of the formation of, at least, two mas-sive stars.
The goal of this paper is to map the dense gas kinematics of SDC335 and analyse it in the context of massive star formation scenarios. In Sect. 2 we describe the observations. In Sect. 3 we discuss the mass partition in SDC335, and Sect. 4 presents observations of the SDC335 dense gas kinematics. Finally, we discus our results and their implications in Sect. 5, the summary and conclusions are presented in Sect. 6.
2. Observations
2.1. Spitzer and Herschel observations
W e used publicly available1Spitzer GLIM PSE data (Churchwell
et al. 2009). The angular resolution of the 8 µm data is ⇠200.
W e also used the PACS (Poglitsch et al. 2010) 160 µm and SPIRE (Griffin et al. 2010) 350 µm Herschel (Pilbratt et al. 2010) data from the Hi-GAL survey (M olinari et al. 2010). These data were reduced as described inTrafi cante et al. (2011), using the ROM AGAL map making algorithm. The nominal angular reso-lution at these two wavelengths are 1200and 2500.
2.2. Mopra observations
In M ay 2010 we observed SDC335 with the ATNF M opra 22 m single-dish telescope. W e observed transitions including HCO+(1−0), H13CO+(1−0) and N
2H+(1−0) in a 50⇥50fi eld
cen-tred on SDC335. W e performed on-the-fly observations, switch-ing to an o↵-position free of dense gas emission. Pointswitch-ing was checked every hour and was found to be better than 1000. W e used
the zoom mode of the M OPS spectrometer providing a velocity resolution of 0.1 km s−1. The angular resolution of these 3 mm
1 ht t p: //i r sa. i pac. cal t ech. edu/dat a/SPI TZER/GLI MPSE
M opra observation is ⇠3700and the rms noise is 0.1 K on the T⇤
A
scale (⇠0.2 K on the Tmbscale because the beam efficiency
fac-tor is ⇠2 at 93 GHz on M opra −Ladd et al. 2005).
2.3. ALMA observations
In September and November 2011 we observed SDC335 at 3 mm wavelength with the 16 antennas of ALM A (Cycle 0) in its compact confi guration. W e performed an 11-pointing mosaic covering the entire area seen in extinction with Spitzer (Fig.1a). W e simultaneously observed the 3.2 mm dust continuum, along with the CH3OH(13−12) and N2H+(1−0) transitions at a
spec-tral resolution of ⇠0.1 km s−1. Flux and phase calibration were
performed on Neptune and B1600-445, respectively. The data were reduced using CASA2(M cM ullin et al. 2007). The
synthe-sized beam is 5.600⇥ 4.000with a position angle of + 97◦. The rms
noise in the continuum is 0.4 mJy/beam, while for the line we reach an rms sensitivity of 14 mJy/beam (⇠0.08 K ).
As with any interferometer, ALM A fi lters out large-scale emission. To recover this emission, we used the M opra single-dish data to provide the short-spacing information, for which we used the GILDAS3software. This combination signifi cantly
improved the image quality, in particular in the central re-gion of SDC335. The rms noise on these combined datacubes is 0.14 Jy/beam (⇠0.8 K ), signifi cantly higher than the ALM A-only dataset. This reflects the higher noise of the M opra dataset per ALM A beam.
3. Mass partition in SDC335
The mid-infrared composite image of SDC335 is displayed in Fig. 1a. In extinction we easily identify a network of six
2 ht t p: //casa. nr ao. edu
3 ht t p: //www. i r am. f r /I RAMFR/GI LDAS
A112, page 2 of10 A& A 555, A112 (2013) a 1 pc F1 F2 F3 F4 F5 F6 1 pc b 1 pc MM2 MM1 c 0.2 pc MM2
Fig. 1. a) M id-infrared Spitzer composite image (red: 8 µm; green: 4.5 µm; blue: 3.6 µm) of SDC335. The 6 fi laments identifi ed by eye are indicated with yellow dashed lines, emphasizing their converging pattern. The di↵use 4.5 µm emission associated with the two IR sources in the centre is usually interpreted as a signature of powerful outflow activity. The positions of the two cores are marked with black crosses. b) Herschel column density image of SDC335. The locations of the fi laments and cores are marked similarly as in the a) panel. The fi nal angular resolution of this image is 2500(yellow circle), that of Herschel at 350 µm (see text). The contours range from 3.5 ⇥ 1022 to 9.5 ⇥ 1022 cm−2in steps of
2 ⇥ 1022 cm−2, and from 2.15 ⇥ 1023 to 4.15 ⇥ 1023 cm−2in steps of 1 ⇥ 1023 cm−2. The two yellow contours defi ne the regions in which we
calculated the SDC335 and Centre region masses quoted in Table1. c) ALM A 3.2 mm dust continuum emission of the central region of SDC335 where two cores are identifi ed, M M 1 and M M 2. The rms noise is 0.4 mJy/beam. The contours range from 2 to 22 in steps of 5 mJy/beam, and from 22 to 62 in steps of 10 mJy/beam. The yellow ellipse represents the ALM A beam size.
witnessing the early stages of the formation of, at least, two mas-sive stars.
The goal of this paper is to map the dense gas kinematics of SDC335 and analyse it in the context of massive star formation scenarios. In Sect. 2 we describe the observations. In Sect. 3 we discuss the mass partition in SDC335, and Sect. 4 presents observations of the SDC335 dense gas kinematics. Finally, we discus our results and their implications in Sect. 5, the summary and conclusions are presented in Sect. 6.
2. Observations
2.1. Spitzer and Herschel observations
W e used publicly available1Spitzer GLIM PSE data (Churchwell
et al. 2009). The angular resolution of the 8 µm data is ⇠200.
W e also used the PACS (Poglitsch et al. 2010) 160 µm and SPIRE (Griffin et al. 2010) 350 µm Herschel (Pilbratt et al. 2010) data from the Hi-GAL survey (M olinari et al. 2010). These data were reduced as described inTrafi cante et al.(2011), using the ROM AGAL map making algorithm. The nominal angular reso-lution at these two wavelengths are 1200and 2500.
2.2. Mopra observations
In M ay 2010 we observed SDC335 with the ATNF M opra 22 m single-dish telescope. W e observed transitions including HCO+(1−0), H13CO+(1−0) and N
2H+(1−0) in a 50⇥50fi eld
cen-tred on SDC335. W e performed on-the-fly observations, switch-ing to an o↵-position free of dense gas emission. Pointswitch-ing was checked every hour and was found to be better than 1000. W e used
the zoom mode of the M OPS spectrometer providing a velocity resolution of 0.1 km s−1. The angular resolution of these 3 mm
1 ht t p: //i r sa. i pac. cal t ech. edu/dat a/SPI TZER/GLI MPSE
M opra observation is ⇠3700and the rms noise is 0.1 K on the T⇤
A
scale (⇠0.2 K on the Tmbscale because the beam efficiency
fac-tor is ⇠2 at 93 GHz on M opra −Ladd et al. 2005).
2.3. ALMA observations
In September and November 2011 we observed SDC335 at 3 mm wavelength with the 16 antennas of ALM A (Cycle 0) in its compact confi guration. W e performed an 11-pointing mosaic covering the entire area seen in extinction with Spitzer (Fig.1a). W e simultaneously observed the 3.2 mm dust continuum, along with the CH3OH(13−12) and N2H+(1−0) transitions at a
spec-tral resolution of ⇠0.1 km s−1. Flux and phase calibration were
performed on Neptune and B1600-445, respectively. The data were reduced using CASA2(M cM ullin et al. 2007). The
synthe-sized beam is 5.600⇥ 4.000with a position angle of + 97◦. The rms
noise in the continuum is 0.4 mJy/beam, while for the line we reach an rms sensitivity of 14 mJy/beam (⇠0.08 K ).
As with any interferometer, ALM A fi lters out large-scale emission. To recover this emission, we used the M opra single-dish data to provide the short-spacing information, for which we used the GILDAS3software. This combination signifi cantly
improved the image quality, in particular in the central re-gion of SDC335. The rms noise on these combined datacubes is 0.14 Jy/beam (⇠0.8 K ), signifi cantly higher than the ALM A-only dataset. This reflects the higher noise of the M opra dataset per ALM A beam.
3. Mass partition in SDC335
The mid-infrared composite image of SDC335 is displayed in Fig. 1a. In extinction we easily identify a network of six
2 ht t p: //casa. nr ao. edu
3 ht t p: //www. i r am. f r /I RAMFR/GI LDAS
A112, page 2 of10
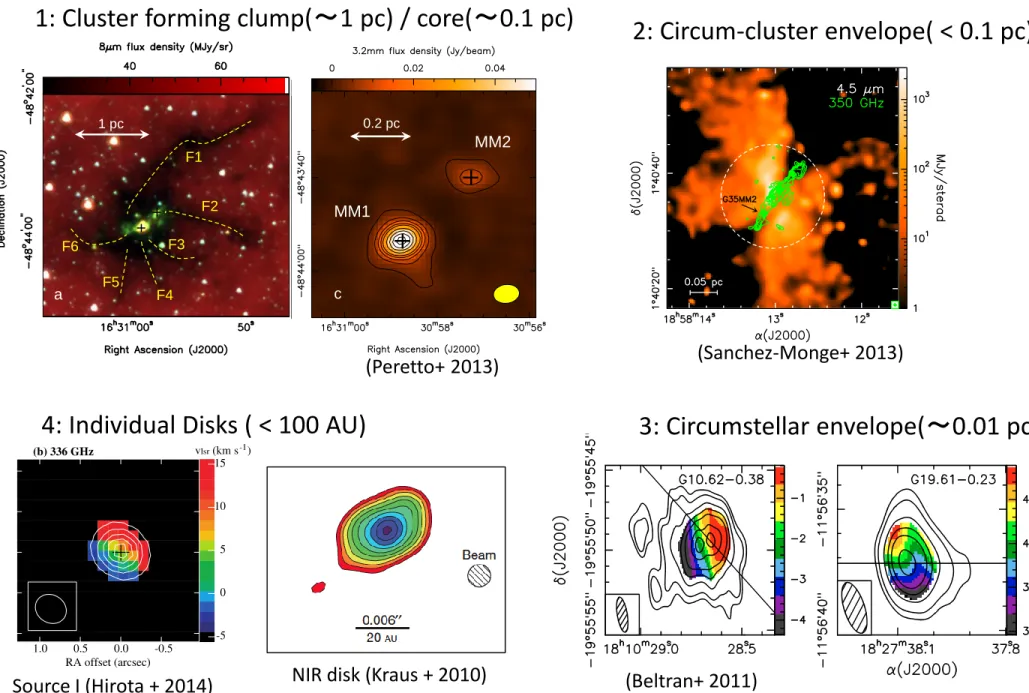
1: Cluster forming clump(〜1 pc) / core(〜0.1 pc)
(Peretto+ 2013)
2: Circum-cluster envelope( < 0.1 pc)
(Sanchez-Monge+ 2013)
NIR disk (Kraus + 2010)
Source I (Hirota + 2014)
4: Individual Disks ( < 100 AU)
(Beltran+ 2011)
ALMA ESによる大質量回転体の観測例
• Kepler-likeな回転は普遍的に見え始めている
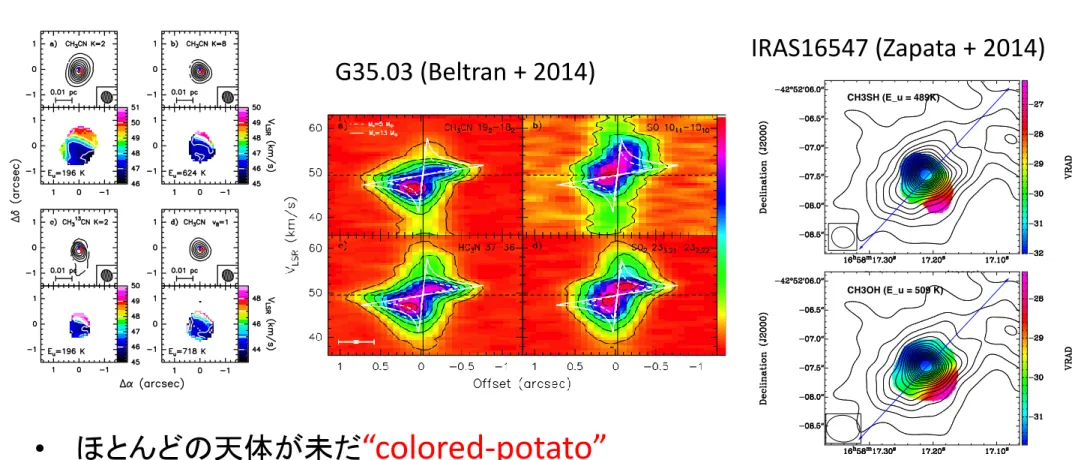
IRAS16547 (Zapata + 2014)
G35.03 (Beltran + 2014)
• ほとんどの天体が未だ
“colored-potato”
→ALMAの長基線データ待ち
M. T. Beltrán et al.: The high-mass star-forming region G35.03+ 0.35 imaged with ALMA
Table 4. CH3CN, CH313CN, and CH3CN (19–18) v8= 1 line
parame-ters toward core A.
Line VLSR FWHM TBa TBdV K (km s−1) (km s−1) (K) (K km s−1) CH3CN 0 47.8 ±0.2 9.4 ±0.2 9.1 ±1.5 91 ±9 1 " " 11.6 ±1.5 116 ±8 2 " " 10.9 ±1.5 109 ±6 3 " " 10.0 ±1.5 100 ±6 4 " " 8.7 ±1.5 87 ±6 5 " 9.4 ±0.2b 6.5 ±1.3 67 ±9 6 " " 7.0 ±1.3 70 ±9 7 " " 3.0 ±1.3 30 ±9 8 " " 2.2 ±1.3 22 ±9 9 " " 3.0 ±1.3 28 ±9 CH313CNc 2 47.7 ±0.4 9.4 ±0.2b 0.7 ±0.9 7.3 ±8.7 3 " " 1.5 ±0.9 15.4 ±11 4 " " 0.8 ±0.9 7.5 ±8.7 CH3CN v8= 1 (2, 1) 46.8 ±0.5 8.0 ±0.2b 1.9 ±0.4 16.5 ±3.4 (3, 1) " " 1.8 ±0.4 15.6 ±3.4 (4, 1) " " 2.2 ±0.4 18.9 ±3.4 (1, −1) " " 1.8 ±0.4 15.8 ±5.5 (0, 1) " " 2.3 ±0.4 20.0 ±5.5 (2, −1) " " 3.1 ±0.3 26.3 ±4.5 (5, 1) " " 1.5 ±0.3 13.0 ±5.1 (3, −1) " " 1.1 ±0.3 9.6 ±3.5 (6, 1) " " 0.8 ±0.3 7.1 ±3.5 (4, −1) " " 2.1 ±0.8 17.8 ±4.0 (7, 1) " " 1.5 ±0.7 13.0 ±4.1 (5, −1) " " 1.2 ±0.6 10.0 ±3.4 (8, 1) " " 0.2 ±0.4 1.7 ±3.2 (1, 1) " " 1.8 ±0.2 15.4 ±4.0 (6, -1) " " 0.4 ±0.2 3.5 ±4.1
Notes.(a)Brightness temperature integrated over a 3σ emission level
area.(b)This parameter was held fixed in the fit.(c)K = 0 and 1 are
strongly blended with CH3CN K = 5, and it has not been possible to
estimate their parameters.
of ∼ 50 K and methanol column densities ranging from 1 ×10¹⁵
to 2.0 ×1016cm−2.
The typical deconvolved average angular diameter of the 50% contour level of the line emission of the hot core to-ward core A is ∼ 0.′′4, which corresponds to a linear diameter
of ∼ 1300 AU, consistent with the size estimated from the dust emission (Table3). Figure12shows a plot of the deconvolved size of the 50% contour level of the integrated emission of differ-ent CH3CN, CH313CN, and CH3CN v8= 1 transitions, and of the
different species shown in Figs.9and10. The higher the excita-tion energy of the transiexcita-tion, the more compact is the emission, in particular for CH3CN. Taking only CH3CN and CH3CN v8= 1
transitions into account, one finds that the deconvolved size of the CH3CN K = 2 component (Eu= 196 K), which is 0.′′38
(∼ 1200 AU), is more than twice the size of the K, l = (6, −1) transition (Eu= 1030 K), which is 0.′′15 (480 AU). This
sug-gests a high opacity in the core and/or the existence of a temper-ature gradient, with the tempertemper-ature increasing toward the center of the core, which would be consistent with the existence of an embedded YSO.
The masses of the individual cores, their H2column
densi-ties, NH2, and their H2volume densities, nH2, which are given
Fig. 8.Maps of the integrated intensity (moment 0) (upper panels) and the line velocity (moment 1) (lower panels) toward core A of a) CH3CN K = 2, b) CH3CN K = 8, c) CH133CN K = 2, and d) CH3CN
K, l = (3, 1) v8= 1 toward the HMC A in G35.03. Contour levels, which
start at 3σ, are a) 0.3 to 4.5 by 0.6 Jy/beam km s−1, b) 0.1 to 1.3 by
0.2 Jy/beam km s−1, c) 0.03 to 0.33 by 0.06 Jy/beam km s−1, and d) 0.1 to 1.1 by 0.2 Jy/beam km s−1. Offsets are measured with respect to the
phase center. The red cross indicates the position of the dust emission peak of core A. The blue star indicates the position of the compact cen-timeter source CM2 detected by Cyganowski et al. (2011). The ALMA synthesized beam is shown in the lower right corner (upper panels). The energy of the upper level of each transition is indicated in the lower left corner (lower panels).
in Table5, were estimated from the 870 µm dust continuum emission assuming a dust opacity of 1.75 cm2g−1at 870 µm
(Ossenkopf & Henning1994) and a gas-to-dust ratio of 100. The dust temperature, Tdust, of the cores was assumed to be equal to
the Texestimated for CH3OH. The masses of the cores are ∼ 1–
5 M⊙(Table5). These masses are low enough to suggest that such cores might be forming low-mass stars. While this could certainly be the case for most of the cores, it is less likely for cores A and D, because these two are associated with the (puta-tive) HIIregions CM1 and CM2 and present emission of hot-core species such as CH3CN. These are typical signposts of
high-mass star formation.
A possible explanation for such low core masses could be that the interferometer is filtering out part of the continuum emis-sion and that the dust emisemis-sion observed would only trace the most compact component of the core. In fact, as seen in Sect.3.1, the continuum ALMA Cycle 0 observations only recover ∼ 20% of the total flux of the compact core. On the other hand, most of the cores material might have already been destroyed by ionizing
これまでに発見された回転構造の例
天体名
半径
分類
W51N
〜 8000 au
周星団
IRAS18360-0537
〜 5700 au
周星団
W33A
〜 4000 au
星周?
IRAS 20126+4104
〜 1000 au
星周
G35.20 -0.74
〜 1000 au
周連星?
CepA HW2
〜 700 au
星周
Orion KL
〜 50 au
星周
青字: 回転 + infall
赤字: ケプラー回転 (と主張されているもの)
→低質量星に比べてやや大きい傾向
(初期角運動量の大きさを反映? or Selection Bias ?)
降着円盤内縁の近赤外線観測
(e.g., Bik+ 2008)
• CO-bandhead輝線
(T
k
〜 3000 K)
→R < 10 au
• スペクトル形状はケプ
ラー円盤で再現可能
• 空間的には未分解
→TMT + AOでもきつい?
赤外線干渉計による直接撮像
(Kraus+2010)
• IRAS13481-6124
→降着末期、20 M
sun
• VLTI (赤外線干渉計)によ
る0”.003分解能の撮像
• R〜20 auのダスト円盤
を空間分解
• RTモデルから予想される
ダスト蒸発半径〜6 au
ジェット/アウトフロー
原始星ジェットHH30 (HST)
原
始
星
ジ
ェ
ッ
ト
回転円盤
• 降着流の一部が
回転軸方向に吹き出す現象
(e.g., Arce et al. 2007)
・
余分な角運動量・磁束
を抜き取る主要機構の1つ
• 一般に降着流の
10 – 30%が放出される
→実効的降着率の目安
→母体雲からの「巻き込み」も含めて
星形成効率を決定する主な要因
• 星質量によらず観測される
→放出率、運動量、光度と星質量に相関
(Wu et al. 2004; 2005)
駆動機構
•
”磁場と回転”による磁気流体的駆動
(e.g., Machida et al. 2008)
“Outflow”
“Jet”
☆アウトフローの性質は円盤環境を反映…β ≡ P
gas
/ P
B
• 駆動半径は a few au 以下
→アウトフローの性質から
ジェットの回転
• CB26 (T-Tauri)
→現状で最も綺麗な
回転ジェット
(Launhardt et al. 2008)
• Class 0 – Iでも報告例
Ori-S6
(Zapata et al. 2010)
NGC1333 IRS4
(Choi et al. 2011)
• 円盤との角運動量比
較が出来るような天体
は未だ無い
ジェットの磁場
• HH80-81
大質量原始星からの
シンクロトロンジェット
(Marti et al. 1995)
• 星形成における
最強ジェット
(1500 km s
-1
)
• Carrasco-Gonzalez et al.
(2010)
→偏波観測からジェットに
沿った磁場を検出
HH80-81のシンクロトロンジェット
アウトフロー駆動領域
• ALMAによる
Orion Source I 観測
(Hirota et al. 2014; 2016)
• 高温のH
2O円盤から
吹き出すSiOアウトフロー
→駆動半径 〜 10 au
• MHD計算における磁気遠
心力風とよく一致
• 現在追加の高分解能デー
タに関して出版準備中
(Hirota et al. 2016 in prep)
星周構造観測の現状と問題点
現状
1. ALMA登場で降着期の円盤もようやく分解可能に
→遠心力半径程度までは解像
2. 赤外線(干渉計)観測で星超近傍にも
→R〜5 – 10 au程度 (ただし大質量原始星)
問題点
1. まだまだ空間分解能不足
...ジェット/アウトフローの駆動領域は分解不可
(除: Orion Source I)
2. 速度情報に対する感度限界
...ALMAといえども長基線での輝線感度は限定的
中-近赤外線モニターでみる原始星変光
• 著者等はWarp円盤 or 円盤大気中のガス塊による遮蔽を主張
• 多波長分光モニター(Faesi+2012)では減光に変動無し
→数日 – 数ヶ月スケールでの降着率の変動を示唆
降着率変動による変光
• Safron et al. (2015)
HOPS 383 (class 0)
→バースト的増光
(e.g., FU-Ori)
• Muzerolle et al. (2013)
LRLL 54361 (Class I)
→周期的増光 (25.34日)
→連星運動に伴う降着
• J-VLAでのfollow-upは無応答
(Forbrich et al. 2015,
Galvan-Madrid et al. 2015)
→ジェットは即応等しない
(タイムラグ?)
CH
3
OH メーザー周期変動
• 大質量原始星周の高密度ガスに
付随 (e.g., 円盤/エンベロープ)
→数十日 〜 年程度の周期変動
(e.g., Goedhart et al. 2008)
→励起に必要な
背景光の変動を示唆
• 間欠型
→近日点での連星相互作用?
(van der Walt et al. 2011)
• サインカーブ型
→大質量原始星脈動
時間変動現象の利点/欠点
利点
1. 星近傍現象の間接的な手がかり
2. 小口径望遠鏡でも観測可能
欠点
1. 天体を選ぶ必要がある
2. 感度が必要な観測には向かない
(大型望遠鏡の時間確保は困難)
3. 仮説の検証が困難
ALMA
SKA
TMT
次世代装置:どこまで見える?
• 2015 – 2030稼働装置の分解能 〜 10 au @ 1 kpc
ALMA: 10 mas = 10 au (350 GHz, 15 km)
SKA: 10 mas = 10 au (1.4 GHz, 3000 km)
TMT: 10 mas = 10 au (2 μm, 30m, AO)
→星周エンベロープ・円盤構造をほぼ分解
→SED精度向上: YSO本体への理解も進む
Bird%Eye)View)directly)reflects)Dynamics)!!
最も欲しいブレークスルーは何か?
• 原始星を直接見たい
でしょう
• “星形成”なのに星までたどり着いてない
→光球サイズはVLBI/VLTIの分解能(~1 ミリ秒角)
と比べてもまだ小さい
• 現状では間接的な研究に終始
SEDによる議論
→パラメータだらけ、データ点不足
時間変動現象
→観測手段に難あり、全天体ではできない
3.1 SKAによる大質量原始星の
直接撮像の可能性
大質量原始星の進化
• 高降着率では
膨張
(Hosokawa+ 2009; 2010)
光球サイズ 〜
100 R
sun
低温 T
eff
< 10
4
K (A型星相当)
大光度 10
5
L
sun
• 進化パスは冷え方(= geometry)に依存
Radio Photosphereはどこか?
• ベテルギウスの例
電波帯での光球サイズ
→低周波程大、温度勾配を反映
(Lim et al. 1998)
• 膨らんだ原始星も似た構造なら
R
opt
= 100 R
sun
で
R
rad
= 1000 R
sun
〜 4.7 au
→視直径〜10 mas @ 1 kpc
• GHz帯ならSKAで分解可能
10 GHz / 基線長3000 km
= 2 mas 分解能
Nature © Macmillan Publishers Ltd 1998
8
NATURE|VOL 392|9 APRIL 1998 5 7 5
le tte rs to nature
Large convection cells as the
source of Betelgeuse
’s
extended atmosphere
Je re m y Lim *, Ch ris L. Ca rilli†, Ste p h e n M . W h ite ‡, A n th o n y J. Be a sle y† & Ra lp h G . M a rso n †
*Academia Sinica Instituteof Astronomy & Astrophysics, PO Box 1-87, Nankang,
Taipei 115, Taiwan
† National Radio Astronomical Observatory, Socorro, New Mexico 87801, USA ‡ Department of Astronomy, University of Maryland, College Park,
Maryland 20742, USA
. . . .
Supergiant starssuch asBetelgeusehaveveryextended atmospheres,
the properties of which are poorly understood. Alfve´n waves1–4,
acoustic waves1,2,5–7and radial pulsations8have all been suggested
aslikely mechanismsfor elevating these atmospheresand driving
the massiveoutflowsof gasseen in these stars: such mechanisms
would heat the atmosphere from below, and there are indeed
observations showing that Betelgeuse’s extended atmosphere is
hotter than the underlying photosphere9,10. Here we report radio
observations of Betelgeuse that reveal the temperature structure of the extended atmosphere from two to seven times the
photo-spheric radius. Close to the star, wefind that the atmosphere has
an irregular structure, and a temperature (3;450 6 850 K) consis-tent with the photospherictemperature but much lower than that of gas in the same region probed by optical and ultraviolet
observations10. This cooler gas decreases steadily in temperature
with radius, reaching 1;370 6 330 K by seven stellar radii. The cool gas coexists with the hot chromospheric gas, but must be much more abundant as it dominates the radio emission. Our results suggest that a few inhomogeneously distributed large
convective cells (which are widely believed11–16to be present in
such stars) are responsible for lifting the cooler photospheric gas into the atmosphere; radiation pressure on dust grains that
condense from this gas may then driveBetelgeuse’soutflow.
W e observed Betelgeuse for 11 hours on 21 December 1996 with the Very Large Array (VLA) in its highest-resolution (A) confi g-uration. At a wavelength of 7 mm, the angular resolution achieved is suffi cient to have resolved Betelgeuse’s optical disk, which subtends the largest angular diameter of any star visible in the night sky from the Northern H emisphere. Because Betelgeuse’s radio emission is purely thermal and optically thick (as demonstrated below), such spatially resolved radio observations also act as a pure thermometer of the stellar atmosphere. This is in contrast to observations in the ultraviolet continuum or optical and ultraviolet spectral lines, where the gastemperature isderived by comparison with theoretical model atmospheres. The VLA is at present equipped with 7-mm receivers on 13 of its 27 antennas. W e used the remaining 14 antennas to observe at the longer wavelengths of 1.3, 2, 3.6 and 6 cm, where we found Betelgeuse to be partially resolved. Figure 1 shows the fi nal image obtained at 7 mm. Betelgeuse’s atmosphere becomes opaque at very different heightswhen observed at different wavelengths, and at 7 mm the average diameter is approximately twice that measured in the optical. The radio surface is clearly not spherically sym metric, nor does it appear to be axially symmetric.
To quantify the total flux and area of the 7-mm surface and hence its brightness temperature, we fi tted circular and elliptical disks to the measured visibilities. The best fi t was provided by a uniformly bright ellipse with dimensions of 95 6 2 mas 3 80 6 2 mas at a position angle of 6786 78 (measured east from north), and a total flux density of 28:0 6 5:6 mJy; the uncertainty in the flux measure-ments is dominated by the uncertainty in the absolute flux calibra-tion of the VLA at 7 mm, estimated to be 6 20% . Although this
model ellipse does not provide a perfect fi t to the observed disk structure, the residuals are small and approximately cancel in flux indicating that the total flux and area of the fi tted ellipse never-theless closely match that of the observed stellar radio disk. The implied brightness temperature is 3;450 6 850 K (the uncertainty here, dominated by the uncertainty in the absolute flux calibration, represents extreme limits; elsewhere the quoted uncertainty refers to 6 1j ), consistent with the stellar phospheric temperature of , 3,600 K (ref. 17). At the longer radio wavelengths— where Betelgeuse’s atmosphere appears increasingly large while our angular resolution becomes progressively poorer — we derived just the average diameter and total flux density of the stellar radio disk by fi tting uniformly bright circular disks to the measured visibilities at each wavelength. The increase in size with radio wavelength implies that the observed radio surfaces are optically thick, and hence have brightness temperatures reflecting the local gas tempera-ture. In Fig. 2 we plot the measured brightness temperature of Betelgeuse’s atmosphere as a function of stellar radius. The tem-perature of the atmosphere can be seen to decrease steadily with increasing radius from 3;450 6 850 K at , 2R*to 1;370 6 330 K at
, 7R*(here R*is the radius of the photosphere).
Our results are at odds with current theoretical and empirical models for the structure and temperature of Betelgeuse’s atmosphere. Theoretical models which invoke the dissipation of Alfve´n waves1–4,
shocks produced by acoustic waves1,2,5–7, or shocks produced by
100 50 0 —50 —100 —100 —50 0 50 100 M ill ia rc s e c o n d s M illiarcsecond s BEAM Op tical d isk
Fig u re 1 An im ag e of Betelg euse’s atm osp here ob served at a w avelen g th of 7 m m w ith the VLA. The ang ular resolu tion of this ob se rvation is 40 m as (b lue circle at b ottom left corne r). W hite contour lines are p lotted at 10% , 20% ,¼,90% , and 99% of the p eak fl ux of the fals e-colour radio im ag e. Betelg euse’s 7-m m surface has an averag e dia m eter ap p roxim a tely tw ice as larg e a s its op tical surface of diam eter 45 m as (b lack circle w ith its centre p laced coinciden t w ith the intensity-w eig hted centre of the radio disk), and is clearly not sp herically sym m etric. To m ake this im ag e, w e rem oved fast trop osp heric p hase fl uctuations using a new ly im p lem en ted ‘‘fast-sw itching ’’ob serving m ode24a t the VLA w hich
allow ed us to ob serve a nearb y calib rator frequently w ithou t losing too m uch ob servin g tim e. W e therefore sw itched b etw een Betelg euse and an unresolved extrag alactic ob ject, 05528 þ 03135 (used as our calib ra tor), located 4.28 aw ay, w ith a cycle tim e of only , 2.5 m in. To check the effectiveness of the a m p litude and p hase corrections , w e also sw itched b etw een 05528 þ 03135 and a nother unresolved extrag alactic ob ject, 05326 þ 07327 (used as our control source), located 5.38 aw ay, at tw o intervals durin g the ob se rvation w ith the sam e cycle tim e; this yielded an unresolved im ag e for the control source. W e set the fl ux density sca le using the p rim ary fl ux calib rator 3C286. The fi nal im ag e includes a sing le iteration in p hase self-calib ration to correct for sm all residu al p hase errors: this self-calib rated im ag e has a , 60% low er noise fl uctuation level tha n the orig inal im ag e (consiste nt w ith the overall system noise), b ut is m orp h olog ically identical. Also, the fi nal im ag e w as cons tructed using natural w eig hting of the visib ilities b ut restored w ith a synthesized b ea m of size corresp o nding to that ob tained using uniform w eig hting . The uniform w eig hted im ag e is identical excep t for a slig htly (35% ) hig h er noise level, dem onstrating the rob ustness of our cons ervative im p lem en tation of the sup er-resolu tion technique.
Nature © Macmillan Publishers Ltd 1998
8
radial pulsations8 to elevate the stellar atmosphere all predict a
globally spherically sym metric structure, contrary to that in fact observed. Empirical models constructed to fi t previous ultraviolet and radio data predict a spatially extended hot chromosphere18,19,
consistent with the idea that strong heating at low heights elevates the stellar atmosphere. The ultraviolet image of Betelgeuse taken with the Hubble Space Telescope (H ST) clearly shows its chromosphere to have a diameter of 125 6 6 mas in the continuum at 2,550 A˚, which is inferred to be formed at a temperature of , 5,000 K (ref. 10). Our radio measurements, however, show that the hot chromospheric gas is not the only component at this height in Betelgeuse’s atmosphere. The 2,550 A˚ height is above that which we probed at 7 mm, but is almost identical to that probed at 1.3 cm (diameter of 114 6 4 mas). The temperature measured at 1.3 cm, however, is only 3; 180 6 350 K, formally below the photospheric temperature. From scans of the ultraviolet disk with the H ST, the chromosphere observed in the M gII h and k emission lines is
inferred to extend to an even larger diameter of at least 270 mas (ref. 9). This surface is roughly comparable in diameter to that which we and others19 have probed at 6 cm (diameter of
310 6 30 mas), but here the temperature measured in radio is just 1;370 6 330 K. An earlier speckle image of Betelgeuse’schromosphere observed in the H a absorption line, which should be formed at a slightly higher temperature than the 2,550 A˚ continuum, showed a diameter of , 95 mas (ref. 20). This is comparable in diameter to our 7-mm measurement, but again the temperature measured in radio is much lower than is required for H a absorption. Clearly, there are signifi cant differences over the same height range between the temperature of the atmosphere inferred from optical and ultraviolet observations and the temperature directly measured in our radio observations.
W e therefore conclude that the relatively cool gas responsible for the observed stellar radio emission spans the same height range as the hotter gas responsible for the optical and ultraviolet chromospheric signatures. To determine the conditions under
which the cooler gas component could dominate the observed radio emission, we refer to the recent work by Reid and M enten21
who studied the radio opacity of late-type giant star atmospheres. They showed that the radio opacity of gas at a temperature signifi cantly below 4,000 K is provided by the interactions of electrons, obtained predominantly from elements with low ioniza-tion potentials such as potassium and sodium, with neutral atomic and molecular hydrogen. At temperatures above 4,000 K, corre-sponding to that of the hot chrom ospheric gas, scattering of electrons by protons (that is, ionized hydrogen atoms) provides the dominant source of radio opacity. As the electron –neutral absorption per neutral particle is a factor of about 103 smaller than the electron –ion free–free absorption per ion, the preferential detection of the cooler gas component in our radio observations implies that it must be more than 3 orders of magnitude more abundant than the chrom ospheric gas. Under these circumstances, it seems unlikely that the diffuse chromospheric gas plays an important role in elevating Betelgeuse’s atmosphere.
Instead, the irregular structure and predominantly low tempera-tures of Betelgeuse’s atmosphere suggest the following alternative mechanisms for elevating its atmosphere and driving its mass outflow. Over 20 years ago, Schwarzschild11 proposed that
late-type giant and supergiant stars possess very large convection cells, a few of which may be present on the stellar surface at any one time. The existence of such large convection cells has since gained wide acceptance in order to explain the polarized optical light commonly seen from these stars (see ref. 12 and references therein), as well as photospheric bright spots seen on the few red supergiants imaged13–16, most notably Betelgeuse. Optical images of Betelgeuse
show that the morphology of itsphotospherechangeswith time, but at any given time can be well fi tted by the superposition of one or more bright spots (which are not always required) on a circular stellar disk13–16. The H ST ultraviolet image of Betelgeuse’s
atmosphere also appears to show a bright spot superposed on a circular disk10. Such large convection cells could elevate
photo-spheric material into the stellar atmosphere11,16 and, if distributed
inhomogeneously over the stellar surface, produce an asymmetric atmospheric structure.
The elevation of photospheric material into the stellar atmosphere naturally explains our measurements of photospheric-like tempera-turesat small stellar radii, while the smooth decrease in temperature with increasing radius may represent expansion and cooling of the elevated material. Radiation pressure on dust grains condensed from the dense cool gas could then drive Betelgeuse’s massive outflow. This mechanism has long been postulated for driving the massive cool outflows of late-type giant and supergiant stars22, but
faces severe diffi culties if an extended inner region of the stellar atmosphere is entirely heated to chromospheric temperatures. Dust grains would then be required to form at relatively large stellar radii, where the gas density may in fact be too low for dust to condense effectively, or where radiation pressure may not be suffi ciently intense to drive a massive outflow even if dust formation ispossible. These problemsarealleviated on Betelgeuse by the presenceof dense cool gas in its inner atmosphere; indeed, dust has been detected to form episodically at radii assmall as, 4R*(ref. 23). W e note that the
vigorous expulsion of gas into Betelgeuse’s atmosphere would be expected to produce shock waves16, which could heat
localized but spatially distributed (and therefore extended) regions of its atmosphere to chrom ospheric temperatures. M
Received 21 N ovember 1997; accepted 22 January 1998.
1. H artmann, L. & M acGregor, K. B. M omentum and energy deposition in late-type stellar atmosphere and winds. Astrophys. J. 242, 260–282 (1980).
2. H artmann, L. & M acGregor, K. B. W ave-driven windsfrom cool stars. I. Some effectsof magnetic fi eld geometry. Astrophys. J. 247, 264–268 (1982).
3. H olzer, T. E., Fla˚, T. & Leer, E. Alfve´n waves in stellar winds. Astrophys. J. 275, 808–835 (1983). 4. H artmann, L. & Avrett, E. H . On the extended chrom osphere of a Orionis. Astrophys. J. 284, 238–249
(1984).
5. Ulmschneider, P. The chromospheric emission from acoustically heated stellar atmospheres. Astron.
Astrophys. 222, 171–178 (1989).
le tte rs to nature
5 7 6 NATURE|VOL 392|9 APRIL 1998
4,000 3,000 2,000 1,000 0 0 50 100 150 200 Photosp heric tem p erature P h o to s p h e ri c r a d iu s 7 m m 1. 3 c m 2 c m 3 .5 c m 6 c m T e m p e ra tu re ( K )
Rad ius (m as)
Fig u re 2 The tem p erature p rofi le of Betelg eu se’s atm osp h ere m easured at the radio w avelen g ths indicated b elow each p oint. All the p oints have 6 1j error b ars, excep t for the 7-m m data p oint w here the error b ar w ith arrow s indicate extrem e lim its (see text). The p hotosp heric radius of 22.5 m as (ref. 17) is indica ted b y a dotted line , and the p ho tosp heric tem p erature of 3,600 K (ref. 17) is indicated b y a das hed line . The stellar radius at 7 m m corresp onds to the averag e radius m easu red in the sp atially resolved im ag e of Fig . 1. At the long er radio w ave -len g ths, w e derived the stellar radius b y fi tting a un iform ly b rig ht circular disk to the m easu red visib ilities at each w aveleng th. The b rig htness tem p eratu re at each w aveleng th w as calcula ted using the equation Tb ¼ 2:0 Sm JyðlcmÞ2=ðvm a jvm inÞK,
w h ere SmJyis the total fl ux density, lcmis the ob serving w aveleng th, and vmaj
a nd vmin are the m ajor and m inor axes of the stellar radio disk, resp ectively, in
a rcse conds. W e note that the de rived b rig htness tem p eratu re is indep endent of a ny assum p tions such as the distance to the sta r.