In Situ Infrared Observation of a
Photo-Decomposition Process of Organic
Contaminants on a TiO2 Nanotube Film Surface
著者
Teng Ma, Yasuo Kimura, Daisuke Tadaki, Ayumi
Hirano Iwata, Michio Niwano
journal or
publication title
Journal of The Electrochemical Society
volume
166
number
15
page range
H842-H848
year
2019-11-18
URL
http://hdl.handle.net/10097/00130723
doi: 10.1149/2.1151915jesIn-situ infrared observation of a photo-decomposition process of organic contaminants
1
on a TiO2 nanotube film surface
2 3
Teng Ma,1,2,= Yasuo Kimura,3,= Daisuke Tadaki,4 Ayumi Hirano-Iwata,1,4 Michio Niwano4,†,Z
4 5
1
WPI-Advanced Institute for Materials Research, Tohoku University, 2-1-1 Katahira,
Aoba-6
ku, Sendai 980-8577, Japan
7
2
Core Research Cluster, Tohoku University, 2-1-1 Katahira, Aoba-ku, Sendai 980-8577,
8
Japan
9
3
Department of Computer Science, Tokyo University of Technology, 1404-1 Katakura-machi
10
Hachioji, Tokyo 192-0914, Japan
11
4
Research Institute of Electrical Communication, Tohoku University, 2-1-1 Katahira,
Aoba-12
ku, Sendai 980-8577, Japan
13 14
=
These authors contributed equally to this work
15
z
Corresponding Author E-mail Address [[email protected]]
16
†Present address: Kansei Fukushi Research Institute, Tohoku Fukushi University,
17
Kunimigaoka, Aoba-ku, Sendai 989-3201, Japan
18 19 20
Abstract
21
We investigated a photocatalytic reaction on TiO2 nanotube (NT) surfaces using infrared
22
absorption spectroscopy with multiple-reflection geometry (MIR-IRAS). We used an
23
anodization technique to form a film of well-aligned TiO2 NTs on the Si prism used for
MIR-24
IRAS measurements. The photocatalytic decomposition process of the endocrine disruptor,
25
dioctyl phthalate (DOP), on the TiO2 NT surface was monitored in-situ and in real time. We
26
demonstrated that the photocatalytic decomposition of organic materials is promoted with the
27
presence of molecular oxygen. It was observed that the amount of surface-adsorbed water
28
molecules changed during the reaction. We proposed a simple reaction model that can
29
reproduce the time-dependent change of the surface coverage of water and DOP. By
30
comparing the photodecomposition of organic materials on TiO2 NT films with that on TiO2
31
nanoparticle (NP) films, we showed that TiO2 NT films are superior in photocatalytic
32
reactivity compared to NP films. We suggest that the NT structure provides wider and shorter
33
paths for the transport of photo-generated radicals and byproducts, leading to a higher
34
reactivity compared to TiO2 NPs.
35 36 37 38 39 40 41 42 43 44
45
Introduction
46
Since the first application of the TiO2 photocatalytic effect by Fujishima et al, this unique
47
effect has attracted a lot of attention from both researchers and engineers.1 Recently, the
48
applications of TiO2-photocatalysts, such as the photo-oxidation of surface contaminants and
49
photo-reduction for fuel production, have demonstrated strong potential and remarkable
50
progress.2-13The nanostructure of the TiO2 material can substantially affect the photocatalytic
51
efficiency. Salmasi et al. has reported that TiO2 nanotubes (NTs) are superior in reactivity
52
compared to TiO2 nanoparticles (NPs) as a catalyst of an oxide-sulfurization process.9 Liu et
53
al. has also demonstrated that TiO2 NTs can oxidize methylcyclonhexane faster than TiO2
54
NPs.11 However, the influence of the nanostructure on the photocatalytic reaction on TiO2
55
surfaces has not been well studied.
56
The first stage of photo-oxidation of organic materials on TiO2 surfaces is when
57
electron/hole pairs are generated by photons, which are absorbed by the TiO2 photocatalyst.
58
The holes can react with the surface groups of TiO2 or water molecules to form hydroxyl
59
radicals (•OH). In particular, surface-bound hydroxyl radicals (Ti-•OH) are thought to play an
60
important role in oxidizing organic species near the TiO2 surface.15 On the other hand, the
61
photo-generated electrons in bulk TiO2 may react with O2 to form •O2- radicals, which also
62
participate in the photo-induced decomposition process of the surface organic materials.15,16
63
Henderson showed that the photo-induced oxygen atoms exchange between the TiO2 and
64
gaseous O2 under vacuum conditions.17 It has also been reported that water molecules can
65
incorporate into a TiO2 lattice during the photocatalytic reaction.5 It seems that water
66
molecules and molecular oxygen (O2) can both act as the source of the oxygen atoms which
67
are required for the photo-oxidation reaction. However, there is seldom any study comparing
68
the reactivity of H2O and O2 in a photo-induced reaction in detail, especially on TiO2 NT
69
surfaces.
70
In this study, therefore, we investigated the photocatalytic reaction at TiO2 NT surfaces
71
using infrared absorption spectroscopy with multiple-reflection geometry (MIR-IRAS). This
72
provided us with valuable information on the chemical changes on the molecular scale
73
relevant to the surface reactions.6,18-20 In order to carry out MIR-IRAS measurements on TiO2
74
NT film surfaces, we needed to form a TiO2 NT film on an MIR Si prism surface. The
75
conventional method for forming vertically aligned TiO2 NT arrays is to anodize metallic Ti
76
plates which are infrared opaque.7,10,14 We therefore developed a method to fabricate TiO2
77
NTs directly on the Si MIR prism. Using the endocrine disrupting chemical, dioctyl phthalate
78
(DOP), as a model organic material, we studied the photocatalytic process of organic
79
materials on TiO2 NT surfaces in different reaction environments to demonstrate the effect of
80
water and oxygen on photocatalysis. Also, we investigated the photocatalytic reaction of both
81
TiO2 NPs and NTs to show how the nanostructure affects the photo-oxidation reaction.
82 83 Experimental 84 A. Experimental setup 85
The experimental setup we used in this study is shown schematically in Fig. 1. The Si
86
prism was mounted in a specially designed cell, as shown in Fig. 1. In the sealed cell, we can
87
precisely control the humidity and composition of the gas. In order to investigate the
photocatalytic reaction of TiO2, three ultraviolet (UV) light-emitting diodes (LED, 365 nm)
89
were attached to the top cover (acrylic) of the cell. 60 µL of DOP in ethanol solution (100
90
µM) was dispersed on the TiO2 NT film surface. After fully evaporating the ethanol from the
91
TiO2 surface, the Si prism was transferred into the cell shown in Fig. 1. The humidity and the
92
temperature (25 °C) in the cell were precisely controlled to obtain reproducible data. We
93
investigated the photocatalytic process in dry (relative humidity, RH = 3–7%) and wet
94
conditions (RH = 60–65%) with two different carrier gases, Air and pure N2 gas. It should be
95
noted that the air contained 20 % oxygen. The decomposition of DOP on TiO2 NPs and NTs
96
under UV illumination was monitored in-situ using MIR-IRAS. An infrared beam entered the
97
Si prism through one side of the beveled edges and was collected at the other side of the
98
bevels using a liquid-nitrogen-cooled mercury-cadmium-telluride (MCT) detector. In the
99
prism, the beam reflected about 100 times generating an evanescent field at the surface. The
100
evanescent field is highly sensitive to chemical changes, therefore it is suitable for the in-situ
101
observation of the photocatalytic reaction which happens on the TiO2 surface.
102
B. Si Prism fabrication for MIR-IRAS
103
The fabrication process of the Si prism for MIR-IRAS is shown in Fig. 2. A highly doped
104
silicon prism (10 × 4 × 0.5 mm3) with 45° beveled edges was cleaned in a mixture of H2SO4
105
and H2O2, followed by 5% hydrofluoric acid. A thin layer of Au was deposited onto the
106
backside of the Si prism by thermal evaporation through a metal mask. After that was done,
107
50 nm of TiO2 and 200 nm of Ti were sequentially deposited onto the surface of the prism.
108
Then the TiO2 NTs were formed by anodizing the deposited Ti layer. The detailed fabrication
109
method for the TiO2 NTs has been described elsewhere.14,22 The Au layer at the bottom of the
110
prism acted as the contact for the anodization process. The as-formed TiO2 NTs were then
111
crystallized (anatase) at 450 °C to achieve the high catalytic activity.21 Figures 3(a) and 3(b)
112
show typical top and cross-sectional views of the scanning electron microscopy (SEM)
113
images of the TiO2 NT film fabricated on the Si MIR prism. The SEM images were recorded
114
at an accelerating voltage of 3.0 kV using Hitachi SU-8000 equipment. Fig. 3 shows that the
115
inner and outer diameters of the TiO2 NTs were about 50 and 100 nm, respectively. The
116
thickness of the film was approximately 500 nm. It is known that TiO2 in the anatase form
117
exhibits high photocatalytic activity under ultraviolet (UV) illumination. TiO2 NT films
118
grown by anodization of metallic Ti is amorphous and can be converted to the anatase form
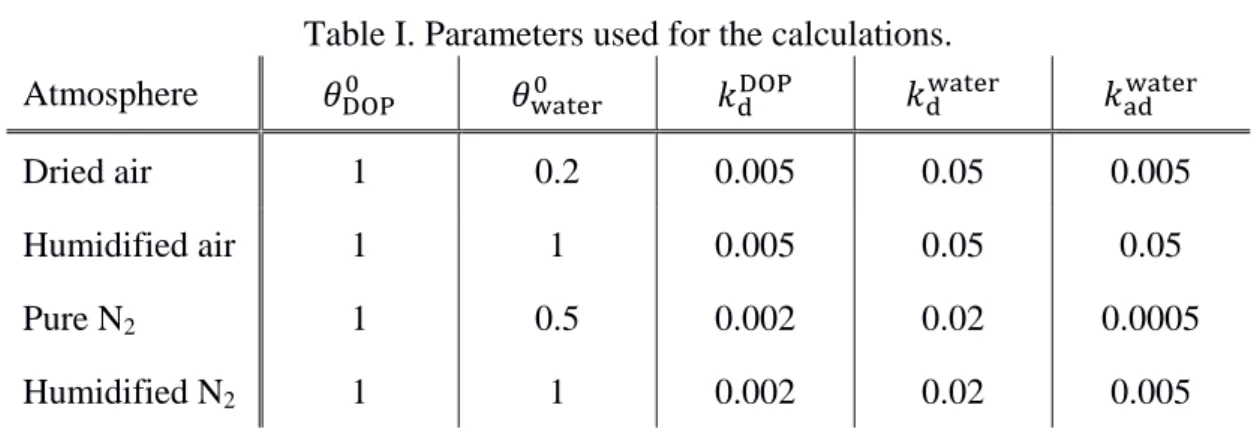
119
by annealing at approximately 450 °C. Fig. 3(c) shows a typical X-ray diffraction (XRD)
120
pattern of the TiO2 NT film post annealing. XRD measurements were performed using
121
Rigaku RINT-2000 equipment with CuKα radiation operating at 40 kV and 40 mA. The
122
scanning step was 0.02°. It can be seen in Fig. 3(c) that the as-formed TiO2 NT film was
123
transformed into the anatase phase due to post annealing at 450 °C in air.
124
To fabricate the prism with the TiO2 NPs, a thin layer of TiO2 NPs (anatase, Solaronix)
125
was spin-coated from an aqueous suspension (2.5 g/mL). The thickness of the NP film was
126
similar to that of NT film (500 nm). The NP film was then annealed at 450 °C to improve
127
adhesion between the prism and the NP layer.
128 129
Results and discussion
130
A. Reaction-atmosphere-dependence of photocatalytic decomposition of organic
131
materials
In Fig. 4 we have shown the IRAS spectrum of DOP on the TiO2 NT film after UV
133
irradiation. The reference for this spectra was the spectrum of the as-deposited DOP on the
134
TiO2 NT surface prior to UV illumination, which we have shown in the bottom of Fig. 4. The
135
molecular structure of DOP is shown in the inset of Fig. 4. Two distinct features can be
136
identified at around 1705 and 2800–3000 cm-1. The feature at 1705 cm-1 represents the C=O
137
stretching modes of ester groups, and the feature at 2800–3000 cm-1 represents the C-H
138
stretching vibrational modes of -CH3, -CH2 and -CH groups in the DOP molecule. It can be
139
seen in Fig. 4 that the IRAS spectrum under UV illumination exhibits troughs, the positions
140
of which are the same as those of the dominant vibrational modes of the pristine DOP. This
141
clearly indicates that due to UV illumination, the DOP molecules on the TiO2 NT film were
142
decomposed. As described later, we observed that DOP on the bare Si surface did not show
143
any spectral changes under UV illumination. Thus, we concluded that the DOP
144
decomposition observed on the TiO2 NT film is due to the photocatalytic effect of the TiO2
145
NTs.
146
The primary purpose of this study was to clarify the dependence of photocatalytic effect
147
on the reaction atmosphere. Therefore, we examined photocatalytic reactions under the
148
following four types of environments: (1) dry air, (2) pure nitrogen gas, (3) humidified air
149
and (4) humidified nitrogen gas. Humidity control was performed by controlling the gas flow
150
rate as the gas was supplied to the measurement cell through a bubbler. The humidity of the
151
dry atmosphere (dry condition) was set at 3–7%, and that of the humidified atmosphere (wet
152
condition) was RH = 60–65%. Fig. 5 shows the spectral changes on TiO2 NT film surfaces
153
under UV illumination in the four different environments. From Fig. 5, it can be seen that the
154
decomposition of DOP proceeds faster in oxygen-containing dry air than in oxygen-free
155
nitrogen gas. Also, it appears that the humidity does not significantly promote DOP
156
decomposition.
157
In order to further investigate how the photocatalytic reaction proceeds at the TiO2
158
surface, we have looked in detail at the spectral changes in the wavenumber region between
159
2500 and 4000 cm-1, where the C-H and O-H stretching vibrational modes should appear. To
160
quantify the decomposition rate of the DOP molecules under UV illumination, we focused on
161
the negative feature observed at a wavenumber of 2964 cm-1 (Fig. 5). This feature
162
corresponded to the C-H stretching vibrations of DOP, and its peak intensity represented the
163
amount of DOP decomposed and detached from the TiO2 NT surface. We calculated the DOP
164
residue ratio based on the peak intensities at 2964 cm-1 (as seen in Fig. 5) and the same peak
165
before UV illumination. The time evolution of the DOP residue ratio for the four different
166
environments (dry air, pure N2, humidified air and humidified N2) is shown in Fig. 6. For
167
comparison, the result obtained for a bare Si surface is also shown in Fig. 6. The calculated
168
DOP residue ratio hardly changed during UV illumination when DOP was deposited on the
169
Si prism surfaces. It is evident that the residue ratio significantly changed when DOP was
170
deposited on the TiO2 NT film surface. These facts suggest that DOP decomposition is
171
induced by the photocatalytic effect of the TiO2 NTs upon UV illumination. We also noticed
172
that the reaction rate of the DOP decomposition on the TiO2 NT surface depends on the
173
atmosphere. In a N2 atmosphere, only 40% of the DOP molecules were decomposed in 5
174
hours of UV illumination, while the decomposition ratio increased to 80% in the
oxygen-175
containing atmospheres. Furthermore, we observed that the decomposition ratio does not
depend on the humidity of the atmosphere. These observations indicate that O2 is superior in
177
promoting the photo-oxidation reaction on TiO2 NT surfaces compared to N2 and H2O. The
178
oxygen molecules react with photo-generated electrons to form •O2- radicals, which may
179
further react with and decompose organic molecules on the surface. This then produces
180
carbon dioxide as the final product.15,16 In addition, the oxygen molecules may also assist the
181
consumption of photo-generated electrons and prevent the electron/hole recombination,
182
leading to an enhancement of the photocatalytic effect.
183
B. Time-dependent surface coverage of water
184
In order to understand how water is involved in the photocatalytic reaction, we looked at
185
the IR spectra in the range of 3000–4000 cm-1, where the O-H stretching mode (3400 cm-1) of
186
water appears. As shown in Fig. 5, in all of the tested atmospheres, the amount of H2O
187
adsorbed at the TiO2 surface initially decreased with illumination time. Since we purged the
188
sample cell with dry N2 before starting the UV illumination, the observed loss of water at the
189
surface is not due to the evaporation of H2O from the surface. Almost all of loosely bound
190
H2O molecules should have been removed from the surface during purging process. The
191
remaining H2O molecules would be strongly adsorbed to the TiO2 surface.23 The reduction of
192
H2O molecules at the surface during UV illumination, as shown in Fig. 5, indicates that the
193
H2O molecules present at the TiO2 surface are partially involved in the photocatalytic
194
reaction, as has been previously suggested by Montoya et al.,5 who reported that H2O can act
195
as an oxidation reagent in the photo-oxidation process in aqueous solutions. However, as can
196
be seen from Fig. 6, an increase in the humidity of the atmosphere did not facilitate the
197
decomposition of DOP.
198
In Fig. 7, we show the plot of the time dependence of the absorbance of the O-H
199
vibrational mode along with that of the C-H vibrational mode. The initial decrease observed
200
for all the atmosphere types can be attributed to the removal of surface water by the
201
photocatalytic effect of the TiO2 surface. In the humidified atmosphere, in particular in wet
202
air, an increase in the intensity of OH band was observed. The subsequent increase is
203
attributed to the adsorption of water on the exposed TiO2 surface after the decomposition of
204
the DOP molecules. It has been reported that the TiO2 surface becomes hydrophilic after the
205
removal of surface contaminants by the photocatalytic reaction due to the replenishment of
206
surface hydroxyl groups.24 This means that after removing surface contaminants, the water
207
molecules in the atmosphere most likely get adsorbed onto the surface.
208
To support our interpretation, we propose a simple model to simulate the time evolution
209
of the amount of surface water and DOP. The concept of our model is shown schematically in
210
Fig. 8. Suppose the starting surface is covered with DOP and water. Their relative coverage is
211
represented by 𝜃𝐷𝑂𝑃 and 𝜃𝑤𝑎𝑡𝑒𝑟, respectively. DOP and water are decomposed and removed
212
from the TiO2 NT surface through the photocatalytic reaction. The rate constants for these
213
reactions are 𝑘𝑑𝐷𝑂𝑃 and 𝑘𝑑𝑤𝑎𝑡𝑒𝑟. After the removal of the surface adsorbate, the surface
214
becomes hydrophilic and the water molecules in the atmosphere readsorb on the surface. The
215
reaction constant of water readsorption is 𝑘𝑎𝑑𝑤𝑎𝑡𝑒𝑟. In our model, the humidity of the
216
atmosphere is included in this rate constant; in other words, the higher the humidity is, the
217
larger the value of 𝑘𝑎𝑑𝑤𝑎𝑡𝑒𝑟is. The reaction rate equations representing the temporal change of
218
the surface coverage of water and DOP are as follows:
219
𝑑 𝜃𝐷𝑂𝑃⁄𝑑𝑡= −𝑘𝑑𝐷𝑂𝑃𝜃𝐷𝑂𝑃 , (1)
221 𝑑 𝜃𝑏𝑎𝑟𝑒⁄𝑑𝑡= 𝑘𝑑𝐷𝑂𝑃𝜃𝐷𝑂𝑃+ 𝑘𝑑𝑤𝑎𝑡𝑒𝑟𝜃𝑤𝑎𝑡𝑒𝑟− 𝑘𝑎𝑑𝑤𝑎𝑡𝑒𝑟𝜃𝑏𝑎𝑟𝑒 , (2) 222 223 𝑑𝜃𝑤𝑎𝑡𝑒𝑟⁄𝑑𝑡= −𝑘𝑑𝑤𝑎𝑡𝑒𝑟𝜃𝑤𝑎𝑡𝑒𝑟+ 𝑘𝑎𝑑𝑤𝑎𝑡𝑒𝑟𝜃𝑏𝑎𝑟𝑒. (3) 224 225
These reaction equations were solved by a sequential calculation method to determine
226
the amount of surface adsorbed water and DOP. The results of calculation are shown in Fig. 9.
227
The parameters which we used in the calculations to obtain a good fit to the experiment are
228
shown in Table I. The initial value of 𝜃𝐷𝑂𝑃, 𝜃𝐷𝑂𝑃0 , was set at the same value. The initial value
229
of 𝜃𝑤𝑎𝑡𝑒𝑟, 𝜃𝑤𝑎𝑡𝑒𝑟0 , was adjusted to reproduce the variation of the absorbance of the O-H
230
vibrational mode. It should be noted that, as mentioned above, 𝜃𝐷𝑂𝑃 and 𝜃𝑤𝑎𝑡𝑒𝑟 are relative
231
surface coverage, and therefore the sum of 𝜃𝐷𝑂𝑃0 and 𝜃𝑤𝑎𝑡𝑒𝑟0 is not unity. It can be seen from
232
Fig. 9 that the calculation quantitatively reproduces the experimental results shown in Fig. 7,
233
indicating that our assumption on the temporal change of water adsorption is reasonable.
234
From the parameter values shown in Table I, several points are worth mentioning. Firstly, the
235
decomposition rate of water is about an order of magnitude larger than that of DOP. This is
236
quite natural considering that the decomposition of the water molecule is a single-step
237
process while the thorough decomposition of DOP requires multiple reactive radicals and it is
238
a multi-steps process. Secondly, the decomposition rate of DOP is larger in the
oxygen-239
containing atmosphere than that in the oxygen-free atmosphere. This result is consistent with
240
our conclusion from Fig. 5 and Fig. 6, which is that oxygen is more effective in facilitating
241
the photocatalytic reaction on the TiO2 NT surface. Thirdly, the readsorption rate in the
242
humidified atmosphere is larger than that in the dry atmosphere. This may be attributed to the
243
increase in the impinging rate of water molecule on the surface in the humidified ambient.
244
Finally, it should be noted that the readsorption rate in the oxygen-containing atmosphere is
245
larger than that in the corresponding oxygen-free atmosphere. This could be attributed to the
246
higher decomposition rate of DOP in oxygen-containing atmosphere, and thus larger surface
247
area for water adsorption.
248
Close inspection of Fig. 5 reveals that the peak at 3740 cm-1, as indicated by arrows in
249
Figs. 5(a) and 5(b), shows up on the surface in the O2-containing atmosphere. On the other
250
hand, no peaks can be identified in the vicinity of 3740 cm-1 on the TiO2 surface in the
251
oxygen-free atmosphere. This peak is attributed to the O-H stretching vibration mode of the
252
surface Ti-OH species on TiO2. We suppose that removal of DOP and water molecules
253
produces Ti-OH species on the resulting bare TiO2 surface. Note that such a surface will be
254
hydrophilic and therefore easy to adsorb water. Accordingly, we interpret that the preferential
255
formation of surface Ti-OH species in the oxygen-containing atmosphere is the origin for the
256
observed enhancement of water readsorption on the surface. We believe that oxygen radicals
257
would favorably create surface Ti-OH species. However, the details why the surface Ti-OH
258
species are favorably formed in the O2-containing atmosphere are not clear at the present
259
moment.
260
C. Comparison of NT and NP films
In order to investigate how the nanostructure affects the photocatalytic reaction, we
262
fabricated a Si MIR prism with a thin layer of TiO2 NPs. As shown in Fig. 10, a thin
263
mesoporous film of NPs with a size of 15~20 nm formed on the Si MIR prism, which is in
264
contrast to the structure of the NT thin films where the nanotubes were regularly aligned. In
265
Fig. 11, we showed a series of IRAS spectra of DOP on the TiO2 NP film upon UV
266
illumination in dry air. These spectra have been collected for different illumination durations
267
and the spectrum of the DOP on the TiO2 NP surface before UV illumination was used as the
268
reference. It can be seen by comparing Figs. 4 and 11 that the spectral changes observed for
269
the NP TiO2 are quite similar to those observed for the NT TiO2 film. The two intense
270
features observed around 1705 cm-1 and 2800~3000 cm-1, are due to the C=O stretching
271
modes of the ester groups and the C-H stretching modes of the -CH3, -CH2 and -CH groups in
272
the DOP molecule, respectively.
273
To compare the photocatalytic reactivity of the TiO2 NTs and NPs, we examined the
274
time-evolution of the DOP residual ratio for the TiO2 NT and NP films in Fig. 12. We can see
275
from Fig. 12 that the photocatalytic decomposition of DOP on the TiO2 NT and NP surfaces
276
proceeded in a similar fashion for the first hour of UV illumination. However, the reaction
277
rate on the TiO2 NPs slowed down afterwards. After 5 hours of UV illumination, only half of
278
the DOP molecules were decomposed. On the other hand, the DOP molecules on the TiO2
279
NTs kept being decomposed even after 5 hours of illumination. Despite a larger surface area,
280
the NP film seems to exhibit a lower photocatalytic reactivity than the NT film. Because both
281
of the NTs and NPs were crystalized in the anatase phase, the only difference is their
282
nanostructure. As described above, we believe that the oxygen radicals are favorably formed
283
in an oxygen atmosphere to promote the decomposition of organic materials. In the case of
284
the NT film, the straight pores are oriented perpendicular to the film surface, which may
285
facilitate the penetration of oxygen and the desorption of the decomposed products, and thus
286
promote the decomposition of organic materials. Furthermore, the longer charge diffusion
287
length in the TiO2 NTs most probably reduces the possibility of charge recombination at the
288
interface, which leads to highly efficient photodecomposition.25 A more thorough
289
investigation will be needed to determine which factors play a more important role in
290
improving photocatalytic reactivity.
291 292
Conclusions
293
In this study we have investigated in-situ the photodecomposition process of organic
294
materials on a TiO2 NT film surface using a MIR-IRAS method. To carry out this study, we
295
fabricated special Si MIR prisms with well-aligned TiO2 NT films formed on a Si prism
296
surface. To clarify the atmospheric dependence of the photocatalytic reaction, we examined
297
the spectral changes of the TiO2 NT film surface induced by UV illumination under four
298
different types of atmospheres which were dry air, humidified air, pure N2 gas, and
299
humidified N2 gas. Our IRAS data clearly demonstrated that oxygen gas plays an important
300
role in promoting the photocatalytic decomposition of organic materials. We confirmed that
301
the water molecules adsorbed on the TiO2 surface decompose faster than the organic
302
materials on the surface. In an oxygen-containing atmosphere, the surface Ti-OH species
303
were preferentially generated on the TiO2 surface after removal of the surface contaminants
304
and water. Finally, we found that the TiO2 NT films are superior in photo-oxidation reactivity
over conventional TiO2 NP-based films. We suggested that the TiO2 NT film has a straight
306
path for oxygen adsorption and the release of byproducts and reactive radicals, leading to an
307
enhanced photocatalytic effect.
308 309
Acknowledgments
310
The authors would like to thank Taka-aki Miya and Dr. Ryota Kojima for their technical
311
assistance with the experiments. This research has been partially carried out at the
312
Fundamental Technology Center, Research Institute of Electrical Communication, Tohoku
313
University. This work was partially supported by the CREST program “Development of
314
Atomic or Molecular Two-Dimensional Functional Films and Creation of Fundamental
315
Technologies for Their Applications” (Grant JPMJCR14F3) of the Japan Science and
316
Technology Agency (JST). It was also partially supported by JSPS KAKENHI Grant Number
317 18K14120. 318 319 References 320
1. A. Fujishima, and K. Honda, Electrochemical Photolysis of Water at a Semiconductor
321
Electrode. Nature, 238, 37-38 (1972).
322
2. R. Wang, K. Hashimoto, A. Fujishima, M. Chikuni, E. Kojima, A. Kitamura, M.
323
Shimohigoshi, and T. Watanabe, Light-induced amphiphilic surfaces. Nature, 388, 431–
324
432 (1997).
325
3. X. Quan, S. Yang, X. Ruan, and H. Zhao, Preparation of Titania Nanotubes and Their
326
Environmental Applications as Electrode. Environ. Sci. Technol., 39 (10), 3770–3775
327
(2005).
328
4. C. Liu, A. Zhang, A. Y. Si, D. N. Pei, and H. Q. Yu, Photochemical Anti-Fouling
329
Approach for Electrochemical Pollutant Degradation on Facet-Tailored TiO2 Single
330
Crystals. Environ. Sci. Technol., 51 (19), 11326–11335 (2017).
331
5. J. F. Montoya, I. Ivanova, R. Dillert, D. W. Bahnemann, P. Salvador, and J. Peral,
332
Catalytic Role of Surface Oxygens in TiO2 Photooxidation Reactions: Aqueous Benzene
333
Photooxidation with Ti18O2 under Anaerobic Conditions. J. Phys. Chem. Lett., 4,
334
1415−1422 (2013).
335
6. A. R. Almeida, J. A. Moulijn, and G. Mul, In Situ ATR-FTIR Study on the Selective
336
Photo-oxidation of Cyclohexane over Anatase TiO2. J. Phys. Chem. C, 112, 1552-1561
337
(2008).
338
7. S. P. Albu, A. Ghicov, J. M. Macak, R. Hahn, and P. Schmuki, Self-Organized,
Free-339
Standing TiO2 Nanotube Membrane for Flow-through Photocatalytic Applications. Nano
Lett., 7(5), 1286-1289 (2007).
341
8. T. Inoue, A. Fujishima, S. Konishi, and K. Honda, Photoelectrocatalytic reduction of
342
carbon dioxide in aqueous suspensions of semiconductor powders. Nature, 277, 637-638
343
(1979).
344
9. M. Salmasi, S. Fatemi, and Y. Mortazavi, Fabrication of promoted TiO2 nanotubes with
345
superior catalytic activity against TiO2 nanoparticles as the catalyst of oxi-desulfurization
346
process. J. Ind. Eng. Chem., 39, 66-76 (2016).
347
10. N. Liu, C. Schneider, D. Freitag, U. Venkatesan,V. R. R. Marthala, M. Hartmann, B.
348
Winter, E. Spiecker, A. Osvet, E. M. Zolnhofer, K. Meyer, T. Nakajima, X. Zhou, and P.
349
Schmuki, Hydrogenated Anatase: Strong Photocatalytic Dihydrogen Evolutionwithout the
350
Use of a Co-Catalyst. Angew. Chem., 126, 14425 –14429 (2014).
351
11. W. Liu, J. Gao, F. Zhang, and G. Zhang, Preparation of TiO2 Nanotubes and Their
352
Photocatalytic Properties in Degradation Methylcyclohexane. Mater. Trans., 48(9),
2464-353
2466 (2007).
354
12. G. K. Ramesha, J. F. Brennecke, and P. V. Kamat, Origin of Catalytic Effect in the
355
Reduction of CO2 at Nanostructured TiO2 Films. ACS Catal., 4(9), 3249–3254 (2014).
356
13. Y. Yan, M. Han, A Konkin, T. Koppe, D. Wang, T. Andreu, G. Chen, U. Vetter, J. R.
357
Morante, and P. Schaaf, Slightly hydrogenated TiO2 with enhanced photocatalytic
358
performance. J. Mater. Chem. A, 2, 12708-12716 (2014).
359
14. R. Kojima, Y. Kimura, T. Ma, K. Ishibashi, D. Tadaki, R. A. Rosenberg, A. Hirano-Iwata,
360
and M. Niwano, Fabrication and Characterization of Front-Illuminated Dye-Sensitized
361
Solar Cells with Anodic Titanium Oxide Nanotubes.
362
J. Electrochem. Soc., 164(2) H78-H84 (2017).
363
15. O.Legrini, E.Oliveros, A.M.Braun, Photochemical processes for water treatment. Chem.
364
Rev., 93, 671-698 (1993).
365
16. A. Mills, and S. L. Hunte, An overview of semiconductor photocatalysis. J. Photochem.
366
Photobiol. A, 108(1), 1-35 (1997).
367
17. M. A. Henderson, A Surface Science Perspective on Photocatalysis. Surf. Sci. Rep., 66,
368
185-297 (2011).
369
18. K. Miyamoto, K. Ishibashi, K. Hiroi, Y. Kimura, H. Ishii, and M. Niwano, Label-free
detection and classification of DNA by surface vibration spectroscopy in conjugation
371
with electrophoresis. Appl. Phys. Letts., 86, 053902 (2005).
372
19. T. Ma, J. Zhang, R. Kojima, D. Tadaki, Y. Kimura, and M. Niwano, Investigation of TiO2
373
Surface Modification with [6,6]-Phenyl-C61-butyric Acid for Titania/Polymer Hybrid
374
Solar Cells. Jpn. J. Appl. Phys., 52, 112301 (2013).
375
20. T. Ma, M. Cagnoni, D. Tadaki, A. Hirano-Iwata, and M. Niwano, Annealing-induced
376
chemical and structural changes in tri-iodide and mixed-halide organometal perovskite
377
layers. J. Mater. Chem. A, 3, 14195-14201 (2015).
378
21. T. Luttrell, S. Halpegamage, J. Tao, A. Kramer, E. Sutter, and M. Batzill, Why is anatase
379
a better photocatalyst than rutile? - Model studies on epitaxial TiO2 films. Sci. Rep., 4,
380
4043 (2014).
381
22. T. Ma, R. Kojima, D. Tadaki, J. Zhang, Y. Kimura, and M. Niwano, Fabrication of
382
polymer/TiO2-nanotube-based hybrid structures using a solvent-vapor-assisted coating
383
method. Mater. Res. Express, 1, 045048 (2014).
384
23. S. Hosseinpour, F. Tang, F. Wang, R. A. Livingstone, S. J. Schlegel, T. Ohto, M. Bonn, Y.
385
Nagata, and E. H. G. Backus, Chemisorbed and Physisorbed Water at the TiO2/Water
386
Interface. J. Phys. Chem. Lett., 8(10), 2195-2199 (2017).
387
24. N. Sakai, A. Fujishima, T. Watanabe and K. Hashimoto, J. Phys. Chem. B 107, (2003)
388
1028–1035.
389
25. J. R. Jennings, A. Ghicov, L. M. Peter, P. Schmuki, and A. B. Walker, Dye-Sensitized
390
Solar Cells Based on Oriented TiO2 Nanotube Arrays: Transport, Trapping, and Transfer
391
of Electrons. J. Am. Chem. Soc., 130, 13364–13372 (2008).
392 393 394
Tables
395
Table I. Parameters used for the calculations.
396
Atmosphere 𝜃DOP0 𝜃water0 𝑘dDOP 𝑘dwater 𝑘adwater
Dried air 1 0.2 0.005 0.05 0.005 Humidified air 1 1 0.005 0.05 0.05 Pure N2 1 0.5 0.002 0.02 0.0005 Humidified N2 1 1 0.002 0.02 0.005 397 398 399
Figure Captions
400
Fig. 1. Experimental setup for the MIR-IRAS measurement.
401
Fig. 2. Fabrication process of the Si prism with TiO2 NTs.
402
Fig. 3. (a) Top view and (b) cross-sectional view of SEM images of the fabricated TiO2 NT
403
film. (c) Measured (black) and calculated (red) XRD patterns of TiO2 NTs after
post-404
annealing.
405
Fig. 4. IRAS spectrum of the DOP deposited on the TiO2 NTs after UV illumination in dry
406
air. A typical infrared spectrum of DOP on the TiO2 NTs is shown at the bottom of the
407
figure. The inset shows the molecular structure of DOP.
408
Fig. 5. IRAS spectra of DOP on the TiO2 NTs during UV illumination in (a) dry air, (b)
409
humidified air, (c) N2 and (d) humidified N2 atmosphere. The reference of these spectra
410
is the spectrum of DOP on the TiO2 NTs before UV illumination.
411
Fig. 6. Time-evolution of the DOP residue ratio in which the calculation is based on the
412
peak intensities at 2960 cm-1 in four types of atmospheres: dry air, humidified air, N2 and
413
humidified N2.
414
Fig. 7. Temporal changes in the absorbance of the C-H stretching vibrational peak at 2960
415
cm-1 and of the O-H stretching vibrational peak at 3400 cm-1 for the four different types
416
of atmospheres: dry air, humidified air (a), N2 and humidified N2 (b). The absorbance
417
was normalized to that of the corresponding peaks of the as-deposited DOP prior to UV
418
illumination.
419
Fig. 8. Schematic of a simple model for simulating the time evolution of the surface
420
coverage of water and DOP.
421
Fig. 9. Calculated time evolution of the surface coverage of water and DOP obtained for the
422
different types of atmospheres.
423
Fig. 10. Top and side views of the SEM images of the TiO2 NP film.
424
Fig. 11. IRAS spectra of DOP on the TiO2 NP film during UV illumination in dry air. The
425
reference of these spectra is the spectrum of DOP on the as-formed TiO2 NP film before
426
UV illumination.
427
Fig. 12. Time-evolution of DOP residue ratios on the TiO2 NT and NP films in dry air. The
428
residue ratios were calculated based on the peak intensity at 2960 cm-1.