Influence of Social Institutions on Inequality
in China
著者
Uchimura Hiroko
権利
Copyrights 日本貿易振興機構(ジェトロ)アジア
経済研究所 / Institute of Developing
Economies, Japan External Trade Organization
(IDE-JETRO) http://www.ide.go.jp
journal or
publication title
IDE Discussion Paper
volume
26
year
2005-04-01
INSTITUTE OF DEVELOPING ECONOMIES
Discussion Papers are preliminary materials circulated
to stimulate discussions and critical comments
DISCUSSION PAPER No. 26
Influence of Social Institutions on Inequality in China
Hiroko UCHIMURA
April 2005
Abstract
This study analyses the impact of changes in social institutions, i.e. in the informal and formal social security system, on income inequality in China. This study uses an inequality decomposition analysis approach comparing household survey data for 1988 with 1995. Three main results emerge from the analysis: first, it finds that the family based social security is losing its importance mainly through the changes in employment pattern in a household. This change contributes to rising income inequality. Second, the study shows that the introduction of new formal social security system helped to equalise the distribution of retired household members’ income in urban areas in 1995. Third, however, these changes have only benefited a restricted number of persons. Benefits for rural migrants are low and most of the rural population has still no access to the new system.
Keywords:
China, Income Inequality, Social Institutions, Family, Social SecurityThe Institute of Developing Economies (IDE) is a semigovernmental,
nonpartisan, nonprofit research institute, founded in 1958. The Institute
merged with the Japan External Trade Organization (JETRO) on July 1, 1998.
The Institute conducts basic and comprehensive studies on economic and
related affairs in all developing countries and regions, including Asia, Middle
East, Africa, Latin America, Oceania, and East Europe.
The views expressed in this publication are those of the author(s). Publication does not imply endorsement by the Institute of Developing Economies of any of the views expressed.
INSTITUTE OF DEVELOPING ECONOMIES (IDE), JETRO 3-2-2, WAKABA,MIHAMA-KU,CHIBA-SHI
CHIBA 261-8545, JAPAN
Influence of Social Institutions on Inequality in China
Hiroko UCHIMURA
∗Abstract
This study analyses the impact of changes in social institutions, i.e. in the informal and formal social security system, on income inequality in China. This study uses an inequality decomposition analysis approach comparing household survey data for 1988 with 1995. Three main results emerge from the analysis: first, it finds that the family based social security is losing its importance mainly through the changes in employment pattern in a household. This change contributes to rising income inequality. Second, the study shows that the introduction of new formal social security system helped to equalise the distribution of retired household members’ income in urban areas in 1995. Third, however, these changes have only benefited a restricted number of persons. Benefits for rural migrants are low and most of the rural population has still no access to the new system.
∗
1. INTORODUCTION
Many developing economies, even those that have achieved substantial economic growth, have actually been experiencing a widening gap in incomes. Moreover, such a gap does not tend to narrow. This situation makes people dissatisfied and may cause social instability. Among developing economies, China’s economic growth has been highly impressive, especially since the 1990s. China achieved over 9% growth per year in the 1990s, and is maintaining this substantial economic performance. This economic success was brought about by the economic reforms that started in 1978 and accelerated after the Southern Tour Lectures by Deng Xiaoping in 1992. At the same time, the reforms have had a significant impact on income distribution, and have led to a rapid increase in income inequality in China.
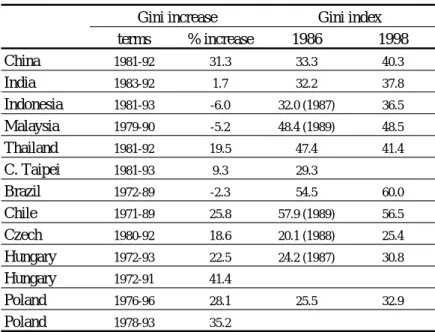
Table 1 shows that, although its inequality level is not the worst among developing economies at the moment, this rapid increase calls our attention to China. The Chinese Government has already noticed this threat to the economy and to social stability, and these concerns have been raised in the National People’s Congress in recent years.
TABLE 1
INEQUALITY IN DEVELOPING ECONOMIES (GINI INDEX)
terms % increase 1986 1998 China 1981-92 31.3 33.3 40.3 India 1983-92 1.7 32.2 37.8 Indonesia 1981-93 -6.0 32.0 (1987) 36.5 Malaysia 1979-90 -5.2 48.4 (1989) 48.5 Thailand 1981-92 19.5 47.4 41.4 C. Taipei 1981-93 9.3 29.3 Brazil 1972-89 -2.3 54.5 60.0 Chile 1971-89 25.8 57.9 (1989) 56.5 Czech 1980-92 18.6 20.1 (1988) 25.4 Hungary 1972-93 22.5 24.2 (1987) 30.8 Hungary 1972-91 41.4 Poland 1976-96 28.1 25.5 32.9 Poland 1978-93 35.2
Gini increase Gini index
Source: Deininger and Squire Data Set, World Bank,
http://www.worldbank.org/research/growh/dddeisqu.htm World Development Report 2000/2001, World Bank.
The economic reforms first concentrated on rural areas, and since 1984 the focus has been shifted to urban areas. The reforms transformed the economic system toward a market-oriented economy and opened it up to the world. Since 1992, the reforms have been accelerated to increase the role of the market mechanism. These reforms brought a strong impetus to
China's economic growth, and brought some people and regions a great opportunity to participate in economic activities and enjoy the fruits of success. Meanwhile, the reforms caused a significant change in the income distribution in China. Table 1 and Table 2 show that the income inequality in China increased almost constantly as the economic reforms were carried out. In addition, the level of inequality has been substantially higher in rural areas than in urban areas (Table 2).
TABLE 2
INEQUALITY (GINI INDEX) IN URBAN AND RURAL CHINA Source: Deininger and Squire Data Set, World Bank,
eisqu.htm urban rural 1978 21.20 1979 1980 23.40 1981 16.10 23.90 1982 12.10 23.20 1983 15.80 24.60 1984 16.80 25.80 1985 15.80 26.40 1986 15.80 1987 15.80 1988 16.90 1989 17.80 1990 18.00 29.40 1991 17.50 30.70 http://www.worldbank.org/research/growh/ddd
This increase in income inequality in China has been examined focusing on three main factors: income sources, spatial differences and individual characteristics. In rural areas, the wage income is the important income factor of inequality (Khan and Riskin (2001, Chapter 3), Knight and Song (2001), Tsui (1998)). They also point out that the tax system is regressive in rural areas. Zhang (2001) and Hussain, Lanjouw, and Stern (1994) also examine the relation between income sources and inequality in rural areas; then, find that non-farming incomes significantly contribute to the inequality. Hussain, Lanjouw, and Stern (1994) also examine the case for urban areas, and point that bonus and irregular incomes are important factors in urban areas. In addition, they analysed the spatial inequality, inter- or intra-provincial inequality, and find that the predominant contributor to the total inequality is the intra-provincial inequality in both urban and rural areas. Kanbur and Zhang (1999) examined regional inequality by assessing the relative contribution of urban-rural disparity and inland-coastal disparity to the overall regional inequality, and pointed that the former contribution to regional inequality exceeds the latter, but the latter increases significantly. Regarding the urban-rural disparity, Khan and Riskin
(2001, Chapter 3) point out that the level of urban-rural inequality is extremely high in China, but its rising trend became moderate in the middle of 1990s. Gustafsson and Li (2001) also point the importance of urban-rural inequality as well as within inequality in urban and rural areas. They also examined the relation of individual characteristics and income inequality, and find education is an importance factor. Gustafsson and Li (2000) examined gender gap focusing on individual characteristics. Then they find that the higher education level, the smaller gender gaps. Kung and Lee (2001) examined rural inequality also in the context of individual characteristics, and points that non-farm employment opportunity contributes to rising inequality. Knight and Song (2001) also examined both of rural and urban inequalities relating with the individual characteristics. According to their findings, a person who is male gender, Han nationality, and has more education gains more beneficiaries in rural areas. In urban areas, wage became to more relate to worker productivity, whereas there were the labour market discrimination and segmentation on gender etc.
All these studies examine the influence of the reforms on inequality via changing
impact of these changes in social institutions on income inequality in
the potential influences of
income sources, increasing spatial differences, or labour characteristics. While all these factors are of importance, the role of changing social institutions induced by the reforms has not received much attention so far1. This is surprising as the role of the family as the basis of the informal system has dramatically changed, as well as the formal social systems. Some of these changes are endogenous results of the reforms themselves, while other changes have been exogenously induced, such as the changing family composition. This study regards social institutions as being composed of informal family social security and formal social security systems, and examines changes in the social institutions and their impacts on rising income inequality in China. With this, the study contributes to the discussion of important determinants of inequality in China.
To analyse the
China, this study uses an inequality decomposition analysis approach, comparing the data set based on the household survey data for 1988 with 1995. As 1992 was a decisive year for accelerating the economic reforms, comparing these two periods will show meaningful changes in social institutions and their effects on income inequality. In addition, this study assesses the current social security reforms relating to inequality issues. In this context, this will provide meaningful implications for rising inequality in the present China.
The next section explains social security in China and
changes in social institutions on income inequality. Section 3 explains methodology and the data. Section 4 analyses the changes in social institutions and income inequality based on the
1
Zhao (2001) refers to the relation between institutional changes and inequality. He classifies the institutional changes as order changes, such as household responsibility system in rural areas, and disorder changes, such as rent-seeking activities, and describes their effects on inequality.
empirical results. In addition, this paper discusses the prospects of social security and inequality focusing on the social security system reforms in Section 5, and concludes with Section 6.
2. SOCIAL SECURITY IN CHINA
The social security system began to be reformed substantially in the early 1990s, in
.1) Provision of Social Security in Urban and Rural Areas
cial security: the state, the market, ember
urity system in the early 1990s took place,
urban areas, social security has been insufficient in rural areas. The main social security measure was composed of five guarantees (minimum guarantees for people
order to promote the reform of state owned enterprises (SOEs) and to establish a social security system suited to the new economic system. This formal social security system and its reform targeted only urban workers; therefore, most of the rural people still cannot access the formal social security system.
2
There exist four main institutions that provide so
m -based organisations, and private households (Jutting, 1999). In China, the providers of social security differ between urban and rural areas.
Before the substantial reforms in the social sec
SOEs had a responsibility to provide social security through social security measures for their employees and their families. The government provided the social security for workers at governmental institutions in urban areas2. Therefore, the state was the major provider of social security for workers and their families in urban areas. With the economic reforms, the responsibility for social security became a considerable burden for SOEs. In addition, the aging of the SOEs' employees raised the supporting ratio of retired people to active workers, which made the burden more serious. These factors caused delayed payment or non-payment of pension benefits for some pensioners and widened the benefits gap among pensioners. In this context, the government started to reform the social security system by shifting the responsibility for social security from the SOEs and setting up a new formal social security system. The target was limited to SOE workers in the initial phase of the reform, whereas the proportion of SOEs’ workers has been decreasing along with the economic reforms. Workers in private enterprises, flexible workers (informal workers) or self-employed people were increasingly targeted after the initial steps of reform had been undertaken. These situations suggest that the role of private households has become more important for supplementing social security in urban areas.
Compared with
2
The social security system mentioned here is the system in the period from the mid 1960s up to the start of the reforms in the early 1990s.
unable to work and those with no income), health insurance (Rural Cooperative Medical System, RCMS), and social relief for poverty caused by natural disasters. Most of the social security measures were based on the concept of people’s communes, which were the base for agricultural production, administration, and social services in rural areas. The systems of social services in rural areas were basically those of mutual security and self-help. Thus, social security in rural areas was based on member-based organisations and private households. The economic reforms moved the production base from the collectives to the household by initiating the household responsibility system. This brought about the disbandment of the communes in 1980s, which weakened social security functions in rural areas. For instance, the RCMS scheme was weakened in most of the rural communities after the 1980s, and health insurance coverage fell to 9.5% of the rural population in 1998 (Liu, 2004). Recently, the government has begun to pay attention to social security in rural areas. However, rural social security still lags far behind the reforms in urban areas. The pension insurance system instituted in the early 1990s in rural areas is on a voluntary basis, and is aimed at establishing a mechanism of self-help security and savings accumulation. In sum, a private household in a rural area needs to take more responsibility for social security than one in an urban area, and in rural areas the responsibility has become greater after the reforms.
2.2) Potential Influence of Changes in Social Institutions on Income Inequality
The formal social security system is the most important institution for social security in ocial security in
e Informal Family Based Social Security
The economic reforms and demographic changes, such as aging, alter informal family wing elements: age distribution,
Aging of the population has been altering the age structure in China. Increasing producing a growing number of elderly people, a situation that will have a urban areas, whereas the private household takes greater responsibility for s
rural areas. Following the reforms, private households appear to have become more important for social security in both urban and rural areas. The following sections describe the potential influences of changes in informal family social security and formal social security system on income inequality.
2.2.1) Changes in th
social security in China. The changes are seen in the follo
household type, and household employment patterns. In the following paragraphs, we explain the potential influences of changes in these elements on income inequality.
Age Distribution
longevity has been
disequalising impact on distribution of income. The increase in the number of elderly people may raise the dependency ratio in a household, which would weaken the income-sharing in a
household. In addition, if the replacement ratio of pension insurance or asset accumulation is not high enough, the relative income of elderly people could be low due to the retirement. In this context, aging could potentially raise the proportion of low income group and the income gap between the group and others, which would tend to increase income inequality.
Household Type
The average household size has been decreasing constantly in both urban and rural se in household size will have a disequalising effect due to the weakening of
ttern
The economic reforms have had a significant impact on the employment status of efore the reforms, job placement was controlled by the government and,
In this section, we focus on pension insurance in social security, which is one of the r elderly people (over 60) for the analysis,
areas. This decrea
income-sharing in a household. In addition, household types might have been standardised through the one-child policy3 and changes in the co-residence pattern. The effect of this standardisation on income inequality is not clear. If the income distribution of this group has been substantially equalised, this standardisation will have an equalising impact on the overall inequality change (within-group effect). If the relative income of this group is far enough above or below the overall mean, this standardisation will increase total income inequality (between-group effect).
Employment Pa
household members. B
in general, people were not faced with unemployment. Along with the economic reforms, however, the government gradually began to reform the employment system as well. It was after the 1990s that employment reform was explicitly aimed at creating and promoting the labour market in China. This has altered the employment pattern in households. The number of earners in a household declined after the reforms, weakening the income-sharing in households. The increase in people living in households with few earners will produce a disequalising impetus.
2.2.2) Changes in the Formal Social Security System
most crucial issues in modern China. We shall conside
because they are the major group that is directly affected by pension insurance reform. We first analyse changes in the income structure, and investigate the impact of these changes on income inequality.
3
The one-child policy started in 1979, with the aim of controlling the population by reducing the birth rate.
Urban Areas
ms in the social security system as well as changes in household type may affect
ural Areas
al areas, self-help or mutual security in the collectives is the major form of social curity
3. METHODOLOGY AND DATA
.1) Methodology: Decomposition Analysis
is by population group is to separate total income Refor
the income structure and income distribution of elderly people. The income of retired household members may become a more important source of income than that earned by other members of a household, due to the decline in the number of earners in a household. The period from 1988 to 1995 was the initial phase of social security reform. Therefore, if the initial phase helped to resolve the inadequacy of the social security system, seen in problems such as non-payment of pension benefits, it may have had an equalising effect on the distribution of retirees’ income.
R
In rur
se . As mentioned earlier, self-help (based on a private household) became more important after the economic reforms due to the weakening of social security based on the collectives. Even after the reforms in the social security system started in the early 1990s, the reforms mainly focused on workers in urban areas, and tended to leave rural areas untouched. In this context, the income structure of the elderly in rural areas might have been directly affected by the changes in the economic system as well as changes in household type. Through the penetration of the market economy into rural areas, off-farm wage or other cash incomes may have become more important. If the distributions of these income sources become more disequalising, the change in income structure will have a substantial disequalising impact on overall income inequality.
3
The inequality decomposition analys
inequality into components of inequality between the chosen sub-population groups and the within-group inequality. Since we are interested in the impact of the changes in social institutions over years on income inequality, we focus on a decomposition of the change in inequality over a period of time, i.e. a dynamic decomposition. Changes in income inequality can isolate the effects of a change in inequality between the sub-groups from a change in inequality within the groups. A change in between-group inequality can be further segregated into a change caused by a change in the size of the sub-groups (allocation effect), and a change in inequality caused by a change in the relative mean incomes between the sub-groups (income effect). In sum, the total inequality change can be decomposed into three parts: first, a change in inequality within the sub-groups; second, a change in the allocation of the sub-groups; and, third, a change in the relative income between the sub-groups. The last two changes comprise the
between-group inequality. For example, the impact of changes in age distribution on income inequality over a period can be quantified by a change in the number of people in each age group, a change in the relative income of the each age group, and a change in the inequality in the each age group over the period.
The inequality index used here is the Mean Logarithmic Deviation (MLD), which is usual for population group decomposition:
(1)
∑
⎟ ⎠ ⎞ ⎜ ⎝ ⎛ = = i yi n MLD I 1 log µ ,n
: number of income unitsµ
: mean incomei
y : income of unit i .
he dynamic decomposition between two years, t and t+1, is as follows:
) T I f I k k∆ = ∆
∑
(2[
]
∑
∑
∆ + − ∆ + k k k k k k f f I λ log(λ )∑
− ∆ + (vk fk) logµ
kwhere
∆
is the difference operator, λ is the mean income of group relative to the mean kati
The sub-population group decomposition method was developed by Bourguignon 979),
aggregate inequality by the
k
overall income, and the over-bar represents an average of base (t) and the next period (t+1) values. The population share of group k is denoted by fk and the income share of group k is denoted by vk. The first term shows the within-inequalit effect, the second and the third terms are the alloc on effect, resulting from changes in the numbers in different groups, and the forth term captures the income effect, resulting from changes in the relative incomes of different groups. The between-groups inequality is composed of the allocation effect and the income effect.
y
(1 Mookherjee and Shorrocks (1982), and Shorrocks (1984). The other decomposition analysis is to decompose the
contributions of income sources. The aggregate inequality can be expressed as the sum of each income factor contribution.
(3) I =
∑
Sf f
where depends on income sources . Income source factor provides a disequalising effect if . f S f f
0
>
fS
Define (4) I S s f f ≡ ,then The inequality index which is usual for income factor decomposition is the
squared coefficient of variance (SCV).
. 1 =
∑
sf f (5)∑
⎥⎦ ⎤ ⎢⎣ ⎡ − = = i i y n SCV I (12 ) ( µ)2 1 In this case, (6) Sf =sfI = ρfχf I *Ifwhere ρf is the correlation between component fand total income, and χ is f ’s factor share. f The dynamic decomposition between a given two years is as follows:
(7) ∆ = − =
∑
∆ =∑
∆[
]
+ f f f f f f t t I S I I I I 1 ρ χ * .The decomposition formulae of SCV were first developed by Mookherjee and Shorrocks (1982) and Shorrocks (1982, 1983). Jenkins (1995) further developed the methodology and applied both sub-population group decomposition and income factor decomposition for a study of the United Kingdom.
3.2) Data
Household survey data for 1988 and 1995 are used in this analysis. These data are based on a large household survey, conducted by the Institute of Economics, Chinese Academy of Social Science, in 1989 and 1996 (Griffin and Zhao, 1993; Riskin et al., 2000). The data are derived from large samples (about 65,000 rural households and 35,000 urban households) drawn by the State Statistical Bureau.
The dataset used here is prepared from the household survey data to meet the purpose of this study. It consists of ten provinces, representing various regions in China. The provinces representative of the north are Liaoning and Shanxi; those of the eastern coastal region, Jiangsu and Guangdong; those of the interior, Anhui, Henan and Hubei; those of the west, Gansu and Yunnan; with Beijing representing the three large provincial-level municipalities.
The estimate of income inequality in this study is based on equivalent disposal income per household member4. The disposal income includes cash income from working household members, income from retired members5, income from private/individual enterprises, and income from property in urban households. Disposal income in rural households includes income from wages etc, household income from township, village, collective and other types of enterprises, cash income from farming and industrial or subsidiary activities, gross value of self-consumption of farm products, income from property, net transfer from/to collective and state entities, and miscellaneous incomes. The number of urban samples in the dataset is 27,286 in 1988 and 20,310 in 1995, and that of rural samples is 45,911 in 1988 and 34,120 in 1995.
4
Equivalent disposal income per household member is the household income adjusted for household size to reflect economies of scale within the household. The household equivalised disposal income is attributed equally to all individuals in a household, which assumes that all individuals in a household have equal access to the total household income. This study used the standard equivalent scale: 0.5. Details of equivalent disposal income are in Burniaux et al. (1998).
5
4. RESULTS
4.1) Informal Family Social Security
In this section, we first examine changes in a household as informal family social security and, second, their impacts on rising inequality over the period from 1988 to 19956, based on the results of sub-group decomposition analysis as well as the details of data from each sub-group, namely population share of the sub-groups, their relative incomes, and sub-group inequality (Table A1, A2, A3).
TABLE 3
SUB-GROUP DECOMPOSITION OF INEQUALITY CHANGES BETWEEN 1988 AND 1995
within
total allocation income 1988 1995
rural 7.1 2.9 4.2 92.9 0.18 0.20 urban -1.1 0.0 -1.1 101.1 0.08 0.12 rural 0.7 0.7 0.0 99.3 0.18 0.20 urban -2.8 -0.5 -2.3 102.8 0.08 0.12 rural 16.4 17.1 -0.7 83.6 0.18 0.20 urban 9.9 2.0 7.9 90.1 0.08 0.12 Employment pattern
% contribution to overall inequality increase Overall inequality (MLD) between Age Household type Notes: sub-groups Age: 0-15, 16-59, 60+
Household type: 1 adult, 1 adult with children, 2 adults, 2 adults with children, +3 adults, +3 adults with children
Employment pattern: 0 earner, 1 earner, 2 earners, +3 earners
Table 3 summarises the results of sub-group decomposition of income inequality change between 1988 and 1995. The contribution of within-inequality is caused by a change in inequality in the sub-groups, and that of between-inequality is caused by a change in inequality between the sub-groups. In the between-inequality contribution, the allocation effect is caused by a change in the size of the sub-groups, and the income effect is caused by a change in relative mean incomes between the sub-groups.
6
Khan and Riskin (1998, 2001, Chapter 3) measured income inequality by Gini Index, a general inequality measurement, using the data set drawing from the same household survey used in this study, and per capita household income as an income unit. The income inequality measured by Gini Index in the studies, is 0.338 in 1988 and 0.416 in 1995 in rural areas, 0.233 in 1988 and 0.332 in 1995 in urban areas, and 0.382 in 1988 and 0.452 in 1995 in China as a whole.
First, the contribution of within-inequality exceeds that of between-inequality in the overall inequality increase from 1988 to 1995 in all categories of the decompositions. We will return to analyse this later.
Second, the between-inequality contribution to the overall inequality increase is largest for the employment pattern decompositions both in urban and rural areas (9.9% in urban areas, and 16.4% in rural areas). In the decompositions, the allocation effect (change in the sizes of the sub-groups) is high in rural areas (17.1%), and the income effect (change in relative mean incomes between sub-groups) is high in urban areas (7.9%).
Looking at the population share of the sub-groups in rural areas (Table A3 in Appendix), the proportion of groups with fewer-earners increased between 1988 and 1995. This produced the high contribution of allocation effect to the overall inequality increase over the period. In urban areas, the groups with large numbers of earners improved their mean income position relative to the overall mean (relative incomes in Table A3). This produces the high contribution of income effect to overall inequality increase in urban areas.
Increasing the proportion of people in fewer-earner households has a significant impact on income inequality between households in rural areas. The increase in the relative incomes of households with more earners has a more significant impact on income inequality in urban areas. These results imply that changes in household employment patterns led to weaken income-sharing ability of household.
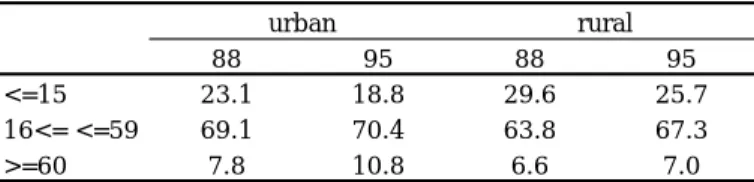
Third, the proportion of older people increased in urban areas but not significantly in rural areas (Table A1 in the Appendix). This suggests that aging had already emerged as a factor in urban areas, but not obviously in rural areas, over the period from 1988 to 1995. In addition, in urban areas, the mean income of the older group fell relative to the overall mean (relative incomes in Table A1), which means that the economic status of households with older people declined during the period from 1988 to 1995. This implies that the aging of the population will further weaken family social security.
Finally, in all categories of the decompositions, the high contribution of within-inequality to overall within-inequality increase arose from the within-inequality increase in major groups in each decomposition category. The major age group is the working-age group (16-59), in household type, the two adults with children group and in employment pattern the two earner group (Table A1, A2, A3). Increasing inequality in these groups imply that job distribution became more uneven among people, and the earnings gap widened over the period from 1988 to 1995.
To sum up, the increase in the proportion of people in fewer-earner households leads to the reduction of income-sharing ability of households. Informal family social security thus is weakened, mainly through the changes in household employment pattern over the period from 1988 to 1995.
4.2) Social Security System Reform
As noted in Section 2, we focus on the older people7 (over 60 years old) in this section because they are the group that has been directly affected by the reforms of the social security system (pension insurance). We analyse first the changes in income structure, and second the effects of the changes on the inequality increase over the period from 1988 to 1995.
Urban Areas
TABLE 4
INCOME SOURCE DECOMPOSITION IN URBAN AREAS, BETWEEN 1988 AND 1995
Cash income of working members
Income from the retired members Income from private/individual enterprises Income from property Miscellaneous income 1988 0.49 0.37 66.20 19.19 1.42 1995 0.94 0.26 65.93 8.42 1.92 Absolute contribution of
an income factor to total inequality (Sf) 1988 1995 0.03 0.07 0.05 0.05 0.02 0.00 0.00 0.00 0.02 0.01 % proportionate factor contribution to total inequality (sf) 1988 1995 23.5 53.2 42.5 36.8 16.4 -0.3 2.7 3.7 15.0 6.6 Correlation of each
income factor with total income 1988 1995 0.29 0.59 0.49 0.46 0.38 -0.03 0.22 0.35 0.39 0.26 1988 38.5 47.9 1.8 0.9 10.9 1995 33.8 57.7 0.4 1.3 6.8 % contribution to overall inequality change 1988-95 202.9 8.1 -84.3 8.8 -35.4 Factor inequality (SCV)
% share of each income factor
Table 4 summarises the details of income sources in urban areas. First, the major income sources are the incomes of retired household members (their share of total income is 47.9% in 1988 and 57.7% in 1995) and cash income of the working household members (38.5% in 1988 and 33.8% in 1995) in both 1988 and 1995. However, their transitions are in opposite directions: the proportion of retired household members' income to the total income increased by 10%, whereas that of the working members' income had decreased by 5% in 1995. This change in the income structure appears to reflect changes in household type: the older people living in a household with fewer earners increased, and then the importance of retirees’ income in their households increased. This suggests that the pension benefit, which is a major component of retired members' income, had become a more essential income source for older people by 1995.
7
Since we focus on the impact of changes in a household composition and the social security system on income inequality, the income used here is also the equivalent disposal income of the elder members. The equivalent disposal income reflects economies of scale within a household, and thus reflects the changes in household composition.
Second, income of working members contributed greatly to the overall inequality increase over the period from 1988 to 1995. Looking at the inequality in income of working members, there was a substantial increase between 1988 and 1995 (0.49 in 1988 and 0.94 in 1995). In addition, the correlation between this income source and the total income becomes higher. This situation made this income factor contribute the most to overall inequality increase. Third, the income of retired household members contributed positively to the overall inequality increase between 1988 and 1995, due to the increase in its share of the total income; however, the inequality in this income source decreased from 0.37 in 1988 to 0.26 in 1995. This suggests that the distribution of pension insurance benefits became more equalised in 1995.
In sum, the period from 1988 to 1995 was the initial phase of the reform of the social security system, which removes the responsibility of social security from SOEs and is instead funded by the state, enterprises, and employees. This helped to resolve the problems arising from the SOE reforms, such as non-payment of pension benefits. This improvement might have contributed to the equalisation of the distribution of pension benefits in 1995.
Rural Areas
TABLE 5
INCOME SOURCE DECOMPOSITION IN RURAL AREAS, BETWEEN 1988 AND 1995
Income from wage
HH income from township, village, collective etc (other than compensation for labour)
Cash income from farming, industrial and
subsidiary activities
Gross value of self-consumption of
farm products
Inccome from property
Net transfer from/to collective and state
entities Miscellaneous income 1988 4.97 7.44 0.53 0.14 78.41 1.00 2.85 1995 4.37 7.95 0.60 0.64 31.80 0.97 4.15 Absolute contribution of an income factor to total inequality (Sf) 1988 1995 0.05 0.18 0.01 0.02 0.07 0.16 0.04 0.05 0.00 0.00 0.00 0.00 0.02 0.01 % proportionate factor contribution to total inequality (sf) 1988 1995 25.2 44.1 3.3 4.2 38.8 38.1 20.0 11.4 0.4 0.4 0.4 0.0 12.1 1.8 Correlation of each
income factor with total income 1988 1995 0.55 0.70 0.22 0.22 0.63 0.64 0.48 0.35 0.09 0.11 -0.08 0.01 0.42 0.16 1988 8.9 2.5 36.3 46.8 0.2 -2.0 7.4 1995 19.4 4.2 48.9 25.9 0.4 -2.2 3.5 % contribution to overall inequality change 1988-95 59.8 4.7 37.8 4.4 0.4 -0.4 -6.7 Factor inequality (SCV)
% share of each income factor
Table 5 summarises the details of income sources in rural areas. Cash income from farming and industrial/ subsidiary activities was the major income source in 1988 (the factor share was 36.3% of total income) and it had increased in importance in 1995 (48.9% of total income). The income from wages was not an essential income source in 1988 (8.9% of total income), but became important in 1995 (19.4% of total income). Wage and cash incomes became more important. This change in income structure implies the penetration of the market economy had been progressing in rural areas. Looking at % contribution to overall inequality
change from 1988 to 1995, these income sources were major contributors. This suggests that the inequality increase appears to have been affected considerably by the changes in the economic system in rural areas, which might reflect the insufficiency of formal social security system in rural areas.
5. PROSPECTS OF SOCIAL SECURITY AND INEQUALITY IN CHINA
The role of informal family social security has been weakened, mainly through changes in employment patterns in households arising from the economic reforms. This has contributed to rising inequality in China. This trend might have become stronger along with the progress of the economic reforms after 1995. In this context, the formal social security system becomes more important to insure against individual and collective risks, especially for the potentially economically vulnerable. The social security system is still under reform, and the design of the reforms will substantially affect the increasing inequality in China. Below, we review the reforms focusing on pension insurance and assess them in relation to inequality issues.
After the State Council promulgated Decision on Pension Insurance System Reform for Enterprise Workers in 1991, it promulgated Decisions on the Unification of the Basic Pension Insurance for Enterprise Workers in 1997 and Regulations on Social Insurance Contributions Collection and Payment in 1999, which built up the structure of the current pension insurance system8. The Decisions and Regulations clarified that the basic pension insurance system is applicable to all kinds of enterprises and their employees, including flexible workers (informal workers), and individual workers (self-employed workers) in urban areas. This policy opens the way for workers beyond SOE employees to access the social security system.
However, the current system raises several concerns in the context of income and social disparity. First, there is still the significant gap in the coverage depending on the form of the enterprises or the employment status of workers.
Second, the government (at the local level) has implemented some measures to extend the coverage of the pension insurance system, namely setting various contribution rates and the option to participate only in individual account (second tier), or formulating special schemes for rural migrants. These are effective ways to increase coverage; however, they are also sources of social and economical stratification. Those measures may result in the segmentation of the system depending on the type of employment, contrary to the initial aim of establishing a unified system. Generally, flexible workers or rural migrants face more social and economic risks than formal workers. The current system appears not to mitigate the gap in their social and economic status, but even to aggravate it.
8
The system also involves a serious problem for rural migrants (nong min gong). Recently the government has tried to include rural migrants into the system, which could be regarded as impressive progress, because the government did not show much intention to provide social services for rural migrants previously. However, the current scheme does not fit the working style of rural migrants. Rural migrants generally do not work for long periods at the same enterprise. If the new job is in another pooling locality, they cannot keep the first tier, which means they will not have anything from the basic pension insurance (first tier) after they retire. In this case, they can just withdraw their deposits from their individual account (second tier)9. This means that although rural migrants are able to access the pension insurance system, the current scheme will not function well as pension insurance for them.
This is the issue of the portability of pension insurance. Fund pooling level, contribution rate, and benefits: these three are all connected in the current system. The government proposes to raise the fund pooling level to provincial level, but currently most of the pooling levels are still at city or county level. In addition, each municipality sets various contribution rates or formulates different schemes to encourage rural migrants to participate in the system. This might be the other obstacle for the portability of the pension insurance. This would not be a serious matter if labour mobility were not so high. However, labour mobility is increasing in China and in fact the government encourages labour mobility to reduce unemployment. The design of the reforms needs to be reconsidered to make the system function as a real pension insurance scheme for rural migrants and other mobile workers.
Another important issue is that the current system does not much consider rural people in rural areas. There are some pension insurance systems in rural areas, but they are not part of the public pension system. Social security is basically on a voluntary basis and the mechanism of self–help and savings accumulation. The coverage is very low. If we consider the large proportion of rural people in the total population and the significant social and economical disparity between rural and urban areas, this lack of a social security system in rural areas is a critical problem.
6. CONCLUSION
This study analyses the impact of changes in social institutions (informal family social security, formal social security system) on income inequality in China, comparing the data set based on household survey data for 1988 and 1995. The major findings are: first, the role of informal family social security through sharing income is losing its importance. The economic
9
They can withdraw their deposits from their individual accounts, but they cannot keep the account (second tier) as their pension insurance.
reforms led to changes in the household employment pattern, resulting in an increase in the proportion of people living in fewer-earner households both in urban and rural areas, combined with a reduction in their relative income in urban areas. The reduction of income-sharing ability of households had a significant impact on income inequality between households from 1988 to 1995. Second, changes in the formal social security system helped to equalise the distribution of retired household members' income in urban areas in 1995. This shows the potential of a further ongoing and deepened development of a formal social security system as a tool to tackle rising income inequality. Third, huge challenges remain. Currently, there exists a great variability in coverage of workers, portability is too low for mobile workers, and rural people are still, mostly, left out of the system. An important step forward will be to harmonise the various schemes between municipalities and to raise the pooling level. In addition, including non-farming workers into the new system will be another important step to allow rural people to participate in it.
Another critical issue of pension insurance is an aging population. Aging had already emerged as a factor in urban areas in 1995. Not only urban people, but a large rural people who are more vulnerable economically will become part of the old generation in the near future. This will lead to a question of sustainability on the aging population and the pension insurance system. In this context, extending coverage would be essential to make the system more meaningful and stable.
REFERENCES
Bourguignon, Francois, “Decomposable Income Inequality Measures.” Econometrica 47, 4:901-920, July 1979.
Burniaux, Jean-Marc, Dang, Thai-Thanh, Fore, Douglas, Forster, Michael. d’ Ercole, Marco Mira, and Oxley, Howard, “Income Distribution and Poverty in Selected OECD Countries.” OECD Economics Department Working Papers No. 189, 1998.
Griffin, Keith, and Zhao, Renwei, Chinese Household Income Project, 1988 [Computer file]. New York: Hunter College Academic Computing Services [produce], 1992. Ann Arbor, MI: Inter-university Consortium for Political and Social Research [distributor], 1993. Gustafsson, Bjorn, and Li, Shi, “Economic Transformation and the Gender Earnings Gap in
Urban China.” Journal of Population Economics 13: 305-329, July 2000.
Gustafsson, Bjorn, and Li, Shi, “A More Unequal China? Aspect of Inequality in the Distribution of Equivalent Income.” In Carl Riskin, Renwei Zhao, and Shi Li, Eds., China’s Retreat from Equality, pp. 44-83. New York: An East Gate Book, 2001.
Hussain, Athar, Lanjouw, Peter, and Stern, Nicholas, “Income Inequalities in China: Evidence from Household Survey Data.” World Development 22, 12:1947-1957, December 1994. Jenkins, Stephen P., “Accounting for Inequality Trend: Decomposition Analysis for the UK,
1971-86.” Economica 62, 29-63, February 1995.
Jutting, Johannes, “Strengthening Social Security Systems in Rural Areas of Development Countries.” ZEF Discussion Papers on Development Policy, Bonne, June 1999.
Kanbur, Ravi, and Zhang, Xiaobo, “Which Regional Inequality? The Evolution of Rural-Urban and Inland-Coastal Inequality in China from 1983 to 1995.” Journal of Comparative Economics 27, 4:686-701, December 1999.
Khan, Azizur Rahman, and Riskin, Carl, “Income and Inequality in China: Composition, Distribution and Growth of Household Income, 1988 to 1995.” The China Quarterly, 1998.
Khan, Azizur Rahman, and Riskin, Carl, “The Distribution of Income: Evolution of Inequality 1988-1995.” In Inequality and Poverty in China in the Age of Globalization, pp. 28-51. New York: Oxford University Press, 2001.
Knight, John, and Song, Lina, “Economic Growth, Economic Reform, and Rising Inequality in China.” In Carl Riskin, Renwei Zhao, and Shi Li, Eds., China’s Retreat from Equality, pp. 84-124. New York: An East Gate Book, 2001.
Kung, James K. S., and Lee, Yiu-fai, “So What If There Is Income Inequality? The Distributive Consequence of Nonfarm Employment in Rural China.” Economic Development and Cultural Change 50, 1: 19-46, October 2001.
Planning 19, 3:159-165, May 2004.
Mookherjee, D., and Shorrocks, Anthony F., “A Decomposition Analysis of the Trend in UK Income Inequality.” Economic Journal 92, 886-902, December 1982.
National Bureau of Statistics of China, China Statistical Yearbook 2001. Beijing: China Statistics Press, 2003.
Riskin, Carl, Zhao, Renwei, and Li, Shi, Chinese Household Income Project, 1995 [Computer file]. ICPSR version. Amherst, MA: University of Massachusetts, Political Economy Research Institute [produce], 2000. Ann Arbor, MI: Inter-university Consortium for Political and Social Research [distributor], 2000.
Shorrocks, Anthony F., “Inequality Decomposition by Factor Components.” Econometrica 50, 1:193-211, January 1982.
Shorrocks, Anthony F., “The Impact of Income Components on the Distribution of Family Incomes.” Quarterly Journal of Economics 98, 2:311-326, May 1983.
Shorrocks, Anthony F., “Inequality Decomposition by Population Subgroups.” Econometrica 52, 6:1369-1385, November 1984.
Tsui, Kai-yuen, “Facto Decomposition of Chinese Rural Income Inequality: New Methodology, Empirical Findings, and Policy Implication.” Journal of Comparative Economics 26, 3: 502-528, September 1998.
World Bank, World Development Report 2000/2001. New York: Oxford University Press, 2001. Zhang, Ping, “Rural Interregional Inequality and Off-Farm Employment in China.” In Carl
Riskin, Renwei Zhao, and Shi Li, Eds., China’s Retreat from Equality, pp. 213-228. New York: An East Gate Book, 2001.
Zhao, Renwei, “Increasing Income Inequality and Its Causes in China” In Carl Riskin, Renwei Zhao, and Shi Li, Eds., China’s Retreat from Equality, pp. 25-43. New York: An East Gate Book, 2001.
APPENDIX The Pension Insurance System in China
Urban Workers
Pension insurance for urban workers is composed of the three tiers: defined–benefit basic insurance (the first tier), defined–contribution individual account (the second tier), and a voluntary scheme for supplement (the third tier).
This scheme basically applies to all forms of enterprises (SOEs, collective, private, foreign invested enterprises), and to all forms of workers (formal, flexible, self–employed, rural migrants) in urban areas.
1. Structure
The first tier: pay-as-you-go defined benefit
This is the State compulsory basic pension insurance intended as a redistributive scheme to support minimum living standards. It is financed through enterprises' contributions, which are pooled in the social insurance fund. The current pooling-level is mostly city-level.
The second tier: defined-contribution individual account
This is the individual depositary savings pension insurance, which is financed through workers and enterprises. Contributions are credited to individual accounts.
The third tier: enterprise pension insurance
This is the supplementary enterprise pension insurance, which is financed through employers on a voluntary basis, and individuals are also encouraged to contribute. All contributions are credited to individual accounts.
2. Contribution
Enterprise: Generally about 20% of its total payroll cost. Actual contribution rate is determined by the provincial government referring the general rate (20%).
Workers: Generally about 4% to 8% of their wage.
Individual Account: 11% of the individuals’ contributory wage (their monthly average wage in the previous year) is credited to their individual accounts, which is funded through all of the worker's contributions and a part of enterprises contributions.
contributions for individual accounts) is pooled in the social insurance fund to provide the basic insurance (the first tier).
3. Benefit
Workers at retirement age who have paid their contributions for more than fifteen years are entitled to pensions, benefiting from the basic insurance (the first tier) and the individual account (the second tier and the third tier).
Workers who do not pay their contributions more than fifteen years in the same municipality of social insurance withdraw deposited savings from their individual accounts (the second tier and the third tier) when they leave the enterprises (municipality), but they do not benefit from the basic insurance (the first tier).
Basic Insurance: The basic monthly pension benefit is 20% of the monthly average wage in the respective municipality in the previous year.
Individual Account: 1/120 of the accumulation in the individual account is paid monthly.
Statutory Retirement Age: 60 for male, 55 for female employees who are engaged in managerial work, and 50 for female workers who undertake production or supplementary works.
Rural Workers
The pension insurance system in rural areas is a scheme of self–security and saving accumulation on a voluntary basis, which is financed mainly through individuals’ contributions with some support from communities.
The benefits are provided according to the total accumulation in the accounts.
Participants generally contribute from 20 years old up to the pension age, which is generally 60 years old.
This scheme applies to rural people not supplied with commodity grain by the State: workers of TVEs (township-village enterprises), private enterprises, individual businesses, farmers, etc.
TABLE A1 Details in Age group
% POPULATION SHARE OF SUB-GROUPS
8 8 9 5 8 8 9 5
< = 1 5 2 3 .1 1 8 .8 2 9 .6 2 5 .7 1 6 < = < = 5 9 6 9 .1 7 0 .4 6 3 .8 6 7 .3
> = 6 0 7 .8 1 0 .8 6 .6 7 .0
u rb a n ru ra l
RELATIVE INCOMES OF SUB-GROUPS
8 8 9 5 8 8 9 5 < = 1 5 8 9 .5 9 1 .4 9 3 .2 9 0 .0 1 6 < = < = 5 9 1 0 2 .7 1 0 2 .9 1 0 3 .4 1 0 4 .1 > = 6 0 1 0 7 .5 9 5 .9 9 7 .5 9 7 .4 u rb a n ru ra l INEQUALITY IN SUB-GROUPS 8 8 9 5 8 8 9 5 < = 1 5 7 3 .3 1 2 0 .1 1 6 8 .1 1 7 3 .7 1 6 < = < = 5 9 7 8 .3 1 1 9 .4 1 7 8 .2 2 0 5 .2 > = 6 0 8 4 .2 1 1 7 .9 1 7 0 .9 1 9 8 .7 u rb a n ru ral
TABLE A2
DETAILS IN HOUSEHOLD TYPE
% POPULATION SHARE OF SUB-GROUPS
88 95 88 95 Adult 0.5 0.2 0.1 0.1 Adult with children 3.3 3.6 3.5 2.7 2 adults 7.2 9.8 1.0 1.9 2 adults with children 76.4 78.0 70.8 76.0 +3 adults 1.7 1.0 0.5 0.4 +3 adults with childres 11.0 7.4 24.1 19.0
urban rural
RELATIVE INCOMES OF SUB-GROUPS
88 95 88 95 Adult 98.1 81.1 72.9 62.2 Adult with children 88.6 86.7 99.8 91.4 2 adults 115.6 107.3 76.6 89.6 2 adults with children 98.2 100.0 100.1 100.4 +3 adults 119.2 103.3 91.1 137.1 +3 adults with childres 103.1 97.4 101.2 99.9
urban rural
INEQUALITY IN SUB-GOURPS
88 95 88 95 Adult 185.0 137.5 340.3 256.1 Adult with children 100.5 175.8 204.6 193.1 2 adults 84.2 109.9 219.3 225.2 2 adults with children 74.3 118.1 180.9 201.3 +3 adults 68.4 94.4 167.2 372.7 +3 adults with childres 89.4 126.5 152.8 178.8
TABLE A3
DETAILS IN HOUSEHOLD EMPLOYMENT PATTERN
% POPULATION SHARE OF SUB-GROUPS
No. earners 88 95 88 95 0 3.7 9.7 0.6 2.8 1 7.4 12.7 4.3 8.4 2 67.5 65.1 39.3 44.6 +3 21.5 12.5 55.8 44.3 urban rural
RELATIVE INCOMES OF SUB-GROUPS
N o . earners 8 8 9 5 8 8 9 5 0 1 0 5 .4 8 8 .5 1 2 2 .2 1 0 5 .1 1 1 0 1 .1 8 7 .2 8 2 .1 8 3 .9 2 9 3 .1 9 8 .6 9 1 .2 9 3 .1 + 3 1 2 0 .3 1 2 9 .3 1 0 7 .3 1 0 9 .7 urb an rural INEQUALITY IN SUB-GOUPS N o . earners 8 8 9 5 8 8 9 5 0 8 9 .4 1 11 .0 3 0 1 .0 2 6 1 .2 1 1 2 0 .2 1 55 .7 2 1 1 .5 2 1 0 .1 2 6 8 .5 1 05 .7 1 7 2 .2 1 8 5 .5 + 3 7 1 .8 1 17 .7 1 6 7 .3 1 9 6 .0 urb an rural