Imperceptible On-Screen Markers for Mobile Interaction on Public Large Displays
10
0
0
全文
(2) IEICE TRANS. INF. & SYST., VOL.E100–D, NO.9 SEPTEMBER 2017. 2028. trary images can be contents with imperceptible markers on a display screen. This means that a camera pose can be calculated anytime while the camera is moving as long as the users hold the camera of the mobile device facing toward the display/digital contents. Comparing to Virtual Projection, we could mention that the system has also two more advantages; the first is that the system works on feature-less contents and the second is that it does not require any synchronization between mobile devices and displays. In this paper, we present our method which provides the three important properties for mobile interaction with other external displays. After the section for related work, we describe the details of the process with the theory by separating it into embedding and detecting parts. In the subsequent section, we explain our experiments that show the advantages of our method using several contents on a stationary display. At the end, we conclude our work with four topics as the future work. 2. Related Work In recent years, cameras have become very popular in daily use due to being built-in in almost every mobile devices. Also, display devices are getting ubiquitous in public and personal environments. The relationship and user interaction methods that can be established between these two components have been extensively studied, especially in the field of AR. 2.1 Mobile Interaction with Displays Tablets and smartphones have been widely used as tools for interacting with external objects including distant displays. Content creation, edition, and transfer between devices are some of the activities that can be provided to engage users and increase collaboration [3]. Physical manipulation of the mobile device is the usual input method to control elements on the remote screen. Since a touchscreen surface can only provide coordinates in 2D, accelerometer and gyroscope are the common sensors employed to obtain the position and orientation of the mobile device in a 3D space [4]. For tasks that require precise manipulation, Touch Projector [5] makes use of zooming and temporary freezing of the camera image. Augmented TV proposes an AR application that synchronizes to the broadcasting movies for displaying additional information related to the content of the movie [6]. Mobile devices are suitable for handling personal information, whereas the large displays show information to anyone in public places. Considering these characteristics, the mobile interaction with displays can be seen as a good combination. 2.2 Fiducial Markers In AR applications, markers are placed in the environment as references to be used for estimation of the camera pose. ARTags [7] and ARToolKit [8] are typical visible fiducial. markers, which use four corner points of the marker pattern for inferring position. [9] expands the idea of the black and white QR codes, using multiple color channels to maximize the data throughput and the robustness of the barcode recognition. Although these visible markers provide accurate full camera pose, they use valuable physical space which is obstructive for the main visual information. On the other hand, markerless technology has been developed by considering a balance between human-friendly or computer-friendly. In AR research field, natural feature points are representative references for computation of full camera pose. There are several ways how to embed intentional markers into images or movies. Steganography is the technique of embedding information not only in visual medium for images [10], [11] or for movies [12]. MSU Stego Video [13] is a standalone software that hides a messages in a video stream. These technologies show us how to embed markers for AR. In addition, the infrared region is one of the techniques to make invisible markers. SideBySide [14] shows the modified projector whose red ray element was replaced with infrared one, which can interact with the other projector system via projected infrared markers. There are also optical approach such as Bokode [15] and ID CAM [16]. Moreover, temporal approach can be applied to make imperceptible markers. By switching the specific colors fast, computer vision systems can detect the change, whereas our human visual system cannot. Grundh¨ofer et al. [17] developed a method to measure the 3D environment imperceptibly although the system requires the synchronization between a camera and a projector display. 2.3. Imperceptible Markers. In order to implement an imperceptible marker system with ordinary equipment such as consumer-grade cameras and off-the-shelf projectors, unsynchronized technology is needed. VRCodes [1] is one of the most similar work to our approach. This also uses color mixture effects and provides a tagging system with digital displays with rolling shutter cameras. However, the tagging process requires the information about code location in advance. Accordingly, it is difficult to apply this technology to arbitrary contents for embedding codes. Although several similar work that used spatial coding or watermark techniques have been reported [18]–[20], they assume that the camera always captures obvious references such as frames of a display device. In our method, we do not need the information of contents on the screen, that is, our system can work for arbitrary contents. Additionally, we use only the embedded markers, which allows the user to move freely without thinking about the fiducial points in the captured image. Recently, another display-camera communication system, DisCo, was presented [21]. DisCo is using rolling shutter sensors and temporal modulation of display brightness at high frequencies imperceptibly. However, this paper does not discuss about the availability for geometrical interactions such as augmented reality uses..
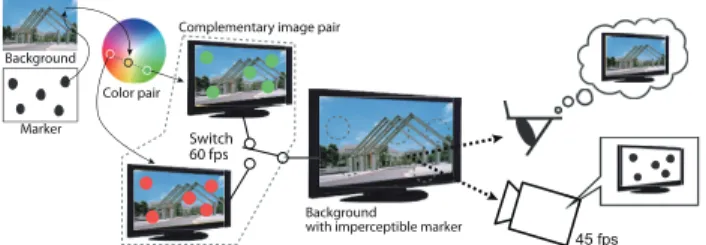
(3) YAMAMOTO et al.: IMPERCEPTIBLE ON-SCREEN MARKERS FOR MOBILE INTERACTION ON PUBLIC LARGE DISPLAYS. 2029. Natural feature tracking can be implemented for mobile interaction with displays [2], but it needs feature points on the screen. By contrast, our system works for even monochrome contents that have few natural feature points. In this paper, we show the imperceptibility of our markers and the robustness of our marker detection method through three experiments. 3. Method Our method consists of two parts: marker embedding on external displays and marker detection. Our concept is to treat the original image as a content image on external displays. We then put the marker on the foreground imperceptibly. Figure 2 shows the overview of the method with these two processes. To embed the marker to the screen, it is important to design the marker to be distinguishable for a computer vision system, but unobtrusive for the human visual system. This section describes how we create imperceptible on-screen markers and how we can detect the marker using a camera. 3.1 Marker Embedding We can embed a marker to any contents by representing it as a complementary image pair. This pair of images is generated by modifying colors on the content images. We do this modification such that the human visual system will perceive only the image of the content when we continuously switch between the two images. This method takes advantage of the human visual system’s temporal integration of light. That is, when switched faster than the Critical Flicker Frequency (CCF), two alternating colors will be perceived to be the average of these two colors [22]. Although imperceptible to humans, this type of marker can be extracted using computer vision techniques. We use the marker as a mask to determine the area of the contents within which we will calculate complementary pixel values (color pairs). We then create the image pair by replacing the corresponding pixel on the image of the content with these color pairs. The images of the pair are switched alternatively on the screen of a display device at 60 Hz. This speed is chosen so that the human eyes can only see the content. Theoretically, the two. Fig. 2 An overview of our method. Complementary image pair is created using a content and a marker as a mask. These images are switched faster than Critical Flicker Frequency on a display. Humans perceive only the image of the content, whereas a computer vision system can detect the embedded marker.. colors work as one color for human eyes when the refresh rate is higher than CFF which is around 60 Hz. We generate color pairs C1 = (r1 , g1 , b1 ), C2 = (r2 , g2 , b2 ) for each pixel Co = (r p , g p , b p ) of the content that is within the marker mask. The two colors can be described as C1 = Co + ∆C, C2 = Co − ∆C, where ∆C = (δr, δg, δb) is the color difference from the pixel color from the content, to either of the color pairs. Assuming t is the smallest difference that the √ difference can be distinguished by a camera,. then |∆C| = δr2 + δg2 + δb2 ≥ t. Candidate color pairs are on a spherical surface with radius |∆C| in the sRGB color space. The human visual system is more sensitive to lightness than to chromaticity [22], as such we select the color pairs based on chromaticity in L*a*b* color space. In order to find the color pair that is less likely to affect human visual system, we use the CIE L*a*b* color space by converting from sRGB color space. First, we convert the color from the sRGB color space to the XYZ color space by linear transformation. We then convert the result to the CIE L*a*b* color space. After these color space transformations, we create color pairs from chromaticity a*b* color plane of the same lightness L* on the basis of the original color of the content. The selection based on a*b* color plane should make the flickering less. In the section described as Experiment 1, we explain the effect of this method through an experiment. A complementary image pair representing the marker are generated by calculating every color pair within the marker mask as shown in Fig. 3. The imperceptible onscreen marker is achieved by switching between the image pair at 60 Hz. |∆C| is the only parameter for generating the color pairs. If |∆C| is too big, the human visual system will be able to perceive the flicker because of the high contrast. Currently, we choose the parameter manually based on our previous experiences. 3.2. Marker Detection. Our method allows a computer vision system to detect the imperceptible on-screen markers. In order to detect a marker through captured images, we have set a camera at a capture rate of 45 fps. We then extract an embedded marker by accumulating each difference between three sequentially captured images while the display device switches the complementary image pair on the screen at 60 fps. In other words,. Fig. 3. Color space conversions in our method..
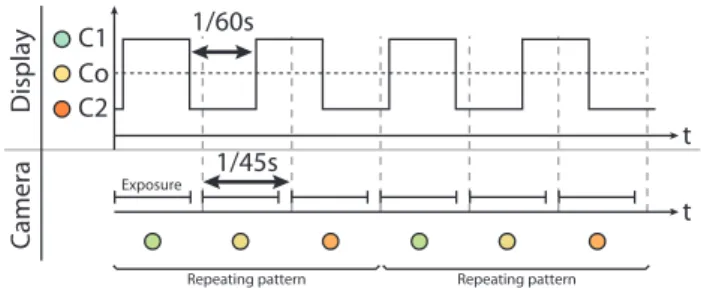
(4) IEICE TRANS. INF. & SYST., VOL.E100–D, NO.9 SEPTEMBER 2017. 2030. Fig. 4 era.. Temporal relationship between update rates of display and cam-. each of the image pair appears at 30 fps. Figure 4 shows the relationship between the timing of switching on a screen and the timing of capturing on a camera. We rely on the beat phenomenon for extracting the embedded marker. Given that the refresh rate fd and the capture rate fc have a small difference, then we can calculate a beat frequency fb = | fd − fc |. Each beat will have fc / fb frames that repeatingly follow a particular pattern. Marker recovery will rely on this pattern so we want to choose fd and fc that results to a small number of frames. For our method, we set fd = 60 Hz and fc = 45 Hz resulting to fb = 15 Hz. Thus, we can expect a pattern from three sequentially captured frames. In other words, if we focus on a single pixel value in the frame, we can expect it to be one of three values R1 , R2 , and R3 . Moreover, there will be a particular order for these three values, say R1 , R2 , R3 , R1 , R2 , R3 , · · · as shown in Fig. 4. R1 , R2 , R3 within the mask, whereas outside the mask, R1 = R2 = R3 . As such, we can determine the marker mask by aggregating the locations where R1 , R2 , R3 , thereby recovering the marker. In addition, the marker mask becomes more apparent over time by accumulating the differences between areas outside of the mask, and areas within the mask. In theory, given the display refresh rate of 60 fps and the capturing rate of 45 fps, the marker can always be distinguished from the content with only three sequentially captured images. Moreover, by showing that we can do marker extraction in three frames, we also show that constant marker extraction is possible. We can express color switching as a wave cd (t) with the color value varying in time as follows: ∞ 2distcolor ∑ sin{(2k − 1)2π fd (t − t0 )} + co , cd (t) = π 2k − 1 k=1 where distcolor is the color distance between the two colors, fd is refresh rate frequency of the display device, t0 is initial phase shift, and co is the original color. Given an exposure time E, the color detected by the camera is determined from the accumulated light within E. Since there is the relationship between the value of the display color and the value of captured color, we assume it as one parameter η. We express capturing as a wave because we periodically sample light. The phase shift x is the time difference between color switching and capturing. To show that our method allows for constant detection, checking three sequentially captured frames is enough because the. Fig. 5 Simulation result where distcolor = 1, the order of Fourier series is 10, η = 50, E = 0.020.. refresh rate 60 fps and capture rate 45 fps waves creates a beat at 15 fps with one beat having three frames (45 fps/15 Hz). We can calculate an average value for captured color in frame n with the following equation: ∫ nTc +E c¯ cn (x) = η cd (t, x)dt c ∫ nTc +EnT∑ ∫ nTc +E ∞ sin{(2k − 1)2π fd (t − x)} =D +η co 2k − 1 nT c nT c k=1 ∞ nTc +E ∑ − cos{(2k − 1)2π fd (t − x)} = D + ηEco , (2k − 1)2 2π fd k=1 nT c. where D = 2distcolor η/π. Considering three frames’ c¯ cn (x) (n = 0, 1, 2), the sum of each difference h(x) can be described as: h(x) = |¯cc0 (x)− c¯ c1 (x)|+|¯cc1 (x)− c¯ c2 (x)|+|¯cc2 (x)− c¯ c0 (x)|. Simulating the above equation as shown in Fig. 5, we can show that the difference can be observed constantly (h(x) > 0). Therefore, a camera can always observe the difference and we can rely on this difference to identify pixel values comprising the marker. In image processing, each color is transformed to the CIE L*a*b* color space and values of a* and b* are used for the color difference calculation. Focus on three sequentially captured images, difference values in each axis can be calculated separately as follows: ∆a = |a0 − a1 | + |a1 − a2 | + |a2 − a0 | ∆b = |b0 − b1 | + |b1 − b2 | + |b2 − b0 |. √ After calculating hˆ = ∆a2 + ∆b2 , we threshold the output to recover the marker. Using existing marker recognition algorithms for binarized images such as random dot markers [23] or ARToolKit [8], we can estimate the full pose of the camera. Flickering occurs due to down sampling (60 Hz to 45 Hz). To reduce the effect of flickering, the average color of c¯ cn (x) (i = 0, 1, 2) can be used as a similar color instead of the original colors separately. 4.. Experiments. In this section, we discuss three experiments: One for verifying the imperceptibility of our embedded markers and two regarding the robustness of our marker detection. The first experiment is a user test which aims to confirm the imperceptibility of the embedded markers by comparing embedding patterns with several color pair generating conditions,.
(5) YAMAMOTO et al.: IMPERCEPTIBLE ON-SCREEN MARKERS FOR MOBILE INTERACTION ON PUBLIC LARGE DISPLAYS. 2031. given one content and a marker. The second and third experiments are evaluation tests to confirm the robustness by measuring the marker detection rate of our prototype system under different conditions. For the second experiment, we use a static camera on a tripod and confirm the robustness using six different contents on the display. The third experiment emulates the use of a mobile device’s camera for interaction by using a camera attached to a rotation base. 4.1 Experiment 1: Imperceptibility of Embedded Markers Human visual perception is generally more sensitive to light changes than chromatic changes [22]. This characteristic is important when choosing a color pair for one color. In our prototype, we apply random dot markers generated using the approach which is developed by Uchiyama and Saito [23]. Although this human visual perception has been shown already enough in general by reference [22], we need to confirm if it works with the dot markers even with a few participants. This experiment aims to investigate the imperceptibility of embedded on-screen markers, while describing best practices for marker embedding. 4.1.1 Experimental Design Experimental apparatuses are a 24inch display (HP LP2475w), a keyboard for a reaction, and a computer (HP Pavilion Elite HPE-360jp Desktop PC, AMD Phenom II X6 1090T 3.20 GHz, 8 GB RAM). We also used a chin rest to keep a position of each subject’s head. Experimental Platform:. Conditions: In order to find what kind of color combinations that works as unobstructive markers to human visual perception, we conducted a user test to compare in each condition under three variables; contents, color axes in the L*a*b* color space, and color distances. We chose six monochrome contents for a display screen, which are (200, 50, 50), (50, 200, 50), (50, 50, 200), (100, 50, 50), (50, 100, 50), and (50, 50, 100) in the RGB color space. As two-color pairs are calculated in the L*a*b* color space, we allow to use only in L* axis, a* axis or b* axis for the two-color pairs. In each axis, we changed the color distance between the two alternative color with four patterns: |∆cd | = (10, 20, 30, 40). Thus we have six contents × three color axes × four color distances. Additionally, we used just contents without embedding markers. The number of the total patterns is 72 + 6 = 78 patterns.. 4.1.2. Results. The results comparing in each color axis condition are shown in Fig. 6. Lower number stands for good performance which makes a marker unobstructive. Obviously, color pairs in L* axis is easy for human visual system to perceive. An interesting point is that one subject answered once that the subject could see a marker even though there is no marker. From the result of Fig. 6, b* axis looks like the most suitable axis for making two-color pair because the markers are not perceived by the subjects’ visual system in most of trials. On the other hand, a* axis is also useful if the color distance |∆cd | is lower than 30 based on the result shown in Fig. 7. Practically, we use around 20 as a color distance because too big color distance limits applicable color range. Accordingly, we conclude that L* axis should not be used and a* and b* axes should be used for making two-color pair for one color. 4.1.3. Discussion. Considering results of Fig. 6 and 7, we can embed markers in chromatic field, which is represented by a*b* plane in the CIE L*a*b* color space by keeping the lightness closely from the original color. According to the characteristics of human visual perception [22], the color pair on the b* axis is little bit difficult to be perceived than in the case of a*. On the other hand, for our method, we can say that it is very difficult for human visual system to distinguish color pairs generated with color distance around 20 or smaller than 20 as a result. Additionally, humans will not notice if there is markers if they do not know the existence. In conclusion in this experiment, we use the color distance around 20 as the color distance between each color pair.. Fig. 6 Percentage of trials where participants detected markers according to different axes in the color space used for computing complementary colors. Lower percentages represent higher imperceptibility. We also displayed no markers in order to estimate the amount of false positives.. Procedure: We had four subjects who are students in their. twenties without problems on their eyesight or color perception. We let them sit and fix their heads at 50 cm from a display, and require them to take a look at the display during a task. Each pattern was randomly shown from 78 patterns and took a one-minute break every time after checking 26 patterns. We have conducted this user test as a polar question task that requires each subject to press a space key if “can see a marker” or not to press a key if “cannot see a marker”.. Fig. 7 Percentage of trials where participants detected markers according to different distance of complementary colors on different axes in the color space. Lower percentages represent higher imperceptibility..
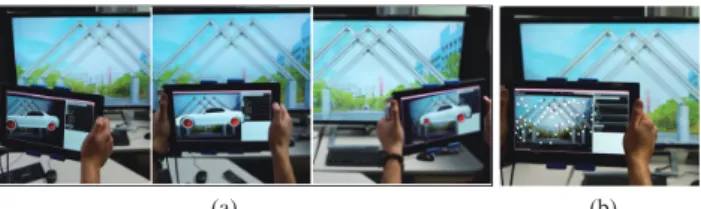
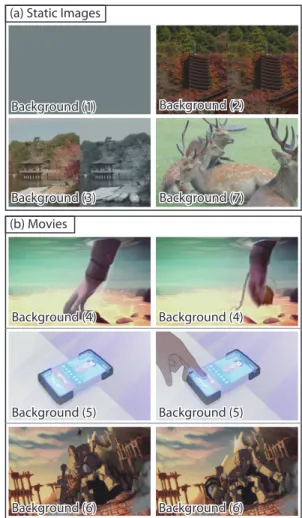
(6) IEICE TRANS. INF. & SYST., VOL.E100–D, NO.9 SEPTEMBER 2017. 2032. 4.2 Experiment 2: Robustness of Marker Detection with Static Camera We developed a prototype system for the experiment 2 and 3. In this experiment, we evaluate the robustness of our method in two content scenarios: three static arbitrary images and three movies. During our trials, a camera was fixed on a tripod. In order to prove the availability of our method for arbitrary contents, our prototype tries to detect embedded markers from three different textured images without any prior knowledge about them. On the other hand, three movies were prepared to test the limitation of our method, which is theoretically weak at detecting markers in dynamic contents due to the use of subtraction as image processing. Additionally, we have conducted this experiment with the global and rolling shutter cameras to show that both cameras can work in our method. Since the dot markers was designed for the use of augmented reality, our system can calculate the full pose of the camera when the marker detections work.. Fig. 8 Apparatus for experiment 2: (a) schematic side view, (b) photo of front view.. 4.2.1 Experimental Design Experimental Platform: Figure 8 (a) shows the setup for. experiment 2 which includes the two types of cameras, a global shutter camera (PointGrey Flea3 FL3-GE-13S2C) and a rolling shutter camera (PlayStation Eye), to be compared. They are positioned at different distances from the display to capture the whole screen, respectively at 2.0 m and 1.5 m, due to the differences in field of view. The real experimental environment can be seen in Fig. 8 (b). We use a 55-inch Toshiba Regza 55X3 display monitor as an external display with a desktop computer (Intel i7 3.50 GHz, 32 GB RAM) for displaying sequential complementary images pairs. For marker detection, we use a desktop computer (Intel i7 3.20 GHz, 8 GB RAM) alongside the cameras. In order for our system to work theoretically, we have confirmed that the marker detection process of the system was going in 45 fps with the 60 fps display. Conditions: Figure 9 shows seven kinds of contents to be. displayed. We use six contents which are (1)-(6) from them. Content (1) is monochrome grey, which has no natural feature points and therefore does not work for Virtual Projection [2]. Content (2) has the same contents side-by-side, therefore presenting the same natural feature points in both sides. While this aspect makes it hard for Virtual Projection to distinguish them, our method can assign different IDs for each because imperceptible markers can be embedded independently from the contents. In Content (3), the same image is displayed side-by-side in two versions: a colorful and a greyscale image. Although they are geometrically the same, their color difference requires VRCodes [1] to know in advance what type of image is being used, while our method is robust. Contents (4), (5) and (6) are animation movies, which represent a challenge to our method. For this experiment, we use cartoons with higher probability to have a space where we can embed markers stably.. Fig. 9 Contents used in experiments 2 and 3: (a) static images; (b) movies, with two representative frames shown in this figure. Contents (1)(6) for experiment 2 and (1), (7), (4), (5) for experiment 3.. Procedure: We calculated the detection rate of marker. recognition from several sequential images. Since contents (1)-(3) are static images and (4)-(6) are animation movies, we apply different number of trials. For static images, we randomly check for success of detection 10 times for 3 seconds of sequential images, that is, we can have 10 × 45 fps × 3 seconds = 1,350 trials. Furthermore, we randomly check for success of detection 40 times for the movies, giving a total of 5,400 trials. 4.2.2. Results. Figure 10 shows the detected markers overlaid as white dots.
(7) YAMAMOTO et al.: IMPERCEPTIBLE ON-SCREEN MARKERS FOR MOBILE INTERACTION ON PUBLIC LARGE DISPLAYS. 2033. Fig. 10 Detected markers overlaid as white dots for different contents and different shutters. (1)-(3) are static contents; (4)-(6) are frames from movies.. for different contents (movies are represented by a single frame). For contents (1)-(3), both cameras consistently detected the markers. The results show no remarkable difference between the cameras. In addition, different random dot markers can be observed even though there are same or similar contents side-by-side such as contents (2) and (3). However, we experienced unstable marker extraction with the rolling shutter camera due to the rolling shutter effect. Comparing the results for (4)-(6), the rolling shutter presents a smaller number of white dots, even in case of equivalent scenes. On the other hand, the markers can easily be detected in the scene that has lower spatial frequency areas even though the contents are movies. The results of detection rate for each content are shown in Fig. 11. Both cameras have detection rate of 100 % (1,350 detection sucesses/1,350 trials) for static contents (1)-(3). Moreover, the global shutter camera performed better than the rolling shutter camera for the animation movies (4)-(6), respectively 59.3 % (3,203 successes/5,400 trials) against 31.1 % (1,678 successes/5,400 trials), 51.5 % (2,780 successes/5,400 trials) against 27.4 % (1,480 successes/5,400 trials), and 49.8 % (2,690 successes/5,400 trials) against 13.4 % (723 successes/5,400 trials). 4.2.3 Discussion The results of the experiment show us that the robustness of our system for static images is high. In an actual scenario, a user would be able to have an AR experience by holding a mobile device and keeping it still in front of the external display that has an imperceptible marker. On the other hand, the detection rates for movies were interfered from edge noise occurred by the movement of the contents. We expected that the amount of movement in a movie causes more noise and declines the detection rates. We then define the inverse of the compression ratio as the measurement of the complexity of a movie. We calculate the complexity in the following: k = (Vraw /Vcompressed )−1 = Vcompressed /Vraw. (1). where k is the complexity, Vraw is data size of a raw movie, and Vcompressed is the data size of a corresponding compressed movie. The complexity of each movie content was. Fig. 11 Detection rates for different contents with global and rolling shutter cameras. Table 1. Complexity of each content movie.. # of frames Raw size (GB) Compressed size (MB) Complexity. BG (4) 6,735 41.9 124.1 0.00296. BG (5) 3,202 19.9 119.1 0.00598. BG (6) 467 2.9 22.7 0.00781. calculated as shown in Table 1. We used H. 264 codec to make compressed movies. As we expected, each movie content has a different complexity and there is a possibility that the complexity is related to the detection rate results shown in Fig. 11 and Table 1. Although there is no statistical analysis since results were just accumulated data with a lot of trials, the detection rates seem to correspond to the complexity of each content. Moreover, comparing the results between global and rolling shutter cameras, the camera characteristics affect to the detection rates. The interesting results of the comparison between these two types of cameras are discussed in next section. 4.3. Experiment 3: Robustness of Marker Detection with Moving Camera. The third experiment is to confirm the robustness of our system in practical situations that a camera moves as if a user holds and moves a mobile device, and experiences AR content via the mobile display screen in front of the external distant display. Since our method applies image subtraction processing between three sequential images, it is obvious that the dynamical movement of the camera makes a lot of noise during the process. However, there is a possibility that marker recognition can be done if a user moves the device only slightly for looking at AR contents on a screen. For this reason, we measured the detection rates in several con-.
(8) IEICE TRANS. INF. & SYST., VOL.E100–D, NO.9 SEPTEMBER 2017. 2034. ditions by using a rotating base to move a camera on the same trajectory with global and rolling shutter cameras in this experiment.. cameras.. 4.3.1 Experimental Design. The results of the detection rates with the global and rolling shutter cameras are shown in Fig. 13 (a) and (b), respectively. The detection rates with content (1) in any rotation speed were kept as high rates which is almost 100 %. On the other hand, the detection rates of the other static image, content (7), show difference rates between the cameras. The result of the global shutter camera shows substantial decline between the speeds 5.79 deg/s and 9.01 deg/s, while the rolling shutter camera provides stable results. The results of movies, content (4) and (5), has large variances in each rotation speed condition because of the moving of the video contents. The detection rates of movies are lower than static images except the result of content (7) with the global shutter camera. Additionally, the results show that the results of the rolling shutter camera seems to be better than one of the global shutter camera.. Experimental Platform: We used the same platform in ex-. periment 2 except that we added a rotating base. We fixed the center of rotation on the tripod, and attached a pole on which we placed the camera 35 cm away from the center of rotation. This allows the camera to move along a fixed trajectory as shown in Fig.12 (a). We set the initial position to be the camera facing the display directly. We applied this set up for both the global and rolling shutter cameras with perpendicular distances of 2.0 m and 1.5 m to the display, respectively. With this set up, we can control the position along the trajectory (deg) and the speed (deg/s). Figure 12 (b) shows the actual experimental environment. Conditions: We used four contents for this experiment: con-. tent (1) and (7) are static images, and (4) and (5) are movies shown in Fig. 10. Content (1) is monochrome, whereas (7) has several high spatial frequencies. While we applied content (2) and (3) in experiment 2 in order to confirm if our system can observe two different markers for comparing with other methods, we used content (7) which has single marker in experiment 3. Contents (4) and (5) have different complexities that allows us to estimate the difficulty for the detection. We fixed the trajectory of the camera to a length of 30 degrees. We move the camera from 15 degrees to its left and to 15 degrees to its right, and vice versa. The only variable is the speed. We chose the speeds 2.57 deg/s, 5.79 deg/s, 9.01 deg/s, and 10.29 deg/s. When the speed is faster than 10.29 deg/s, the system cannot detect the marker for any content. We measured the detection rate during the movement of the rotating base; durations for each speed are 11.67, 5.18, and 2.92 seconds, respectively. For one content and one rotating speed, we measured the detection rates 10 times. To avoid including the data that was recorded before the movement, we extracted the middle part from the recorded data. For contents (4) and (5), we decided the start timing randomly to measure the detection rates. We conducted this experiment with the global and rolling shutter Procedure:. Fig. 12 Apparatus for experiment 3: (a) schematic view from top, (b) photo of front view.. 4.3.2. 4.3.3. Result. Discussion. In a practical scenario, users should be able to move the mobile device to see AR contents from different viewpoints. In our observation, rotation speed 5.79 deg/s can cover a slight movement. From this perspective, our method is robust enough for static images and works approximately 20 %–40 % for movies as shown in Fig. 13. Since we can still detect the embedded markers while the detection rates are lower for movies, there is the possibility to interpolate the lost pose by using motion sensors of a mobile device. The interesting point in Fig. 13 is the result of the detection rate for content (7) with the global shutter camera. Although we expected the global shutter camera to make better results than the rolling shutter camera, the results were opposite. We believed this occurred due to the too high performance of the global shutter camera. In other words, the global shutter camera can capture the details of the contents. The detail capturing creates noise because of the subtraction. Fig. 13 Detection rates for different contents and different rotation speed with (a) global and (b) rolling shutter cameras..
(9) YAMAMOTO et al.: IMPERCEPTIBLE ON-SCREEN MARKERS FOR MOBILE INTERACTION ON PUBLIC LARGE DISPLAYS. 2035. image processing. On the other hand, the rolling shutter camera has a suitable performance for the marker detection because the camera cannot capture the details clearly. Additionally, the results for movie contents (4) and (5) are also better than the global shutter camera’s result. Based on our observations, we assume that the suitable blurring makes the robustness higher. However, in experiment 2, the results of the global shutter camera was better than the rolling shutter camera. We think that the rolling shutter camera exhibited temporal instability in marker detection because of the rolling shutter effect. Although the rolling shutter camera has the disadvantage, the camera could detect markers better. 5. Conclusion and Future Work The goal of our work was to enable users to experience mobile interaction with digital content which is displayed on external displays with imperceptible on-screen markers. We show that our method is the first with all the following properties: computation of full pose, the camera can move, and the external display contents can change and do not need to be known in advance. We explained our method by proving that our method can detect markers constantly in theory. We developed a prototype system and conducted three experiments: One experiment for verifying the imperceptibility of our markers and two experiments regarding the robustness of our marker detection. We confirmed that the humans cannot perceive the embedded marker when we use around 20 or smaller than 20 as a color distance in chromatic filed in the CIE L*a*b* color space. From the two experiments regarding the robustness, we confirmed that our method can provide the properties which are computation of full pose and the camera can move if the camera is static or moves slower. From the results, we could expect that our system can work even if users holds the device stably by their hands like taking photos. Additionally, our method works approximately 10–40 % of the time for movies. Moreover, we discussed about the relationship between the robustness and the captured image quality. In order to avoid an increase of noise, we need to consider a suitable blurring processing to captured images. The rest of this paper summarises each topic we discussed and describes the future work. Shutters: We confirmed that the global and rolling shutter. cameras are both usable in our method, except some situations. In the case of a stationary camera setting, the global shutter camera had better results than the rolling shutter camera. On the other hand, the detection rate for a textured image with the global shutter camera declined when the camera was moved, whereas the results of the rolling shutter camera were high. We assume that the difference of a performance between the cameras caused the results. For future work, we plan to investigate which camera parameters are needed to adjust for marker detection.. Contents: In conclusion, our method has a high perfor-. mance for static images when the camera is still or moves slowly. For movies, our method works 10–40 % of the time, if we include both still and a moving camera scenarios. However, the image that has high spatial frequency occurs noise when the global shutter camera moves. Although we will improve the rates in the future, it is confirmed that there is a possibility to detect markers even in movies. Stabilization: The dynamical situations that include movies. and movement of the cameras decline the detection rates due to the inter-frame difference. This means that the moving camera often loose the markers. In order to avoid the situations, we have implemented the integration with motion sensors for interpolating the camera pose. Since current mobile devices commonly have an accelerometer and a gyroscope, this could be practical implementations. We will improve the pose estimation as a future work. Wide-area deployment: We can develop variety of applica-. tions using our marker system. As described in the Section 2, mobile devices and external displays, public or large displays, would lead the novel interaction between personal and public or shared information. Although our system has not been in practical level yet with movies and moving cameras, we can expect good applications with still images or slow dynamic contents on digital signage displays. For example, in a public space such as a large shopping mall, the users can have AR objects as the detail information regarding each shop through a lot of public displays in the space. In addition, we can apply it at stations or airports such a maze of areas in order to guide users. Also, TV shows can provides AR contents to the viewer personally through television displays, and intuitive transfer of personal information between users via larger displays can also be done. Acknowledgments This work was supported by JSPS KAKENHI Grant Number 15K16040. References [1] G. Woo, A. Lippman, and R. Raskar, “Vrcodes: Unobtrusive and active visual codes for interaction by exploiting rolling shutter,” ISMAR 2012, pp.59–64, 2012. [2] D. Baur, S. Boring, and S. Feiner, “Virtual projection: Exploring optical projection as a metaphor for multi-device interaction,” Proc. CHI 2012, pp.1693–1702, ACM Press, 2012. [3] M.D.B. Machuca, W. Chinthammit, Y. Yang, and H. Duh, “3d mobile interactions for public displays,” SIGGRAPH Asia 2014 Mob. Graph. Interact. Appl., Article no. 17, 2014. [4] L.P. Berg´e, M. Serrano, G. Perelman, and E. Dubois, “Exploring smartphone-based interaction with overview+detail interfaces on 3d public displays,” MobileHCI 2014, pp.125–134, 2014. [5] S. Boring, D. Baur, A. Butz, S. Gustafson, and P. Baudisch, “Touch projector: Mobile interaction through video,” Proc. CHI 2010, pp.2287–2296, ACM Press, 2010. [6] H. Kawakita, T. Nakagawa, and M. Sato, “Augmented tv: an augmented reality system for tv pictures beyond the tv screen,” Trans. Virtual Real. Soc. Japan, vol.19, no.3, pp.319–328, 2014..
(10) IEICE TRANS. INF. & SYST., VOL.E100–D, NO.9 SEPTEMBER 2017. 2036. [7] M. Fiala, “Artag, a fiducial marker system using digital techniques,” CVPR 05, pp.590–396, 2005. [8] H. Kato and M. Billinghurst, “Marker tracking and hmd calibration for a video-based augmented reality conferencing system,” IWAR 99, pp.85–94, 1999. [9] T. Langlotz and O. Bimber, “Unsynchronized 4d barcodes: coding and decoding time-multiplexed 2d colorcodes,” ISVC 2007, pp.363– 374, 2007. [10] N.F. Johnson and S. Jajodia, “Exploring steganography: Seeing the unseen,” Computer, vol.31, no.2, pp.26–34, 1998. [11] J. Fridrich, M. Goljan, and R. Du, “Reliable detection of lsb steganography in color and grayscale images,” Workshop on MM&Sec: New Challenges, pp.27–30, 2001. [12] C. Xu, X. Ping, and T. Zhang, “Steganography in compressed video stream,” ICICIC 2006., pp.269–272, 2006. [13] Q. Liu, A. Sung, and M. Qiao, “Video steganalysis based on the expanded markov and joint distribution on the transform domains detecting msu stegovideo,” ICMLA ’08., pp.671–674, 2008. [14] K.D. Willis, I. Poupyrev, S.E. Hudson, and M. Mahler, “Sidebyside: Ad-hoc multi-user interaction with handheld projectors,” UIST 2011, pp.431–440, 2011. [15] A. Mohan, G. Woo, S. Hiura, Q. Smithwick, and R. Raskar, “Bokode: Imperceptible visual tags for camera based interaction from a distance,” ACM Trans. Graph., vol.28, no.3, pp.98:1–98:8, July 2009. [16] N. Matsushita, D. Hihara, T. Ushio, S. Yoshimura, J. Rekimoto, and Y. Yamamoto, “Id cam: A smart camera for scene capturing and id recognition,” ISMAR 2003, pp.227–236, 2003. [17] A. Grundh¨ofer, M. Seeger, F. Hantsch, and O. Bimber, “Dynamic adaptation of projected imperceptible codes,” ISMAR 2007, pp.1– 10, 2007. [18] A. Wang, C. Peng, O. Zhang, G. Shen, and B. Zeng, “Inframe : Multiflexing full-frame visible communication channel for humans and devices,” HotNets 2014, pp.1–7, 2014. [19] W. Yuan, K. Dana, A. Ashok, M. Gruteser, and N. Mandayam, “Dynamic and invisible messaging for visual mimo,” Proc. IEEE Work. Appl. Comput. Vis., pp.345–352, 2012. [20] S. Yamamoto, H. Tanaka, S. Ando, A. Katayama, and K. Tsutsuguchi, “Visual syncar: Augmented reality which synchronizes video and overlaid information,” J. Inst. Image Electron. Eng. Japan, vol.43, no.3, pp.397–403, 2014. [21] K. Jo, M. Gupta, and S.K. Nayar, “DisCo: Display-camera communication using rolling shutter sensors,” ACM Trans. Graph., vol.35, no.5, Sept. 2016. [22] M.D. Fairchild, Color Appearance Models, first ed., AddisonWesley, Reading, MA, 1998. [23] H. Uchiyama and H. Saito, “Random dot markers,” IEEE Virtual Reality, pp.35–38, IEEE, 2011.. Goshiro Yamamoto received the B.E., M.E., and Ph.D. in Engineering degrees from Osaka University, Japan in 2004, 2006, and 2009 respectively. Since 2016, he has been a senior lecturer in Kyoto University Hospital. Before joining Kyoto University Hospital, he had been an assistant professor in Nara Institute of Science and Technology for five years.. Luiz Sampaio received the M.E. degree from Nara Institute of Science and Technology in 2015.. Takafumi Taketomi received his B.E. degree in National Institute for Academic Degrees and University Evaluation in 2006. He received his M.E. and Ph.D. degrees in information science from Nara Institute of Science and Technology (NAIST) in 2008 and 2011, respectively. He has been an assistant professor at NAIST since 2011.. Christian Sandor obtained a doctorate in Computer Science from the Munich University of Technology, Germany under the supervision of Prof. Gudrun Klinker and Prof. Steven Feiner in 2005. Since 2014, he has been an associate professor in the Graduate School of Information Science of Nara Institute of Science and Technology. Before joining NAIST, he directed the Magic Vision Lab.. Hirokazu Kato received his B.E., M.E. and Dr. Eng. degrees from Osaka University, Japan in 1986, 1988 and 1996, respectively. Since 2007, he has been a professor in the Graduate School of Information Science of Nara Institute of Science and Technology. He received the Virtual Reality Technical Achievement Award from IEEE VGTC in 2009, and Lasting Impact Award at the 11th IEEE International Symposium on Mixed and Augmented Reality in 2012.. Tomohiro Kuroda received his B.E. in Kyoto University, M.E. and Ph.D. in Engineering degrees from Nara Institute of Science and Technology, Japan in 1994, 1996 and 1998, respectively. He is CIO of Kyoto University Hospital and a professor in Graduate School of Medicine and of Graduate School of Informatics at Kyoto University..
(11)
図

+4


関連したドキュメント
Theorem 4.8 shows that the addition of the nonlocal term to local diffusion pro- duces similar early pattern results when compared to the pure local case considered in [33].. Lemma
Keywords: continuous time random walk, Brownian motion, collision time, skew Young tableaux, tandem queue.. AMS 2000 Subject Classification: Primary:
Since the boundary integral equation is Fredholm, the solvability theorem follows from the uniqueness theorem, which is ensured for the Neumann problem in the case of the
Next, we prove bounds for the dimensions of p-adic MLV-spaces in Section 3, assuming results in Section 4, and make a conjecture about a special element in the motivic Galois group
Transirico, “Second order elliptic equations in weighted Sobolev spaces on unbounded domains,” Rendiconti della Accademia Nazionale delle Scienze detta dei XL.. Memorie di
Keywords and Phrases: The Milnor K-group, Complete Discrete Val- uation Field, Higher Local Class Field Theory..
We study the classical invariant theory of the B´ ezoutiant R(A, B) of a pair of binary forms A, B.. We also describe a ‘generic reduc- tion formula’ which recovers B from R(A, B)
We formalize and extend this remark in Theorem 7.4 below which shows that the spectral flow of the odd signature operator coupled to a path of flat connections on a manifold
