Development of a Sequencing Method for Whole
Capsid Region of Human Sapovirus
著者
曾 嵐清
学位授与機関
Tohoku University
修士論文
Development of a Sequencing Method for Whole Capsid Region of Human Sapovirus
(ヒトサポウイルスのカプシド領域のシーケンス方法の開発)
東北大学大学院医学系医学研究科医科学專攻 病理病態学講座微生物学分野
ZENG LANQING 曾 嵐清
Table of Contents
1. Abstract ...3 2. Introduction ...4 3. Objectives ...8 4. Methodology ...8 4.1 Study sites ... 84.2 Sample collection method ... 8
4.3 Detection of sapovirus by real-time reverse transcription PCR ... 9
4.4 Partial capsid region sequencing... 10
4.5 Sample selection for whole capsid sequencing ... 11
4.6 Whole capsid region sequencing ... 11
4.7 Sequences analysis and multiple genotype detection ... 13
5. Results ...14
5.1 PCR results ... 14
5.2 Phylogenetic analysis based on the partial capsid sequence... 15
5.3 Mixed-infection detection ... 15
5.4 Phylogenetic analysis based on whole capsid sequence ... 17
6. Discussion ...18
7. Limitation ...20
8. Conclusion ...21
9. Acknowledgements ...21
10. Reference ...23
1. Abstract
Background: Sapovirus has been reported to be associated with not only outbreaks but also
sporadic cases of acute gastroenteritis in all age groups in many counties. Recombination of the viral genome is considered as a result of mixed infection of different genotypes of the sapovirus. However, cases of mixed infection i rarely reported. High-throughput nucleotide sequencing, also known as next-generation sequencing (NGS), allows the detection of the genetic diversity of viral pathogens, which requires a specific primer set for efficient detection of mixed infection. This study aimed to design a new primer set to amplify and sequence a whole capsid region of sapovirus and to evaluate whether the mixed infection of different genotypes of sapovirus can be detected.
Methods: Sixty-nine stool samples positive to sapovirus were selected from the specimen
archives collected in a community-based cohort study in the Philippines. Partial capsid region of the sapovirus genome was sequenced by Sanger sequencing method and the genotype was classified by a phylogenetic analysis. Using a newly designed primer set 1245rwf/ TX30SXN, the whole capsid region was also amplified by conventional PCR. Then, the PCR-positive samples are sequenced using Illumina MiSeq. A phylogenetic tree was re-constructed using the sequence of whole capsid region and compared with those of the partial capsid region.
Results: Forty-five out of sixty-nine samples, including 12 genotypes of sapovirus are positive
by conventional PCR using the newly designed primer set (65.2%). The positivity of PCR varied among different genotypes within the limited samples. There was no association between the cycle quantification values and PCR results using 1245rwf/ TX30SXN. From the NGS result, one mixed infection sample was detected and the clustering of the consensus sequence of the sample was confirmed by phylogenetic analysis based on the whole capsid region.
Conclusion: The whole capsid region of the twelve genotypes from four genogroups of human
sapovirus was successfully amplified by 1245rwf/ TX30SXN. Using clinical samples from the Philippines, mixed infection of the different genotypes of sapovirus was detected using NGS. Keywords: sapovirus, mixed infection, high-throughput nucleotide sequencing
2. Introduction
Diarrhea was the eighth leading cause of mortality of all age group in 2016, accounting for about 1.6 million deaths worldwide[1]. Especially, for children younger than 5 years, diarrhea causes 556,000 deaths in 2013 and 446,000 deaths in 2016[2,3]. According to a community-based multi-country cohort study of Malnutrition and Enteric Diseases (MAL-ED) Study in 2018, diarrhea is also significantly associated with child malnutrition[4].
Previously rotavirus was considered as the most important viral etiological agent of moderate-to-severe diarrhea[5]. However, since the rotavirus vaccines have been introduced to over 100 countries and reduced the severity of acute gastroenteritis (AGE) of children, the relative importance and the detection of diarrhea associated with norovirus and sapovirus infection increased[6,7].
Sapovirus was first detected in diarrheal stool samples of children in 1979 by British researchers and then, it was soon considered as a new enteropathogenic virus[8]. Due to an outbreak in Sapporo, Japan, sapovirus was previously called “Sapporo-like virus”[9,10]. Until 2002, it was classified in a species Sapporo virus, genu Sapovirus, within the family
Caliciviridae with other four established genera, including norovirus, lagovirus, nebovirus and
vesivirus[11]. Currently, there is no confirmed replication of sapovirus in cell culture nor a suitable animal model, therefore molecular diagnosis, i.e., PCR assay is the most common method for detection of the virus.
Although, sapovirus is known to cause less severe diarrhea than norovirus and rotavirus[12], the number of reports about the outbreaks that are associated with human sapovirus have been increasing globally, probably by recognition of the pathogen as a cause of diarrhea and implementation of molecular diagnosis. As a consequence, sapovirus infection is broadly recognized as a public health problem[6, 13]. Particularly in low- and middle-income countries, due to the resource-limited condition of hygiene practices, young children have a
high risk of getting infected[15,16]. According to a previous community-based study in Peru, by age two years, more than 80% of children had at least one sapovirus infection, and over 60% of children had at least one sapovirus-associated diarrhea episode[17].
Sapovirus genome is a positive-sense single-stranded RNA genome, which contains two open reading frames (ORFs) with a size from 7.1 thousand base pairs (kb) to 7.7 kb (figure 1). The ORF1 consists of regions encoding polymerase, nonstructural proteins, and viral protein 1 (VP1), which is the major structural capsid protein. According to the VP1 nucleotide sequence, sapovirus has been classified into five genogroups (GI, GII, GIII, GIV and GV), of which four genotypes infect human (GI, GII, GIV and GV)[18] and another genogroup GIII infects animals, such as swine. Human sapovirus GI, GII and GV are further divided into seventeen genotypes: seven for GI (GI.1 to GI.7 ); eight for GII (GII.1 to GII.8) and two for GV (GV.1 and GV.2)[14,19]. With the addition of GIV, which does not have further classification of genotypes, human sapovirus is classified into 18 genotypes in total.
The mixed infections of different genotypes of human sapovirus may happen when different genotypes of human sapovirus infect a single host at the same time and it is well known that the mixed infection of same pathogen is the prerequisite of the occurrence of viral recombination[20]. Therefore, mixed infection of different genotypes of the same virus could result in recombination and then cause an increase in the genetic diversity of the viruses. Recently, it was reported that some sapovirus outbreaks were related with both inter-genogroup and intra-genogroup recombination, which shows the significant importance of sapovirus mixed infection[21, 22]. However, there is scarce information about the frequency or diversity of the intra-host sapovirus mixed infection. One reason is that, the Sanger sequencing, which is the most commonly used method for partial VP1 nucleotides sequencing for genotyping of the human sapovirus, basically reads two sequences from one sample, one from forward primer
and another from reverse primer. Therefore, it is uncommon to be used or detect mixed infection of the different genotypes of sapovirus with Sanger sequencing.
High-throughput nucleotide sequencing, which has also been called next-generation sequencing (NGS) allows us to detect small number of mutations and multiple infections of the same pathogen within a single host[23,24]. It has been used to detect the genetic diversity of viral pathogen, such as human immunodeficiency virus (HIV) and hepatitis C virus (HCV), to help with the understanding of escape mutants, drug resistance development or vaccine design[25]. In recent years, some researchers have reported the sapovirus whole genome sequence by primer-independent NGS[26]. However, there are few reports about sapovirus mixed infection detection using NGS, which may be due to the lack of suitable primer set that can amplify the VP1 region for all the 18 human sapovirus genotypes. Due to the high genetic diversity of human sapovirus, there have been several primer sets designed to detect human sapovirus[19]. Those previously used primer sets, which were multiple primers and degenerate primers, amplify only the partial polymerase region, the junction of polymerase-capsid region or partial capsid region [27,28]. Therefore, in this study, a new primer set, which contains only one forward and one reverse primer, was designed to amplify the whole region of the VP1 (2,200 nucleotides) of all the genotypes of human sapovirus, which have been identified so far. Also, during the analysis of the NGS data of the whole capsid region of human sapovirus, I expect the detection of the mixed infection of different genotypes of human sapovirus in the Philippines.
3. Objectives
This study had two objectives. The first objective was to design a new set of primers to amplify and sequence the whole capsid region of human sapovirus. The second objective was to evaluate whether the mixed infection of different genotypes of human sapovirus can be detected in clinical samples collected from children under 5 years old in the two communities in the Philippines.
4. Methodology
4.1 Study sites
A cohort study was conducted in two communities in the Tarlac province, situated at 130km north from the capital city, Manila, in the Philippines. Study participants residing at Barangay San Nicolas (Population: 8,407) in Tarlac City (Urban) and Barangay San Isidro (Population: 3,106) in La Paz were enrolled.
4.2 Sample collection method
A community-based cohort study of children under two years old and their family members for acute diarrhea in the above-mentioned communities was conducted from August 2014 to August 2018. Households were selected randomly and field workers visited each selected household every working day to interview for the symptoms of acute diarrhea. One regular stool sample was collected once every three months from the cohort children, regardless of whether the cohort child had diarrhea or not. In addition to regular stool sampling, the child and the family members’ stool samples were collected each time a diarrhea episode occurs. Samples were also collected from a control child without diarrhea for at least 7 days prior to
the sample collection and his/her family members. All the stool samples were stored at 4ºC and sent to Research Institution Tropical Medicine (RITM) then stored at -80ºC. The study protocol was approved by the ethics committees of the Research Institute for Tropical Medicine and Tohoku University Graduate School of medicine.
4.3 Detection of sapovirus by real-time reverse transcription PCR
Phosphate-buffered saline (PBS) was used to dilute the stool specimens into 10% suspension, and then the QIAamp Viral RNA Mini Kit plus QIAamp Viral RNA Mini Accessory Set (Qiagen, Germany) was used to extract the viral nucleic acid. To synthesize the complementary DNA (cDNA) from extracted RNA, the mixture of 10 µM of
TX30SXN[29] primer and 10 µM dNTP mixture was heated at 65ºC for 5 minutes (min), followed by at least 1 min cooling on the ice, and then incubated at 25 ºC for 10 min, and at 37 ºC for 75 min after the addition of 5X First-Strand buffer (Invitrogen, USA), 0.1MDTT (Invitrogen, Canada), RNase inhibitor (Invitrogen, Thermo Fisher Scientific, CA, USA) and SuperScript III reverse transcriptase (200 U/µL, Invitrogen, Thermo Fisher Scientific, CA, USA). The mixture was inactivated by incubation at 70 ºC for 15 min.
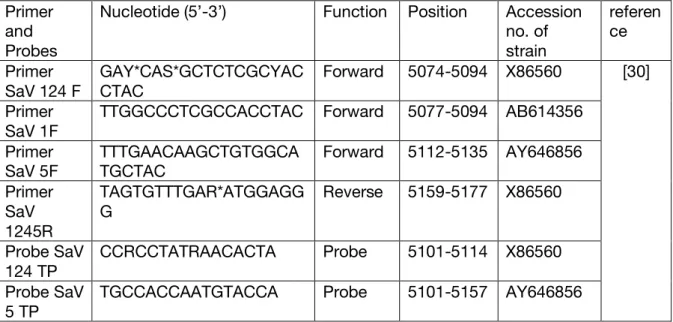
Samples were screened for human sapovirus by real-time PCR using the described primers and TaqMan probes in Table 1[30]. The real-time PCR was performed in an ABI 7500 Fast Real-Time PCR system (Life Technologies, Thermo Fisher Scientific, CA, USA) using the TaqMan Fast Advanced master mix (Life Technologies, Thermo Fisher Scientific, CA, USA). A sample with a quantification cycle (Cq) below 38 was considered as positive for sapovirus in this study.
4.4 Partial capsid region sequencing
Conventional PCR For Partial Capsid Region: To identify the genotypes of sapovirus,
partial capsid region was amplified by nested PCR, prior to the application of the new primer sets. For the first-round PCR, the mixture of 10X Ex Taq buffer (Takara Bio, Kusatsu, Japan), 2.5mM dNTP mixture (Takara Bio, Kusatsu, Japan), cDNA template, and the 10uM of primers F13, F14, 5857-R-1, 5857-R-2 [30,31](Table 2) were vortexed, then the thermocycler was heated at 95ºC for 5 min, followed by 40 cycles of 94ºC for 30 second(s), 50ºC for 30S, 72ºC for 60S, and 72ºC for 60S. For the second-round PCR, 10X Ex Taq buffer, 2.5mM dNTP mixture, and 10uM of primers F1245, 5857-R-1, 5857-R-2 (Table 2) were added to the first PCR product. The mixture was vortexed, heated at 95ºC for 5min and followed by 35 cycles of 94ºC for 30s (seconds), 52ºC for 30s, 72ºC for 60s, and 72ºC for 60s. All the PCR products were separated by electrophoresis on 1% agarose gel and then visualized under UV light after staining with ethidium bromide.
Sanger sequencing: Samples tested positive by nested PCR were sequenced using the Sanger
method. Residual primers and free nucleotides were removed by mixing PCR product with RNase free water and Illustra ExoProStar enzyme (GE Healthcare, Buckinghamshire, United Kingdom). Nucleotide sequencing by Sanger dideoxy technique was performed using Big Dye Terminator version 1.1 cycle sequencing kit and Genetic Analyzer 3730 (Applied Biosystems, Foster City, USA). To genotype the collected samples, the sequenced partial capsid region was aligned together with other reference sequences and phylogenetic trees were constructed by the neighbor-joining method with the Kimura 2 parameter settings using the Molecular Evolutionary Genetics Analysis version 7 (MEGA7)[32].
4.5 Sample selection for whole capsid sequencing
In total, 6,276 stool samples from 383 cohort children and 1,044 family members were collected during the study period. Of those, 509 samples were positive to sapovirus using real-time PCR. To validate a new design primer set of 1245rwf/TX30SN and to obtain enough DNA concentration for the NGS sample preparation, all samples of which the Cq value from sapovirus real-time PCR was less than 30 and the genotypes were defined by the partial capsid sequencing using Sanger sequencing method, were included. To increase the number of representative genotypes, two GI.7 samples collected in Peru were tested by conventional PCR using newly designed primer set. In total, 69 sapovirus samples were selected: GI.1(n=8), GI.2(n=7), GI.3(n=1), GI.4(n=3), GI.6(n=8), GI.7(n=2), GII.1(n=6), GII.3(n=8), GII.4(n=5), GII.6(n=5), GIV(n=5), GV.1(n=11). Within the 69 samples, 44 samples from 15 families ( one family requires two or more family member samples in the same episode) were included.
4.6 Whole capsid region sequencing
Primer design: To design a new set of primers targeting the whole capsid region of human
sapovirus, reference sequences were downloaded from GenBank and analyzed in MEGA7 to identify the appropriate site of forward primer. A short region located at 5159-5177 was considered as candidate the forward primer position. At the same time, I found that Oka et al. has recently developed a set of primers and probes for broadly reactive real-time RT-PCR for human sapovirus [33] and the primer HuSaV-R (CCYTCCATYTCAAACACTA) which works as reverse primer in his study is at same position as my new designed forward primer. The complementary base pair of this HuSaV-R primer was designed and named as 1245rwf in this study. Due to the high genetic diversity of capsid region of human sapovirus, the primer TX30SXN which binds at poly A tail of RNA sequences was used as the reverse primer in this study. This newly designed primer set was aimed at amplifying the whole capsid region (major
capsid protein, VP1 and minor structural protein, VP2) (Figure 2) of all genotypes of human sapovirus. All the sequences and additional information about the primers are described in Table 3. The location of the forward primer 1245rwf and primer HuSaV-R is shown in the Supplemental files.
Conventional PCR For Whole Capsid Region: Conventional PCR was performed to amplify
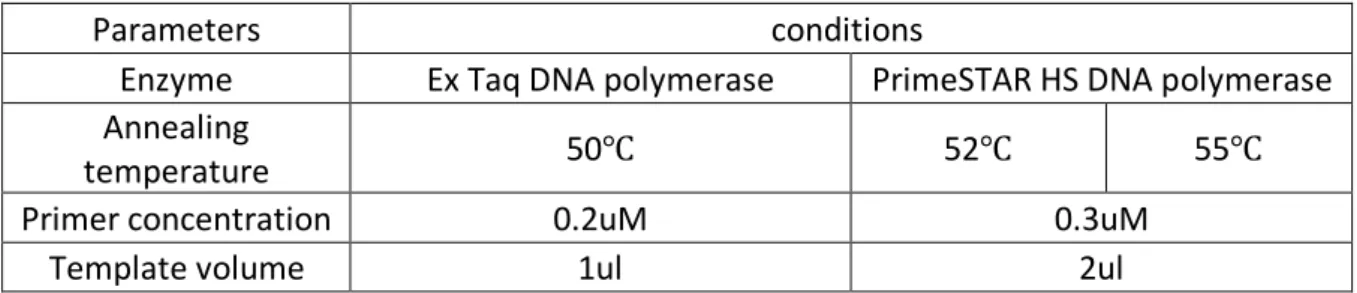
the whole sapovirus VP1 capsid region. To identify the best condition of conventional PCR, the optimizations has been done. The optimized parameters were shown in table 4. Finally, the PrimeStar HS DNA polymerase (Invitrogen, CA, USA), 52 ºC annealing temperature, 0.3uM primer concentration and 1ul template volume were selected. The mixture of PrimeStar, RNase-free water, 5X PrimeStar buffer (Invitrogen, CA, USA), 2.5mM dNTP mixture (Takara, Beijing China), cDNA template, and primers 1245rwf and TX30SXN was vortexed, then heated at 98ºC for 1min and followed by 40 cycles of 98ºC for 10s, 52ºC for 15s, 72ºC for 2min 45s, 72ºC for 7min. All the PCR products were visualized by electrophoresis on 1% agarose gel.
High-Throughput Nucleotide Sequencing (NGS): The samples that were positive to the
PCR assay with 1245rwf/TX30SN primer set were further selected for NGS analysis. Aiming to investigate whether the different genotypes of sapovirus were shared within family members, samples from the same family collected within 7 days apart from each other were included. If the samples of the same genotype from the different family of the same community were detected within three months, only one of them was included. The DNA concentration of all the PCR products was measured by Qubit HS DNA kit (Thermo Fisher Scientific, CA, USA) and samples with DNA concentration lower than 0.2 ng/µl were excluded. DNA was tagmented and indexed adapters were ligated to amplicons by limited-cycle PCR using Nextera DNA Library Prep Kit (Illumina, CA, USA). AMpure XP magnetic beads (Agencourt AMpure
XP; Beckman Coulter, CA, USA) were used to clean-up amplified library. DNA library insert size distribution between 300 and 500 base pairs (bp) was confirmed by using Agilent 2100 Bioanalyzer (Agilent technology, CA, USA). Libraries were pooled at equimolar concentration (2nM), denatured and diluted to 8pM before loading into the Miseq Flowcell. A 2x250bp paired-end protocol was used according to the manufacturer’s instructions (Illumina, SD, USA).
Adapter-ligated PhiX library was used as a control for Illumina sequencing runs.
4.7 Sequences analysis and multiple genotype detection
Based on all the whole capsid sequences of all genotypes of human sapovirus which are available in the database of National Center Biotechnology Information (NCBI), a local database was created using CLC genomics workbench 10 (CLC bio). This created database includes 244 sequences of 18 genotypes.
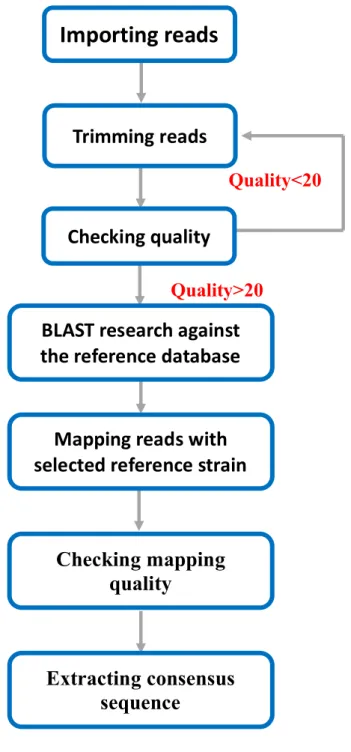
Demultiplexed reads were imported to CLC Genomics Workbench version 10 (CLC bio) for the NGS data analysis. Low-quality reads (quality<20) and short reads (length<100bp) were trimmed prior analysis. After trimming, the quality control (QC) report of each sample was checked. If the quality of all reads is more than 20, it was considered as acceptable quality. Otherwise, if the quality of some reads is less than 20, this sample would be trimmed again until the quality achieve 20. The quality-trimmed sample reads were further analyzed using BLAST search against the human sapovirus local database. The sapovirus strain (genotype), which has the highest BLAST hits frequency, was selected as reference strain for mapping. Those quality-trimmed reads were mapped to the reference strain by the mapping tool of CLC genomics workbench (CLC bio). Then, a consensus whole capsid sequence was extracted from the mapped reads. After mapping, position average depth and the coverage were checked. The process of NGS data analysis was summarized in a flow-chart shown in Figure 3.
The BLAST result was used as one evidence of mixed-infection detection. The sample which has more than one major genotype after BLAST was considered as a sample with a possibility of mixed infection. If the BLAST hits frequency was less than 1% of total number of reads, this genotype was not counted as minor genotype and this sample was not counted as a mixed infection sample neither. The comparison of genetic p-distance of the consensus sequences was computed as the second evidence of mixed-infection. A p-distance of more than 0.16 is required to differentiate between the two different genotypes[30]. To confirm the reliability of the detection method during NGS analysis, a positive control sequence file representing human sapovirus mixed infection was generated artificially (see supplemental files) and the phylogenetic tree was constructed for the different consensus sequences by MEGA 7 software.
4.8 Statistical Analysis
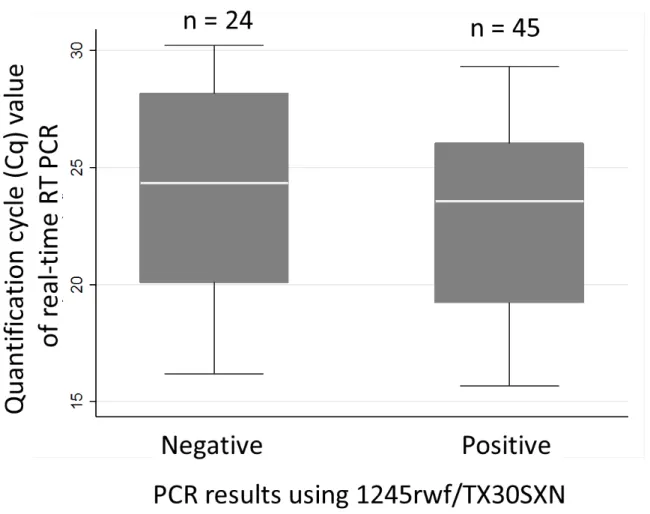
Quantification cycle of the real-time (RT PCR) were compared between samples tested positive and negative by PCR with new 1245rwf/TX30SXN primers, using Mann-Whitney U test for all the samples, as implemented in Stata Statistical Software: Release 13. (StataCorp, TX, USA). A p-value of < 0.05 was considered as significant. The boxplot analysis was performed in Microsoft Excel 2016 (Microsoft, NY, USA).
5. Results
5.1 PCR results
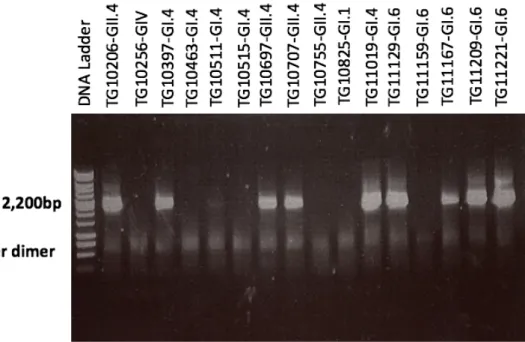
The conventional PCR using the 1245rwf/ TX30SXN primer set was positive in 45 samples out of 69 selected samples and part of the conventional PCR result visualized by
electrophoresis on 1% agarose gel is shown in figure 4. At least one of the samples of each genotype (in total, 12 genotypes were included) were successfully amplified using the 1245rwf/ TX30SXN primer set. The total positivity rate of the 1245rwf/ TX30SXN primer set was 65.2%. Among all the genotypes, the samples with genotypes GI.3, G1.7 and GII.4 were 100% positive in the PCR with 1245rwf/ TX30SXN. However, two genotypes, GII.3 (2/8; 25%) and GIV (1/5; 20%), have relatively low positive rate (Figure5).
When the Cq values were compared between those PCR positive samples (n=45) and conventional PCR negative samples (n=24), there was no difference in the median of the Cq values (24.5 v.s 23.6, p = 0.296) (figure 6).
5.2 Phylogenetic analysis based on the partial capsid sequence
Among all the 45 PCR-positive samples, there are only 28 samples qualified for further NGS analysis. Due to the decrease of DNA concentration during the library preparation and repeated detection of same genotype within three months in the same community, the other 17 samples were excluded. Partial capsid genome sequence (approximately 719 nucleotides) of those 28 samples were used to construct a phylogenetic tree. As shown in Figure 7, the phylogenetic tree was constructed with 62 sapovirus partial capsid sequences, including 34 reference sequences downloaded from GenBank. In this phylogenetic tree, sixteen genotypes from four genogroups were shown, and the 28 samples are classified into twelve genotypes.
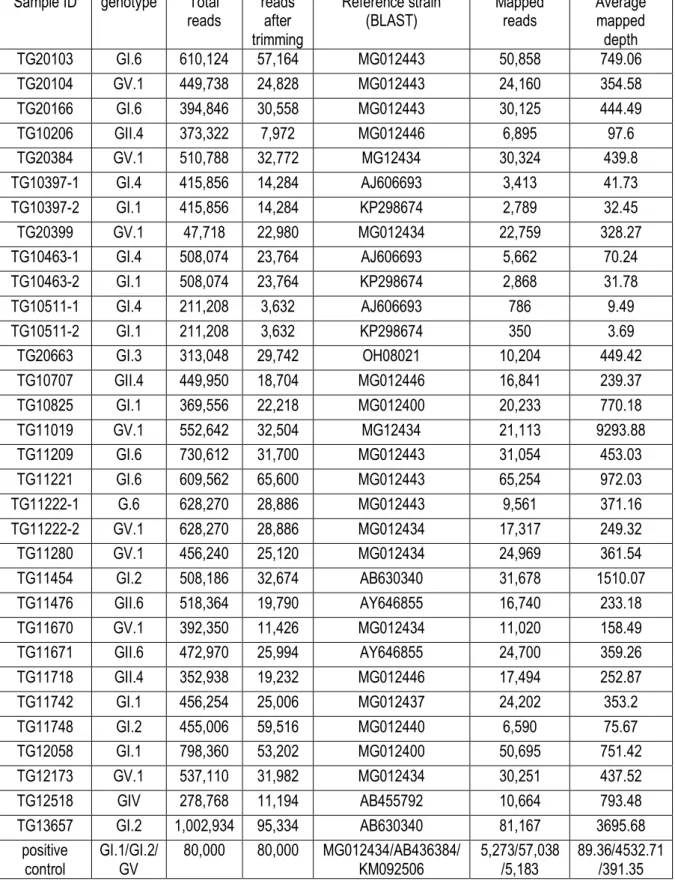
5.3 Mixed-infection detection
The overall information of NGS analysis results of all the sequence reads of the whole capsid region of the 28 samples were shown in Table 4. After trimming, the number of the reads of the tested samples were decreased, such as TG10206 (nb=373,322; na=7,972; rq=2.1%); TG10511 (nb=211,208; na=3,632; rq=1.7%); TG10707 (nb=449,950; na=18,704;
rq=4.2%); TG11670 (nb=392,350; na=11,426; rq=2.9%) and TG12518 (nb=278,768; na=11,194; rq=4.0%). Including the positive control, all the reads of every sample were able to be mapped to at least one reference strain. The GenBank accession number of the reference strains are also shown in table 5.
After the BLAST search of the reads against the sequence database of human sapovirus whole capsid region, multiple sapovirus genotypes were detected in four samples out of the 28 samples. After mapping to the reference of each genotype, 27 complete consensus sequences of whole capsid region (1,764-nuleotides) were available in 26 samples, including two different genotypes of GI.6 and GV.1 from TG11222.
Although the results of the BLAST search suggested the existence of two genotypes of GI.1 and GI.4 in three samples of TG10511, TG10436 and TG10397, all the three had poor quality of mapping result, with the small number of mapped reads and low average mapped depth. For example, TG10511 had only 350 and 786 reads which are able to be mapped to the two reference strains from two genotypes, GI.1 reference strain (GenBank accession number: KP298674) and GI.4 reference strain (GenBank accession number: AJ 606693), but its average depth was only 3.7 and 9.5, respectively. TG10463 also had only 2868 reads which were mapped to the GI.1 reference strain (GenBank accession number: KP298674) with an average depth of 31.78. TG10397 had only 2798 reads which were mapped to the GI.1 reference strain (GenBank accession number: KP298674) with an average depth of 32.5. When only the partial capsid region (719 bp), which is commonly used for genotyping, was considered, only less than 450bp, 500 bp, and 580bp were mapped in TG10511, TG10436 and TG10397, respectively. By comparing the difference in P-distance between the partial capsid consensus sequences from GI.1 and GI.4 reference strain with MEGA 7 software, the results were < 0.010 for all the three samples. Considering the cut-off of the P-distance for the same genotype (< 0.169) [34], those three samples with incomplete consensus sequences of the GI.1 were not
considered as the mix infection of the GI.1. and GI.4. Only one consensus sequence of GI.4 was available from one of these three samples. Based on the partial capsid sequencing using Sanger method, all the three samples were classified as GI.4.
The relative frequencies of sapovirus genotypes based on the number of reads defined by the BLAST search were shown in Figure 8. All the three different genotypes included in the positive control were detected and the distribution of the reads of those three genotypes were close to the original design (GI.1, pn=28.8%; GI.2, pn=64.7%; GV.1, pn=6.5%). The three samples with low number of reads and poor quality of mapping were excluded from the figure. Finally, one sample (TG11222) out of 25 samples was suspected to be a mixed infection of the different genotypes of GI.6 (on=36%) and GV.1 (pn=64.4%)
There are six samples from three families were included in the NGS analysis, TG20103 (GI.6) and TG20104 (GI.6); TG11221(GI.6) and TG11222 (GI.6& GV.1); and TG1670 (GV.1) and TG1671(GII.6), and one of them was detected as mixed infection of human sapovirus GV.1 and GI.6.
5.4 Phylogenetic analysis based on whole capsid sequence
The phylogenetic tree was constructed using whole capsid genome sequence, including 27 consensus sequence from 26 samples and 34 reference sequence (Figure 9). Sixteen genotypes from four genogroups were shown, and the samples are classified into eleven different genotypes: GI.1(n=3), GI.2(n=3), GI.3(n=1), GI.4(n=1), GI.6(n=5), GII.4(n=3), GII.6(n=2), GIV(n=1), GV.1(n=8). There were three samples with discordant genotyping result between the partial capsid region sequence by Sanger sequence and whole capsid region sequence by NGS.The phylogenetic tree shows that the two consensus sequences of TG11222 belong to different genotypes (GI.6 & GV.1), which is concordant results from the BLAST result and the mixed infection of different genotypes of sapovirus in a single host was highly
suspected. There were three samples with discordant genotyping result between partial capsid region sequence by Sanger sequence and whole capsid region sequence by NGS.
6. Discussion
The 1245rwf/ TX30SXN designed in this study successful in amplifying the whole capsid region of twelve different genotypes of human sapovirus: GI.1, GI.2, GI.3, GI.4, GI.6, GI.7, GII.1, GII.3, GII.4, GII.6, GIV and GV.1. All the four genogroups of human sapovirus are amplified. In the past, it is difficult to detect some novel variants of human sapovirus. E. Gonzales-Gustavson, et al. , has used the primer-independent whole genome sequencing with NGS method [35]. However, the usage of independent primer for different genotypes in this method remains a challenge in the detection of mixed infection of different genotypes of human sapovirus. In 2015, Shibata and Sekizuka used the non-primer NGS method to sequence for the first time the whole genome of human sapovirus GV.2[26]. This method requires a high viral titer of clinical samples and could not be broadly used. To overcome this limitation, in 2018, Diez-Valcarce, et al. added a sequence-independent single primer amplification (SISPA) before NGS to increase the RNA concentration in the whole genome sequencing of human sapovirus. In addition to the higher cost and longer time duration needed, according to the to another research, this method still has a limitation on viral titer[36]. In this study, only a simple conventional PCR was conducted before the Illumina MiSeq NGS method and whole capsid genome sequences were generated. Compared to other methods mentioned above, the first advantage of this study is that this method is an amplicon sequencing, which increase the viral titer of the clinical samples. However, the sensitivity of the new primer set 1245rwf/TX30SXN was relatively low, which requires further improvement in future studies. The Cq value of
samples was not associated with the result of conventional PCR with 1245rwf/TX30SXN within samples with relatively high viral load as Cq <30. Since the partial capsid sequence of the samples which are not able to be amplified by the new primer set 1245rwf/TX30SXN are available, further analysis of the primer 1245rwf and those samples should be done. Also, because the forward primer 1245rwf is a degenerate primer and all the optimizations of the conventional PCR were based on the normal protocol, further optimization studies will be performed.
In this study, one clinical sample from the Philippines, TG11222, was found to be a mixed infection of human sapovirus GI.6 and GV. This result shows the feasibility of the newly designed primer set combined with NGS for the detection of mixed infection based on whole capsid region of human sapovirus. From other researches about hepatitis C and HIV, it is easy to find that the mixed infection of different genotypes of same virus plays a very important role in many aspects. For example, in the treatment of guidelines for HCV infections, the introduction of antiviral drugs that target specific viral proteins will vary from the different mixed infected genotypes of hepatitis C virus (HCV)[42,43]. Also, such as rotavirus, of which different genotypes of rotavirus have different immunity reaction, mixed infection is important in vaccine developing and the evaluation of the vaccine program[39]. The sample TG11222, which was collected from a child with mixed genotype, GI.6 and GV sapovirus infection and the sample TG11221, which was collected together with the child’s family member with GI.6 infection during the same diarrhea episode, would indicate that different genotypes of human sapovirus were transmitted within family members in the same household. Although, there are few reports about human sapovirus mixed infection of different genotypes so far, and no treatment nor vaccine have been developed for sapovirus infection control, this study highlights that more attention is needed in the detection of the mixed infection of human sapovirus in an individual.
During BLAST search, the three samples, TG10397, TG10463 and TG10511, were also found to have GI.1 and GI.4 in multiple BLAST results, but finally turned out that it may not be mixed infection of human sapovirus GI.1 and GI.4 but only pure GI.4 infection. This situation may happen because of the small number of reads mapped and the low average depth, only a short partial capsid sequence was available and no complete consensus strain for whole capsid region was available for neither GI.1 nor GI.4 in all the three samples. The possible reason for this unsuccessful consensus sequence extraction was that the original NSG reads quality was relatively low, and after trimming the reads are not enough for mapping a whole capsid region of human sapovirus, which may also because the trimming condition is very stringent that many valuable reads were discarded. Another possible reason is the lack of GI.4 reference strain during NGS result analysis. From GenBank in NCBI website, there is only one GI.4 strain which contains the whole capsid region sequence (GenBank accession number: AJ606693) so as the same as the one in the human sapovirus whole capsid database that I used in NGS analysis. This would result in one situation that most of the GI.4 reads were mis-matched to the GI.1 reference strain when reads mapping to the reference strain. Also, the discordant of result of the two samples would be further analyzed.
7. Limitation
The first limitation of this study is the unavailability of the clinical samples for several genotypes of human sapovirus (GI.5, GII.2, GII.5, GII.7, GII.8, GV.2) that were not tested with the 1245rwf/ TX30SXN primer set, of which some strains have been detected in several outbreaks and hospitalized samples[36,38,45]. Although, the forward primer was based on the recently introduced reverse primer to detect GII.7, GII.8 and GV.2, which have been poorly
detected by the previous assay system[37,39], the sensitivity to these genotypes should be confirmed. The second limitation is that during the conventional PCR, the Cq value of all the selected samples are less than 30 and only samples with known genotype by the partial capsid sequencing was included. Also, before NGS, no mixed infection positive RNA sample was prepared. Specificity test of the 1245rwf/ TX30SXN was not done. To confirm the detection of mixed infection using NGS, in vitro study, such as the detection of different genotype by cloning is probably needed.
8. Conclusion
The sequence of whole capsid region of twelve genotypes from four genogroups of human sapovirus was successfully determined using the 1245rwf/ TX30SXN. The role and impact of the mixed infection of sapovirus in a single host on the human gastroenteritis should be defined in future studies.
9. Acknowledgements
I am highly grateful to Professor Hitoshi Oshitani for all the support and guidance from him during my two years study in Department of Virology, Graduate School of
Medicine, Tohoku University, Sendai. I am also profoundly indebted to my supervisor Saito Mayuko. Her guidance and patience always help me to enhance my study motivation and scientific thinking. I would like to thank all the lab mates and staff of Department of
for Tropical Medicine (AFTM) staff for helping collecting clinical samples. After all, I express my gratitude to JASSO scholarship and MEXT scholarship to support my study and life in Japan.
10. Reference
[1] A. Alemu Abajobir et al., “1151 Global, regional, and national age-sex specific mortality for 264 causes of death, 1980–2016: a systematic analysis for the Global Burden of Disease Study 2016,” 2017.
[2] L. Liu et al., “Global , regional , and national causes of child mortality in 2000 – 13 , with projections to inform post-2015 priorities : an updated systematic analysis,”
Lancet, vol. 385, no. 9966, pp. 430–440, 2015.
[3] C. Troeger et al., “Estimates of the global, regional, and national morbidity, mortality, and aetiologies of diarrhoea in 195 countries: a systematic analysis for the Global Burden of Disease Study 2016,” Lancet Infect. Dis., 2018.
[4] J. A. Platts-Mills et al., “Use of quantitative molecular diagnostic methods to assess the aetiology, burden, and clinical characteristics of diarrhoea in children in low-resource settings: a reanalysis of the MAL-ED cohort study,” Lancet Glob. Heal., 2018.
[5] U. D. Parashar, C. J. Gibson, J. S. Bresee, and R. I. Glass, “Rotavirus and severe childhood diarrhea,” Emerg. Infect. Dis., 2006.
[6] M. Hemming, S. Räsänen, L. Huhti, M. Paloniemi, M. Salminen, and T. Vesikari, “Major reduction of rotavirus, but not norovirus, gastroenteritis in children seen in hospital after the introduction of RotaTeq vaccine into the National Immunization Programme in Finland,” Eur. J. Pediatr., vol. 172, no. 6, pp. 739–746, 2013.
[7] D. C. Payne et al., “Effectiveness of pentavalent and monovalent rotavirus vaccines in concurrent use among US children <5 years of age, 2009-2011,” Clin. Infect. Dis., vol. 57, no. 1, pp. 13–20, 2013.
[8] C. R. Madeley, “Comparison of the features of astroviruses and caliciviruses seen in samples of feces by electron microscopy,” J. Infect. Dis., 1979.
[9] S. Chiba et al., “An outbreak of gastroenteritis associated with calicivirus in an infant home,” J. Med. Virol., 1979.
[10] S. Chiba et al., “Fecal shedding of virus in relation to the days of illness in infantile gastroenteritis due to calicivirus,” J. Infect. Dis., 1980.
[11] E. Knipe D.M., Howley P.M., Field Virology. 5th edition. 2007.
[12] Y. Sakai, S. Nakata, S. Honma, M. Tatsumi, K. Numata-Kinoshita, and S. Chiba, “Clinical severity of Norwalk virus and Sapporo virus gastroenteritis in children in Hokkaido, Japan,” Pediatr. Infect. Dis. J., 2001.
[13] E. J. Klein, R. Selvarangan, and P. H. Azimi, “HHS Public Access,” vol. 57, no. 1, pp. 13–20, 2015.
[14] M. Diez-Valcarce et al., “Genetic diversity of human sapovirus across the Americas,”
J. Clin. Virol., vol. 104, pp. 65–72, Jul. 2018.
[15] J. Vinjé et al., “ Natural History of Human Calicivirus Infection: A Prospective Cohort Study ,” Clin. Infect. Dis., vol. 35, no. 3, pp. 246–253, 2002.
[16] D. Leblanc, G. D. Inglis, V. F. Boras, J. Brassard, and A. Houde, “The prevalence of enteric RNA viruses in stools from diarrheic and non-diarrheic people in southwestern Alberta, Canada,” Arch. Virol., 2017.
[17] G. J. Sánchez et al., “Epidemiology of Sapovirus Infections in a Birth Cohort in Peru,”
Clin. Infect. Dis., vol. 66, no. 12, pp. 1858–1863, 2018.
[18] T. Oka et al., “Human sapovirus classification based on complete capsid nucleotide sequences,” Arch. Virol., vol. 157, no. 2, pp. 349–352, 2012.
[19] T. Oka, Q. Wang, K. Katayama, and L. J. Saifb, “Comprehensive review of human sapoviruses,” Clin. Microbiol. Rev., vol. 28, no. 1, pp. 32–53, 2015.
[20] M. Worobey and E. C. Holmes, “Evolutionary aspects of recombination in RNA viruses,” Journal of General Virology. 1999.
[21] H. G.S., T. N., O. T., O. M., H. K.-O., and K. K., “Intergenogroup recombination in sapoviruses,” Emerg. Infect. Dis., vol. 11, no. 12, pp. 1916–1920, 2005.
[22] D. P. Martin, B. Murrell, M. Golden, A. Khoosal, and B. Muhire, “RDP4: Detection and analysis of recombination patterns in virus genomes,” Virus Evol., vol. 1, no. 1, pp. 1–5, 2015.
[23] M. Gan, Q. Liu, C. Yang, Q. Gao, and T. Luo, “Deep whole-genome sequencing to detect mixed infection of mycobacterium tuberculosis,” PLoS One, vol. 11, no. 7, pp. 1–14, 2016.
[24] N. Beerenwinkel and O. Zagordi, “Ultra-deep sequencing for the analysis of viral populations,” Current Opinion in Virology. 2011.
[25] J. A. Klappenbach et al., “HCV Genotyping from NGS Short Reads and Its
Application in Genotype Detection from HCV Mixed Infected Plasma,” PLoS One, vol. 10, no. 4, p. e0122082, 2015.
[26] S. Shibata et al., “Complete Genome Sequence of a Novel GV.2 Sapovirus Strain, NGY-1, Detected from a Suspected Foodborne Gastroenteritis Outbreak,” Genome
Announc., 2015.
[27] D. Sano et al., “Quantification and Genotyping of Human Sapoviruses in the Llobregat River Catchment, Spain,” Appl. Environ. Microbiol., 2011.
[28] T. Farkas et al., “Genetic diversity among sapoviruses,” Arch. Virol., 2004.
[29] X. Liu et al., “Molecular detection and characterization of sapovirus in hospitalized children with acute gastroenteritis in the Philippines,” J. Clin. Virol., vol. 68, pp. 83– 88, 2015.
[30] T. Oka et al., “Detection of human sapovirus by real-time reverse transcription-polymerase chain reaction,” J. Med. Virol., 2006.
[31] M. Okada, Y. Yamashita, M. Oseto, and K. Shinozaki, “The detection of human sapoviruses with universal and genogroup-specific primers,” Arch. Virol., 2006. [32] S. Kumar, G. Stecher, and K. Tamura, “MEGA7: Molecular Evolutionary Genetics
Analysis Version 7.0 for Bigger Datasets.,” Mol. Biol. Evol., 2016.
[33] T. Oka et al., Broadly reactive real-time reverse transcription-polymerase chain
reaction assay for the detection of human sapovirus genotypes, vol. 91, no. 3. 2019.
[34] T. Oka, Q. Wang, K. Katayama, and L. J. Saifb, “Comprehensive review of human sapoviruses,” Clin. Microbiol. Rev., vol. 28, no. 1, pp. 32–53, 2015.
[35] E. Gonzales-Gustavson et al., “Identification of sapovirus GV.2, astrovirus VA3 and novel anelloviruses in serum from patients with acute hepatitis of unknown aetiology,”
PLoS One, 2017.
[36] M. Diez-Valcarce et al., “Genetic diversity of human sapovirus across the Americas,”
J. Clin. Virol., vol. 104, no. May, pp. 65–72, 2018.
[37] S. Chevaliez, M. Bouvier-Alias, R. Brillet, and J. M. Pawlotsky, “Hepatitis C virus (HCV) genotype 1 subtype identification in new HCV drug development and future clinical practice,” PLoS One, 2009.
[38] Y. C. Yang, D. Y. Wang, H. F. Cheng, E. Y. Chuang, and M. H. Tsai, “A reliable multiplex genotyping assay for HCV using a suspension bead array,” Microb.
Biotechnol., 2015.
[39] B. Lee et al., “Histo–Blood group antigen phenotype determines susceptibility to genotype-specific rotavirus infections and impacts measures of rotavirus vaccine efficacy,” J. Infect. Dis., vol. 217, no. 9, pp. 1399–1407, 2018.
[40] M. Hergens et al., “Investigation of a food-borne outbreak of gastroenteritis in a school canteen revealed a variant of sapovirus genogroup V not detected by standard
PCR, Sollentuna, Sweden, 2016,” Eurosurveillance, vol. 22, no. 22, pp. 1–8, 2017. [41] S. Iizuka et al., “Detection of sapoviruses and noroviruses in an outbreak of
gastroenteritis linked genetically to shellfish,” J. Med. Virol., 2010.
[42] T. Oka, Y. H. Doan, K. Haga, K. Mori, T. Ogawa, and A. Yamazaki, “Genetic characterization of rare genotype GII.5 sapovirus strain detected from a suspected food-borne gastroenteritis outbreak among adults in Japan in 2010,” Japanese Journal
of Infectious Diseases. 2017.
[43] R. Nakagawa-Okamoto et al., “Detection of multiple sapovirus genotypes and genogroups in oyster-associated outbreaks,” Jpn. J. Infect. Dis., 2009.
[44] X. Liu et al., “Etiological Role and Repeated Infections of Sapovirus among Children Aged Less than 2 Years in a Cohort Study in a Peri-urban Community of Peru,” J.
11. Figures and Tables
Table 1. Primers and probes used for real-time reverse transcription polymerase chain reaction (RT PCR)
*“Y” is one nucleotide from The International Union of Pure and Applied Chemistry (IUPAC) nucleotide codes, representing either C or T;
“S” is one nucleotide from The International Union of Pure and Applied Chemistry (IUPAC) nucleotide codes, representing either G or C.
“R” is one nucleotide from The International Union of Pure and Applied Chemistry (IUPAC) nucleotide codes, representing either G or A.
Primer and Probes
Nucleotide (5’-3’) Function Position Accession no. of strain referen ce Primer SaV 124 F GAY*CAS*GCTCTCGCYAC CTAC Forward 5074-5094 X86560 [30] Primer SaV 1F
TTGGCCCTCGCCACCTAC Forward 5077-5094 AB614356 Primer SaV 5F TTTGAACAAGCTGTGGCA TGCTAC Forward 5112-5135 AY646856 Primer SaV 1245R TAGTGTTTGAR*ATGGAGG G Reverse 5159-5177 X86560 Probe SaV 124 TP CCRCCTATRAACACTA Probe 5101-5114 X86560 Probe SaV 5 TP
Table 2. Primers used for partial capsid sequencing Primer or
probe Nucleotide (5’-3’) Function Position Accession no. of strain Reference
SV-F13 GAYYW*GGCYCTCGCY
ACCTAC First-round forward 5074-5094 X86560 [31]
SV-F14 GAACAAGCTGTGGCAT
GCTAC First-round forward 5074-5094 X86560 SaVF1245 TAGTGTTTGARATGGA GGG Second-round forward 5159-5177 X86560 [30] SaV5857R -1 CWGGD*GAN*AYH*CCA TTBTCCAT Reverse 5857-5876 X86560 [31] SaV5857R -2 GGNGANM*NNCCRTTN TSCAT Reverse 5857-5876 X86560
* “W” is one nucleotide from The International Union of Pure and Applied Chemistry (IUPAC) nucleotide codes, representing either T or A.
“D” is one nucleotide from The International Union of Pure and Applied Chemistry (IUPAC) nucleotide codes, representing either T or A or G.
“N” is one nucleotide from The International Union of Pure and Applied Chemistry (IUPAC) nucleotide codes, representing any base.
“H” is one nucleotide from The International Union of Pure and Applied Chemistry (IUPAC) nucleotide codes, representing either T or A or C.
“M” is one nucleotide from The International Union of Pure and Applied Chemistry (IUPAC) nucleotide codes, representing either C or A.
Table 3. Primers used for whole capsid amplification Primer or
probe
Nucleotide (5’-3’) Function Position Accession no. of strain
Reference
1245rwf TAGTGTTTGARATGGARGG Forward 5159-5177 X86560 Current
study
TX30SXN GACTAGTTCTAGATCGCGAG
Table 4. Optimization parameters of conventional PCR with new primer set 1245rwf and TX30SXN.
Parameters conditions
Enzyme Ex Taq DNA polymerase PrimeSTAR HS DNA polymerase
Annealing
temperature 50℃ 52℃ 55℃
Primer concentration 0.2uM 0.3uM
Figure 1. Diagram of sapovirus genomic organization based on the GI.1 Manchester strain (GenBank accession no. X86560) includes two open reading frames (ORF1 and ORF2). The part of the ORF1 encodes nonstructural proteins (NS) protease-RNA-dependent RNA polymerase (RdRp) and major structural proteins (VP1), and ORF2 encodes some minor structural proteins.
Figure 2. Diagram of sapovirus genomic organization and the target regions for real-time PCR and conventional PCR based on the GI.1 Manchester strain
Figure 3. Flowchart of high-throughput nucleotide sequencing analysis Quality<20 Quality>20
Importing reads
Trimming reads
Checking quality
BLAST research against
the reference database
Mapping reads with
selected reference strain
Checking mapping
quality
Extracting consensus
sequence
Figure 4. Part of the conventional PCR result visualized by electrophoresis on 1% agarose gel.
F igu re 5 . T h e P C R r es u lt s for w h ol e cap si d r egi on of s ap ovi ru s u si n g ne w pr im er s et 1245r w f/ T X 30S X N b y ge n ot yp es . No te : T h e sa p ovi ru s ge n ot yp es w er e d ef in ed b y P C R an d S an ge r se q u en ce o f p ar ti al c ap si d re gi on ( 719 -n u cl eot id es n t)
Figure 6. The relation between PCR results using 1245rwf/TX30SXN and Cq values of real-time RT PCR.
The length of the whisker is the distance of 1.5 times the interquartile range (IQR) above the 75th percentile and 1.5 times the IQR below the 25th percentile.
Table 5. The comprehensive information of high-throughput nucleotide sequencing multiple BLAST results
Sample ID genotype Total
reads reads after trimming
Reference strain
(BLAST) Mapped reads Average mapped depth TG20103 GI.6 610,124 57,164 MG012443 50,858 749.06 TG20104 GV.1 449,738 24,828 MG012443 24,160 354.58 TG20166 GI.6 394,846 30,558 MG012443 30,125 444.49 TG10206 GII.4 373,322 7,972 MG012446 6,895 97.6 TG20384 GV.1 510,788 32,772 MG12434 30,324 439.8 TG10397-1 GI.4 415,856 14,284 AJ606693 3,413 41.73 TG10397-2 GI.1 415,856 14,284 KP298674 2,789 32.45 TG20399 GV.1 47,718 22,980 MG012434 22,759 328.27 TG10463-1 GI.4 508,074 23,764 AJ606693 5,662 70.24 TG10463-2 GI.1 508,074 23,764 KP298674 2,868 31.78 TG10511-1 GI.4 211,208 3,632 AJ606693 786 9.49 TG10511-2 GI.1 211,208 3,632 KP298674 350 3.69 TG20663 GI.3 313,048 29,742 OH08021 10,204 449.42 TG10707 GII.4 449,950 18,704 MG012446 16,841 239.37 TG10825 GI.1 369,556 22,218 MG012400 20,233 770.18 TG11019 GV.1 552,642 32,504 MG12434 21,113 9293.88 TG11209 GI.6 730,612 31,700 MG012443 31,054 453.03 TG11221 GI.6 609,562 65,600 MG012443 65,254 972.03 TG11222-1 G.6 628,270 28,886 MG012443 9,561 371.16 TG11222-2 GV.1 628,270 28,886 MG012434 17,317 249.32 TG11280 GV.1 456,240 25,120 MG012434 24,969 361.54 TG11454 GI.2 508,186 32,674 AB630340 31,678 1510.07 TG11476 GII.6 518,364 19,790 AY646855 16,740 233.18 TG11670 GV.1 392,350 11,426 MG012434 11,020 158.49 TG11671 GII.6 472,970 25,994 AY646855 24,700 359.26 TG11718 GII.4 352,938 19,232 MG012446 17,494 252.87 TG11742 GI.1 456,254 25,006 MG012437 24,202 353.2 TG11748 GI.2 455,006 59,516 MG012440 6,590 75.67 TG12058 GI.1 798,360 53,202 MG012400 50,695 751.42 TG12173 GV.1 537,110 31,982 MG012434 30,251 437.52 TG12518 GIV 278,768 11,194 AB455792 10,664 793.48 TG13657 GI.2 1,002,934 95,334 AB630340 81,167 3695.68 positive
Figure 7. The Phylogenetic tree based on the partial capsid region nucleotide sequence (719 nucleotide). The phylogenetic tree was inferred using neighbor-joining method d with 1,000 bootstrap replications using MEGA 7 software.
Represents samples tested in this study
AB622439.1 GI.1 Tokyo 2008
AY646853.2 GI.1 Nongkhahi Thailand 2002 MG012435.1 GI.1 Nashville 2013
TG10825F TG11742F
GI.1
AJ606693.1 GI.4 Chiba 2000 TG10463
TG10397 TG10511
GI.4
AJ606694.1 GI.6 Chiba 2000 AB622435.1 GI.6 Tokyo 2008
TG20166R TG20103 TG20104 MG012443.1 GI.6 Nashville 2015 TG11209 TG11221 GI.6
AB253740 GI.5 Yokote 2006 AJ606698 GI.5 Ehime 2000 GI.5
U95644.1 GI.2 Houston 1990 AB455797.1 GI.2 Nobeoka 2005
TG11748 TG21908 TG13657
GI.2
GI.7
AB258428.1 GI.7 Ehime 2004 TG20663R
AF194182 GI.3 Stockholm 1997 AJ606696 GI.3 Chiba 2001
GI.3
GI
MG012462.1 Lima GIV.1 2016 TG12518R
AB436386.1 GIV Nagano 2007
GIV TG11222 KX431437.1 GV Sollentuna/2016 MK291480.1 GV TG12173R TG11280 TG11019 TG11670 TG20384R TG20399R GV MF462288 GII.8 Peru 2008
KX894315.1 GII.8 Miaoli 2014 GII.8 TG11454
TG21273
AJ249939 GII.1 Britsol UK 1998 MG012445.1 GII.1 Nashville 2015
GII.1
MG012449.1 GII.5 US Nashville 2015 AY289804 R GII.5 USA 2000 GII.5 AF435812 GII.2 Mex 1990
MG012412.1 GII.2 Nashville 2015 GII.2 TG11476
TG11671F
AY646855 GII.6 Sakaeo Thailand 2003 AY646855.2 tailand GII.6 2002
GII.6
AB622438 GII.3 Tokyo2008 AB455793 GII.3 Kushiro 2007
DQ104360 GII.3 Sydney 2004 TG12058
MG515475.1 GII.3 Shenzhen 2015
GII.3
KX274477.1 GII.4 Manaus 2011 AB429084 GII.4 Kumamoto 2003 MG012446.1 GII.4 Lima 2016 TG11718F TG10206 TG10707 GII.4 GII 9 9 9 5 9 7 9 9 9 9 9 9 9 9 9 9 9 8 9 9 9 9 9 9 9 9 9 9 9 9 9 9 9 9 9 9 9 9 9 9 9 9 9 8 9 7 9 9 9 9 9 6 9 9 9 9 9 9 9 8 9 9 9 9 9 9 9 9 9 9 9 9 9 9 9 7 9 9 9 9 9 9 9 9 8 6 9 4 9 9 9 9 9 9 9 7 9 9 2 0
Figure 8. Relative frequency of genotypes of human sapovirus whole capsid region detected by high-throughput nucleotide sequencing
Figure 9. Phylogenetic tree based on whole capsid region nucleotides sequence (1,764 nucleotides) The phylogenetic tree was inferred using neighbor-joining method d with 1,000 bootstrap replications using MEGA 7 software.
Represents samples tested in this study
£ Represents the two different consensus sequences from samples TG11222
AY646853.2 GI.1 Nongkhahi Thailand 2002 AB622439.1 GI.1 Tokyo 2008
MG012435.1 GI.1 Nashville 2013 TG11742
TG10825 TG12058
GI.1
AJ606693.1 GI.4 Chiba 2000
TG10463 GI.4 TG20103 TG20104 TG20166 TG11221 TG11222-1 MG012443.1 GI.6 Nashville 2015 AB622435.1 GI.6 Tokyo 2008 AJ606694.1 GI.6 Chiba 2000
GI.6
U95644.1 GI.2 Houston 1990 TG11748
AB455797.1 GI.2 Nobeoka 2005 TG11454
TG10657 TG13657
GI.2
AB253740 GI.5 Yokote 2006 AJ606698 GI.5 Ehime 2000 GI.5
AB258428.1 GI.7 Ehime 2004 TG20663
AF194182 GI.3 Stockholm 1997 AJ606696 GI.3 Chiba 2001
GI.3
GI
MG012462.1 Lima GIV.1 2016 TG12518
AB436386.1 GIV Nagano 2007 GIV KX431437.1 GV Sollentuna/2016 MK291480.1 GV TG20384 TG20399 TG11280 TG12173 TG11670 TG11019 TG11222-2 GV MF462288 GII.8 Peru 2008
KX894315.1 GII.8 Miaoli 2014 GII.8 MG012445.1 GII.1 Nashville 2015 AJ249939 GII.1 Britsol UK 1998
U95645 GII.1 London 1992
GII.1 MG012449.1 GII.5 US Nashville 2015
AY289804 R GII.5 USA 2000 GII.5
AF435812 GII.2 Mex 1990
MG012412.1 GII.2 Nashville 2015 GII.2 TG11467
TG11671
AY646855 GII.6 Sakaeo Thailand 2003 AY646855.2 tailand GII.6 2002
GII.6
MG515475.1 GII.3 Shenzhen 2015 DQ104360 GII.3 Sydney 2004
AB622438 GII.3 Tokyo2008 AB455793 GII.3 Kushiro 2007
GII.3
AB429084 GII.4 Kumamoto 2003 KX274477.1 GII.4 Manaus 2011 MG012446.1 GII.4 Lima 2016 TG10106 TG11718 GII.4 GII 8 5 9 9 9 9 9 9 7 5 7 5 3 1 4 9 9 9 9 9 9 9 9 9 9 9 9 9 9 9 9 9 9 9 9 9 9 9 9 9 9 9 9 9 9 9 9 9 3 1 9 9 9 9 9 6 9 9 9 9 9 9 9 9 4 7 9 9 9 9 9 9 9 9 9 9 9 9 9 9 9 5 9 9 9 9 9 9 9 9 9 9 9 9 9 9 9 7 5 4 9 9 9 9 9 9 9 9 9 9 9 9 9 9 2 8 0 . 0 5
Supplemental figure
Nucleotide sequence alignment of the representative human sapovirus strains corresponding to the 18 genotypes used for primer and probe design.
Supplemental information
The preparation of Positive control for multiple genotypeBLAST
To determine if the constructed CLC workflow could accurately detect sapovirus multiple genotypes infection, artificial sapovirus reads were simulated tested together with our samples. Briefly, Artificial Fastq Generator [45] was used to generate artificial paired end reads of sapovirus GI.1, GI.2 and GV to a ratio of 31.2%, 62.5% and 6.3% respectfully. Artificial reads of each genotype were merged into a single file and tested as positive control. The artificial positive control sample's reads was made to be as similar as possible to NGS reads obtained from infected patient's samples (average length, per base quality distribution, GC content, per base coverage etc.)
[45] M. Frampton and R. Houlston, “Generation of Artificial FASTQ Files to Evaluate the Performance of Next-Generation Sequencing Pipelines,” PLoS One, 2012.