LiTaO3オプトエレクトロニクス単結晶材料の超音波
マイクロスペクトロスコピー
著者
櫛引 淳一
平成7年度∼平成9年度文部省科学研究費補助金
[基盤研究(A)(1) ]研究成果報告書L汀aO3オプトエレクトロニクス単結晶材料の
超音波マイクロスペクトロスコピー
(課題番号∴07555408)平成10年3月
研究代表者:櫛 引 淳 一 (東北大学大学院工学研究科教授)平成7 - 9年度文部省科学研究費補助金[基盤研究(A)(1)]研究成果報告書I (1)課題番号:07555408 (2)研究課麓:um03オプトエレクトロニクス単結晶材料の 超音波マイクロスペクトロスコピー (3)研究組織: 研究代表者:櫛引 好一(東北大学大学院工学研究科教授) 研究分担者:山本 和久(松下電器株式会社 開発本部材科デバイス研究所主任技師) 研究分担者:佐恰 家隆(株式会社山寿セラミックス晶研事業部開発部長) (4)研究経費:平成7年度 6,700千円 平成8年度 3,900千円 平成9年度 1,000千円 計 11,600千円 00010132557 i I
-1-(5)研究目的 ( 近年、光通信技術と密接な関係にあるオプトエレクトロニクスの発展は目覚ま しく、光制御あるいは光応用諸技術を支える電子材料の中で、 LiNbO3,L汀aO3単結 晶の果たす役割は大きい。これら結晶の持つ圧電効果、電気光学効果、音響光学 効果、非線形光学効果を利用した高性能光導波路型デバイスの研究・開発が活発 になされ、一部実用化が進められている。デバイスの究嬢的性能はその材料の品 質によって左右され、デバイス作製プロセスの制御に依存する。現在、所望のデ バイスを実現するための最重要課蓮は、光学的品質に優れ均質な大口径単結晶製 造法の開発や、それらの材料の基板間および基板内の電気的・物理的諸特性の均 一化であり、実用化に向けての将来的最重要課題は、マスプロ用デバイス作製プ ロセスの開発であろう。そのためには材料とプロセスの研究開発において高精度 の特性解析・評価を行う必要がある。 本研究では、本代表研究者らが発明・開発した「超音波マイクロスペクトロス コピー(UMS)技術」を光学用LiTaO3単結晶の開発とデバイス作製プロセスの 一つであるプロトン交換、分極反転プロセスの問題に適用する。 LiTa03は、 LiNb03に比べて融点がはるかに高く、サブグレインが発生するなど光学品質上聞 蓮が山積している。ここでは、次の3研究項[=こUMS技術を適用し、この材料と 光デバイス作製プロセスの解析法という"辞書作り"を行い、新しいオプトエレ クトロニクス・デバイスの基礎データを提供するものである。 (1 )本手法によるLiTdh単結晶の高精度化学組成比分析法の確立。 (2)光学用UnO3単結晶の評価法の開発。 (3)オプトエレクトロニクス・デバイスで用いられているプロトン交換層や分極 反転層/境界の解析法の開発と将来のマスプロ・作製プロセスの新しい評価 法の捷案。
ー2-(6)研究成果
1. UMSシステムの絶対精度と校正法
A Method for Calibrating the Line-Focus-BeamAcousdc Microscopy
System
AB STRACr
Absolute accuracy of the line-focus-beam(LFB) acoustic microscopy system is investigated for measurements of the leaky surface acoustic wave
(LsAW) velocityand atbenuation,and a medlOd of system calibration is
proposed・ h order to discussthe accuracy・ it is necessary to introduce a
standard specimen whose buk acoustic properties, (e・g・,the independent
elasdc constantsand density)are measured withhighaccuracy・ Single
crystalsubstrates of gadohmiumgallium gamet (GGG) are taken as standard
speclmenS・ The LSAW propagation characteristics am measured and
comparedwidlthe calcul地d results uslngthe measu托d buk acoustic
●
properties・ Calibradon is demonstrated forthe system usng two LFB
acoustic l飢S devices witha cylindriCalconcave surface of 1-孤 radius in
the fzquency range 100 to 300 MHz・
ー3-Ⅰ. mODUCTION
Line-focus-beamacoustic microscopy ll] has become recognized as a uniqueand useful method of quantitative material characterization ll]-[18]・
characterization is made by measuringthe propagation characteristics, (e・g・,
velocityand attenuation) of LSAWs excited onthe boundary betweenthe specimenandthe water coupling liquidthrough V(I) curve analysis・
Measurement accuracy of the LFB system has been studied persistently l lL
l19日201, Sincethe measurement principleand a prototype system were
establishedinorder to developthe potential practicalapplications in
materials science. Mechanical precision and temperature stability have been
serious problems for accurate measurements inthis technology・
Accuracy must be consideredinthe two categories of relative and absolute accuracy. The typicalsystem, developed for two-dimensional(75 rrm x 75 mm)inspection, has attainedthe relative accuracy of LSAW
velocity measurements betterthan±仇005%・ at a chosen point of a specimen,and ±0・01% overthe entire sea-lng area・ by establishingthe
●
measurement procedures l19]. ne system has been satisfactorily applied to
resolve scientificand industrialproblems of ferroelectric single crystals of LiNbO3 and LiTaO3 for SAW devicesand for optoelectronic devices l14]-[17]. Absolute accuracy of measurement of velocityand attenuation for
relevant leaky waves was examined previously ll] by comparingthe
measured results, for a variety of isotropICandanisotropIC materialS・ With
Calculations uslng Physicalconstants published inthe literature・ Althoughit
was atthe early stages of these developments・this study suggestedthatthe
physicalconstants of some materials・ for example LiNbO3 CryStalS・ used for
the calculations were considerably different fromthose of the specimens actually employed forthe studies・ This has been confirmed by detailed investigations of the congruent chemicalComposition of LiNbO3 using LFB
acoustiCmicroscopy l15]. Therefore, it is necessary to employ
-4-characterized specmens, withtheir measured acoustic properties when
(
discusslng absolute measurement accuracy. Absolute accuracy lS, at Present, the most important research topic, fromthe teclmological point of view, for such applications as absolute measurement of velocity and attenuation,and as
determinations of the elastic constants of bukandthin-film materials l3], [4), [10]-[13].Also, it is necessary to develop a method of system
calibration because different measured values canresult from different systems/devices operating atthe same frequency. A method using standard speelmenS has been proposedand a demonstration witha synthetic silica
glass has been made forthe first time 【20】. This paper presentsthe details ●
for discusslng absolute accuracy of the LFB acoustic microscopy system, using OGG single crystalsubstrates asthe standard specimens forthe
frequency range from 100 to 300 MHz.
Ⅱ. SYSTEM CALIBRATION AND STANDARD SPECIMEN
Fig. 1 illustrates schematicallythe concept of a calibration method for the LFB system for studying a nonpleZOelectric standard speclmen having the independent elastic stifhess constants cljand density p・ Thetheoretical Values of the LSAW velocity VLSAWand normalized attenuation factor
qsAW, Calculated丘omthe actually measured bulk elastic constantsand
density, provide a standard for calibrationand are compared withthe
expenmentalⅤalues obtained bythe LFB acoustic microscopy system・
h principle, anthe materials,including nonpleZOelectriCand
pleZulectric materials could be appropriate forthe standard speclmen if all the physicalconstants necessary forthetheoretical calculations of the LSAW characteristics canbe determined by accurate measurements. The following
requlrementS, however, should be applied for selectingthe standard
specmen: nonpleZOelectric homogeneous materials witha small number of● independent elastic constants and negligibly small包COuStic loss at dle higher
一5-Fig・ 1・ A concept of calibration of the LFB system・
-6-frequencies at which characterization by LFB acoustic microscopy lS t
perfonhed; materialSwithmoderate LSAW velocityand attenuation to
produce many continuous oscillations inthe V(I) curve overthe entire defocus region used for V(I) -curve analysis.
GGG single crystal, which belongs tothe cubic systemand hasthree
independent elastic constants, cll, C12, and c44, 1S a most Suitable material for the complete calibration, from our experimentalexpenence・ It is expected thatthe system calibration cantxB made withthis standard speclmen at any
軸encies wherethe LFB system canbe applied to material
ch釘aCteri2ation. Here, GGG single crystalsubstrates withtwo basic
crystauine surfaces of (loo)and (I 1 I), produced by Shin-Etsu Chemical
Co・, Tokyo, Japan, were taken forthe demonstration・ The approximately 3-mthick speC皿enS Were Prepared withsufrlCient homogeneityand
●
optically polished surfaces・ ¶le SpeClmen Surfaces were examined by X-ray
difhctionanalysisand were evaluated to be within lessthan0・lo tothe
desired crystauine surfaces.
Ⅲ. MEAStJREMENTS OF BULK ACOUSTIC PROPERTTES
Measurements of the buk acoustic properties were made first. Longitudinaland shearwave velocities were measured bythe pulse
interference method using a radio frequency (RF) tone burst signal[21】, while densides were m声aSured by a conventionalmethod based on ale
Archimedes pnnciple by weighing die SpeClmenS bothinairandindistilled
● water. Two plane wave ultrasonic devices for velocity measurements wereprepaJCd,witha ZhO mm transducer for longitudinalwavesandanX-cut
LiNb03 tranSducer for shearwaves, on cylindriCalbuffer rods of synthetic sihca (SiO2)glass (T-4040, Toshiba Ceramics Co., Tokyo, Japan). Velocity measurements were carried outaround 150 MHz forthe longitudinalwaves
-7-andaround 100 MHz forthe shear waves, as shownschematically in Fig. 2, C
usingthe buk ultrasonic spectroscopy system l21】・ RF pulsed plane waves
emitted ftomthe devices are incident on a specimenthrougha couplant・
Partialreflectionand transmission occur atthe interface between couplant and speclmen, and transmitted waves are reflected perfecdy atthe back
surface. Two echoes Vland V2 (see Fig. 2) reflected fromthefrontand
back surfaces of the specimen, respectively, were used for measurements・ The double-pulse method l22] was used sothatthe two・echoes, Vl and V2, could overlapandinterfere・ By gating outthe interfered signal and swecpmgthe ultrasonicfrequency, a series of interference maxima and●
minima are recorded (Fig. 3). ne frequency interval Afis related tothe
phase velocity V forthe specimenthickness h as follows:
Af= V/(2h). (1)
nethickness was measured by a digital lengthgauglng System Withan
error of ±カ.1 pm・ h our measurements,the significant figures of
determined velocity valuesare five digits, which is mainly dominated bythe
accuracyinthickness measurement・ Coupling materials are distilled water for longitudinalwavesand athin layer of bonding materialSalol (phenyl salicylate)for shearwaves. For shearwave velocity measurements,
corrections for phase shifts atthe salol bond must be made for accurate determination of shearwave velocities. More detailed description concemedwiththe accurate measuTementS Of bulk wave velocitiesand densitywill be reported elsewhere l23] ・
Thethreeindependent elastic comstants, cll, C12,and c44, 0f GGG
crystalCanbe determinedwithhighaccuracy by measunngthe velocities of
ll001-propagating longitudinalwaves, VLl100],and l 100]-propagating shear waves, Vsll001, forthe (100) GGG substrateand of ll 1 l]-propagating・8-COUPLING
MATE R IAL
ト吾
Fig・ 2・ Expenmentalarrangement of bun velocity measurements bythe pulseinterference method・
-9-【gp]1⊃dト⊃0山^LトV1ut]
140 150 160
FREQUENCY 【MHz】
Fig. 3. Frequency托SPOnSe Of interference output in longitudinal
velocity measurement for a (100) GGG specimen at 23・36oC・
The speC皿enthickness is 2800・6岬l・
-10-longitudinal waves, VLllll], forthe (1 I I) GGG substrateandthe densityp,
wi血血e fわllowing equations:
cll =PV,2100】 , C.. -- p vsf.0.] , cll +2cl2 +4C44 =3 pVL2llll] ・ (2) (3) (4)
nLe temperature enVirorment for LFB acoustic microscope systems varies from one system to another. In order to calibrate preciselyanLFB acoustic microscopesystem, Operating at an arbitrary room temperature,the temperattlre dependence of the elastic constantsand density of standard speclmenS must be measuredaroundthe temperature of the room wherethe system is instaned. The measurements descrihtd above were made at
various temperatures from 21 oC to 27.Cina temperature-controlled room・
Thethermalexpansion coefrlCient of GGG is 6xlOJ/ocland a 3-rrmthick
speclmen becomes 0.072 pmthicker asthe temperaturerises by 4oC.●
Becausethis value is smanerthanthe measurement resolution of the digital lengthgauging system (iO.1 pm),thethicknesses of the specimens were measured only at a fixed room temperaturearound 23oC. In each
measurement,the temperaturearoundthe specimens wasalso measured with a calibrated copper-constantanthermocouple.
Fig. 3 showsthe typical frequency response oftheinterference output inthe longitudinalvelocity measurement for a specimen of (loo) GGG.
Fromthis waveform, we candetermine 4声1.13454 MHzthroughour
proαdure of waveform analysis. Fig. 4 showsthe temperature dependence
lTcchnicd Data, Shin-Etsu Chemicalb・ , Tokyo, JapaJl・
1.1350
5 4 3 1 ● rl[zHMhv
1.1340
20 21 22 23 24 25 26 27 28 TEMPERATURE 【oClFig. 4. Temperature dependence offrequency intervalAf for ll00】-pr甲agating longitudinalwaves on a (100) GGG specimen・
nle SpeClmenthickness is 2800.6 pm・
ー12-of the frequencyintervalAfー12-of longitudinal waves forthe (loo) Gm
specimen. Open circles denotethe measured values,and barsthe
measurement errors. ^fdecreases asthe temperaturerises. The slope was
determined to h: -0.OW57 MHzPC bythe method of least squares. ne
thickness of the speclmen Was 2800.6 pm. Fromthese measured results,the longitudinalVelocity and temperature dependence at 23oCare determined to
be VL=6354.82 m/Sand ・0.32 dsPC, respectively. TYle densities werealso
measured forthe (loo)and (ll 1) GGG specimens asgiven in Fig. 5. ne
densityand temperature dependence at 23oC are 7097・1 kg/m3andA.14 kg/m3rc, respectively. TYLe bulk acoustic properties of the GGG
speclmenS at 23.C are listedinTable I,along withmeasurement errorsin
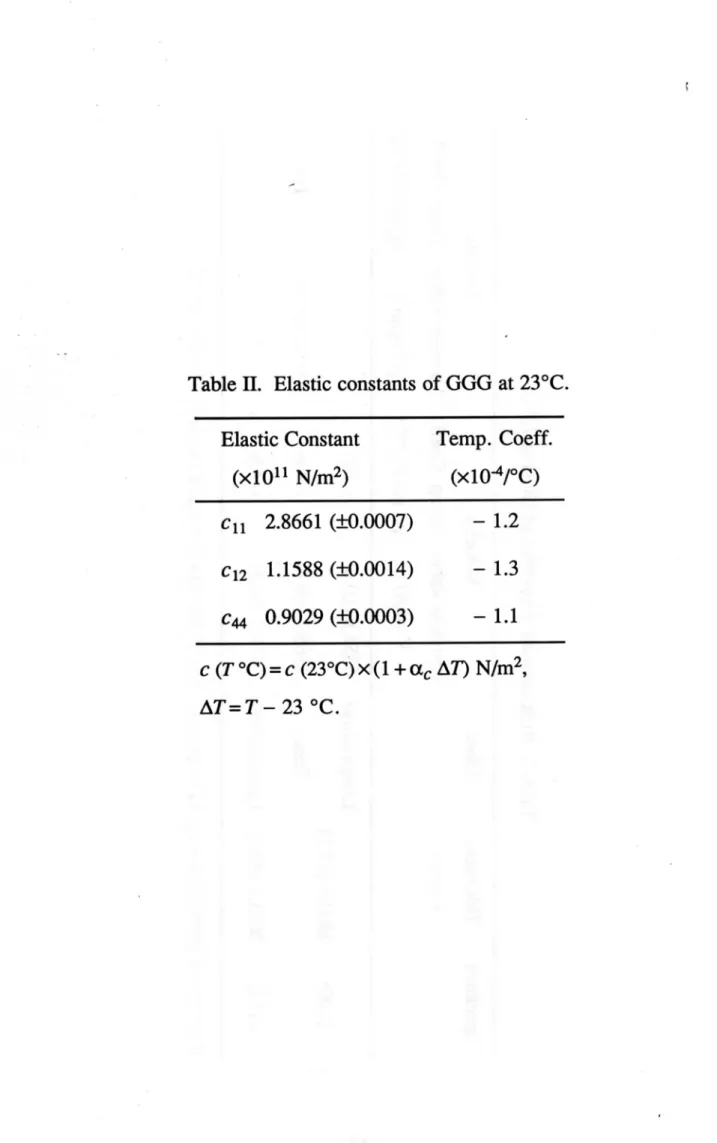
parentheses. Table IIgivesthe elastic constants determined by (2)-(4) using the velocities and densityinTable I. The temperature dependences of the elastic constants were found to be negative, justthe same asthose of velocity
and density.
Ⅳ. LSAW PROPAGATION CHARACTERISTICS
Measurements of V(I) curves forthe (100)and (1 1 1) GGG standard speclmenS are Carried outinorder to calibratethe LFB system uslng two
LFB ultrasonic devices designed for 225-Mttz operation, which a1℃
describedindetail intheliterature ll]. The devices havethe different
ZhO-filmtransducer sizes of 1.73 帆 X 1.73 mm (No. 1)and I.50 mm X I.73
m (No. 2) withthealtered transducer widths of 1.73and I.50 rrmalong
血e focused axis, formed ontheflat ends of the acoustic cylindriCallenses
withthe following dimensions:the cylindriCalconcave surface of 1-rrm radiuswithan aperbre half-angle of 600andthe distance of 12 mm between the transducer plaJleandthe top surface of the lens. Onthe cylindrical concave surface, a quarter-wavelengththick chalcogenide-glass filmis
fabricated asanacousticantireflection coating layer between sapphire and"
8 9 0 7 7 9 0 7 [e∈\6d仁一SNu凸 20 21 22 23 24 25 26 27 28 ∫ TEMPERATURE 【oC】
Fig. 5. Temperature dependence of density for (loo)and (ll 1)
Gm speclmenS.
一14- 6+I-(uo\E・OtX)dx) .JJ90U.dtuaL ・UoMN-1=1V・M息JCvdD+I)×(UoeZ)d-(001)d・spLLV^D+I)×(UoeZ)^=(Uo1)A (寸.07:)I.卜60卜 (sdi)M.卜等や tqq!gtZo1 (I.OS)I.れE9N (ttT) (寸.OS)卜.99ge JCattS (I.OT)9.008Z (00t) (9.07)8+寸EC9 Tt月pq!叫uo1 15 (M息4)d (uo\S・otx)^v attTt!^atntOSqV +JJaOU.dtHaL (∽\∈)i arLtt!^31tttOSqV A)!suaQ 倉oop^ aPOM (td)y ssaqDmL uaut邑S .U.MN)t!999JOSaPadoJdopsttoodW鏑.tOtqtu.
Table II. Elastic constants of GGG at 23oC.
Elastic Constant Temp. Coeff.
(×1011 N/血2) (×10ヤC)
cl1 2.8661 (±0.0007) - 1・2
cl2 1.1588 (±0.0014) - 1・3
C44 0.9029 (±0.0003) - 1・1
C (ro°)=C (23oC)×(1 +α。 A7) N血2,
Ar=r-23 oC.
ー16-water. The typeNo. I transducers were used atthe early stages of the development,andthe typeNo. 2 transducers have been mainly employed
around 225 MHz for practicalmeasurements since 1986.
First,angulardependences of LSAW propagation characteristics were measured nearthe center of each specimeninlo steps over 200o. Fig. 6
showsthe typicalV(I) curves measured withthe two devices onthe (ll I)
GGG specimen for lii2] propagation at 225 MHz. Significantly different
V(I) curvesinshapewere recorded in Fig・ 6(a) by the. No・ 1 deviceandin
Fig二60)) bythe No. 2 device. According tothe procedure of V(I) ctlrVe
analysis llLthe waveforms wereanalyzed sothatthe LSAW velocities VLSAWand normalized attenuation factors aLSAW Were Obtained:
vLSAW=3242.79 rn/Sand aLSAW= 1.083xlO・2 from Fig. 6(a);
vLSAW=3253.60 dsand qsAW= I.125xl0-2 from Fig. 6(b). The
detemined values obtained bythe No. 1 deviceare 0.33%invelocityand
3.7% in attenuatiom smallerthanthose obtained bythe No. 2 device. ¶le
measured results oftheangulardependences are glVen by solid lines in Fig・ 7 forthe (loo) GGG andinFig. 8 forthe (Ill) GGG. Forthe (100) GGG,
Ooand 45o correspond tothe l010】- and l01 1]-propagation directions,
respectively,and forthe (Ill) GGG, Ooand 90o cor陀SPOnd tothe
llio]-and lii2] -propagation directions, respectively. TYle average temperatures Of
the water couplant du血g measurements were as follows: forthe (100)
GGG specmen, 23.129oC bythe No. 1 devioeand 23. 049oC bythe No・ 2●
device; forthe (111) GGG specimen, 22.991.C bythe No. I deviceand 23.121oC bythe No. 2 device. The angulardependences exhibitthe
characteristics reflec血g crystal symetry of the cubic system because GGG
crystalbelongs to crystalclass of m3m. The propagation characteristics of
LSAWsfor bothspecimens were calculated, for reference, at 23.100oC by theanalytiCalprocedure of Campbenand Jones l241 usingthe elastic
constantsand densities of GGG, determined inthe previous section,and of
[gp]1ndlnOj^llVljt] 【gP]ト⊃dト⊃0山^llV1utJ -30 -30 -500 -400 -300 -200 -100 0
DlSTANCE lpm]
ー500 -400 -300 -200 -100 0DISTANCE lpm]
Fig. 6. V(Z) curves measured on a (1 I I) GOO specimen for l1 12]-propagation・
一18-【sJE】>ヒ001山>きVS1 ∝013VL.トトV凸uZJIVMtJON 3285 0 5 8 7 2 2 3 3 0 7 2 3 5 6 2 3 0 30 60 90 120 150 180
DIRECTlON ldeg]
(a) LSAW velocity x1 0-2 0 ■l ■ ■i 0 30 60 90 120 150 180 DIRECT10N 【deg1
0)) normalized attenuation factor
Fig. 7.Angulardependences of LSAW propagation characteristics
for a (loo) mG specimen.
Sohd lines, measu托d at 225 MHz; dashed lines, Calculated. _
ー19-5 4 4 2 2 2 333 【sJ∈】>ヒ301山>きVS1 ∝010VL.トトV凸uZllVMtJON 0 5 0 5 3 2 3 0 2 ら ■Jl X 5 1 ● r.ll 0 1 ● ー
1.05
30 60 90 120 150 180 DtRECT10N 【deg】 (a) LSAW velocity0 30 60 90 120 150 180 D旧ECT10N 【deg1
0)) nomaliZed attenuation factor
Fig・ 8・Angulardependences of LSAW propagation characteristics
for a (Ill) GGG specimen.
Solid lines, measured at 225 MHz; dashed lines, Calculated.
water reported inthe literature l25]-[27]. The results are plotted asthe
dashed-linesinFigs. 7and 8. TYLe measured values bythe No. I device are
0.250 to 0.271% for VLSAW Smaller and 2.2 to 3.3% for aLSAW largerthan thetheoreticalvalues, andthevmeasured values bythe No. 2 device are 0.069 to 0.084% for VLSAWand 6.7 to 7.7% for aLSAW largerthanthe
theoretiCalⅤalues. h general, it canbe saidthat different LFB devices
operating atthe same frequency provides slightly different results of
velocityand attenuation.- 'Next, propagation characteristics of LSAWs were measured in 1 MHz
stepsinthe frequency range l00to 300 MHz uslngthe two LFB devices.
me propagation directions are chosen to be l010】 forthe (loo) GGGand
lii2] forthe (Ill) GGG specimen, sothat a pure Rayleighmode was
employed for measurements. ne measured results are shownin Figs. 9and
10. Ⅵle measured values are plotted as solid linesandthetheoreticalⅤalues
as dashed lines. Althoughit is assumedintheorythatthe propagation
characteristics of LSAWs onthe water-loaded specimen surfacesare not
dispersive,the values of VLSAWand aLSAW measured for bothSpecimens
appear to clearly exhibitthe quite similarfrequency dependences for each
ultrasonic device. hthe frequency range measured, VLSAW and aLSAW Vary
apparendywiththe Aquencyandthe frequency dependences forthe No・ 1
device are remarkably different fromthose forthe No. 2 device. The
usable frequency range is dominated bythe SノN ratio for V(I) curvesand
the system dynamic range which are directly associated withthe efficient operation of transducerand acoustic matching layer. We canusethe No. 1 and No. 2 devices efficiently inthe broad frequency range 130 to 285 MHz
for velocity measurements,and, for attenuation measuFementS, 1 30 to 230
MHz forthe No. I device and 130 to 260 MHz forthe No. 2 device.
¶len, tO Checkthe measurement resolution and reproducibility in
measurements, LSAW propagation characteristics were measured withthe
一21-0 9 2 3 【sJ∈】>ト一301山>≧VS1 ∝0トOVL.1トV凸uZコVMt]ON 0 8 2 3 0 7 2 3 1 50 200 250 FREQUENCY 【MHzl (a) LSAW velocity
2 √u l X 1 50 200 250 FREQUENCY 【MHz】
仲) normalized attenuation factor
Fig. 9・ Frequency dependences of LSAW propagation characteristics
for a (l00)-【010】 GGG specimen.
Solid lines, measured; dashed lines, Calculated.
-22-【sJ∈】>ヒ001山>きVS1 ∝0トDVL.EV凸uZnVM∝ON 0 6 2 3 0 5 2 3 0 4 2 3 × .4 ■l 1 50 200 250 FREQUENCY 【MHz】 (a) LSAW velocity
100 1 50 200 250
FREQUENCY 【MHz1 0)) normalized attenuation factor
300
Fig・ 10・ FreqTenCy dependences of LSAW propagation characterisdcs for a (1 ll)-[112] 000 specimen.
Solid lines, measu托d; dashed lines, Calculated.
No. 1 and No. 2 devices at 225 MHz on血e (111) GGG specimen in血e
lii2] propagation direction. Experiments were repeated.200 times at a certain position aroundthe center of the specimen・ The average values of
VLSAWand (礼sAW Widl ±26 (0 denotes a standard deviation) were 3242.8l
nvswith劫.05 m/S (jD.0013%)and I.0825xl0-2 with ±1・6Ⅹ10 5 (iO・14%) forthe No. I device,and 3253.52 m/s with±0.07 m/S (±0.0020%)and
1.1308Ⅹ10 2 with±2.3Ⅹ10 5仕0.21%) forthe No. 2 device. The average temperatures with±26 duringthe measurements witheach device were 23二035oCwidl iO.004oC forthe No. 1 device and 23.228oCwidl _∼.(氾8oC
forthe No. 2 device. It has been shown fromthese resultsthatthe
measurement resolutionand reproducibility are not related tothe devices, but directly tothe system stabilityassociated withall kinds of stabilities of
the electriCalpart, mechanicalpart,andthe measurement conditions of
temperature,andthatthe resolution is estimatedaround ±0・002% for velocity and around ±0・2% for attenuation at a chosen point・
V. CALIBRATION
The LFB system is calibrated according tothe calibration concept describedinSection Ⅱ. TYIe differences betweenthe measuredand
calculated valuesinFigs・ 7and 8,andthose inthe frequency dependences
showninFigs・ 9 and 10 are basicallythe values to 也 corrected・ Here, a
quantitative discussion is made taking as examplethe LSAW propagation
characteristics measured at 225 MHz onthe (100) GGG specimen inthe lo101 propagation directionandthe (1 1 I) GGG specimeninthe lii2]
propagation direction for bothNo・ land No・ 2 ultrasonic devices・ rme measured andtheoretical values of LSAW propagation characteristics atthe
temperature forthe measurements aTegiven in Table Ill forthe (100)-[010】
GGG specimenandinTable IV forthe (111)-lii2] GGG specimen・ Forthe
(l00)-【0101 GGG specimen,the corrections'are as fonows:forthe No・ 1
-24-れ604eZ
LMO'eZ
(%N.ト-)
z・OtXSLO.OI e・OIX99Tet z・OtX8804t
(%E'N-)
e・OtX卜NO.OI z・OtXEttOt e・OtX88041
(%MLO.0-) の寸.N-(%卜9M.0+) 寸ト.S+ 寸寸.9卜NM 66.M卜Ne M.〇N 9M.れ9NM 00'寸卜Ne I.OZ 25・ (uo) ′ 巴n)t!JadulaL
tZ0!73aJJOU p巴ゴSCaM patt!POttO uO!一3巴hOU pamSt!ayV patqnDTC3
JhVSTb (SPH)JAVS1^
8!^q 3!t10Sqtn
8NZeeN meO.MN
(%9+LI) e・OtXOSOd-e・OtXtMt+I e・OtXIEO.I (%t.M-)
e・OTXeMO'OI e・OtXe80+I e・OtXOEO.I
(%oLOd-) SN.パー (%09M.0+) 9寸.8+ NM.MnNM 寸M.tMNM N.〇J4 lS+N寸NM 卜M.tMNM I.〇J4 26 (uo) メ am)t!JaduaL
uO!739ヒOU p巴nSt!aM pattPOtt!U
AVS、す
tX0!一3巴hOU pamSdayV p山鳥trL3TtO
(sptZ)JhVSl^
3. 9^q
3召OSqtLt ・ZHMmZZ3-9tqOadsDDD[Z!!]・(ltt)CJOS3PSPatDdJq3uO!亀doJdJhVSlpamSCauptrCpa)qTt。TCU.ju3tqCL
device, +8.74 m/S (+0.267%) as VLSAWand -2.7xl04 (-2.5%) as aLSAW ;
forthe No・ 2 device, -2.45 m/S (-0.075%) as VLSAW and.-7.8xl04 (-7.2%)
as aLSAW. And, forthe (Ill)-lii2] GGG specimen,the corrections are as
follows: forthe No. 1 device, +8.46 m/S (+0.260%) as VLSAWand -3.3xl0-4 (-3・1%) as q.SAW ; forthe No. 2 device, -2.28 m/S (-0.070%) as VLSAWand
l8.Ox104 (-7.6%) as aLSAW.
Consideringthe reproducibility in V(Z) curve measurements presented
inSection IVandthe measurement errors in bulk aco,ustic properties forthe
standard speclmenS,the absolute accuracy after calibration could be
es血ated to be betterthan±0・02%invelocityandaround ±0・2%in
attenuation.
Ⅵ. DISCUSSION
Toinvestigatethe causes of the observed differences, a cross-sectional geometry of the LFB acoustic lens, which explainSthe construction
mechmism of V(I) curves, is illustratedinFig. I 1.Whenthe relative
distance I betweenthe ultrasonic deviceandthe specimen surface is
changed,the ouq)ut of the transducer is recorded as a V(I) curve wave form
withperiodic oscinations, as showninFig・ 6・ This istheinterference of the
two components A)and #linFig. 1 1, which mainly contribute tothe tranSducer ouq)ut・ The LSAW propagation characteristics of the phase
velocityand attenuation are determined withthe oscinationinterval Azand
attenuation句Ofthe V(I) curve usingthe following relations,
VLSAW =
aLSAW
-Vw
ao cos OLSAW + 2aw 2kLSAW SineuAW
-27-(5)
TRANSDUCER
Fig・ 1 1・ A cross-section of the LFB acoustic lens to explain V(I) cuⅣe measurements・
-28-where Vwand aw arethe velocityand propagation attenuation of I
longitudinalwaves for water, respectively,and kLSAW isthe wavenumber of
LSAWs which equals aWLSAW.lt is seen fromthe above equationsthat, in
the determination of LSAW propagation characteristics,the measurement accuracy of VLSAW depends onthe accuracy of Azand Vw,andthe accuracy of q.SAW depends onthe accuracy of q)and aw as well as Azand Vw.The measured values of VLSAW Should be considered to be affected
mainly bythe precision stmightness of the I-axis mechanical translation
stage (Z stage) used for V(I) curve measurements,and bythe difference ftomthe idealized measurement model, Concemed withthe ultrasonic devices employed,inwhichthe diffraction problem inthe focused waves also must beincludedinconsiderations. These measurement error factors
giverise toanerror of the periodic oscillation interval Az inthe V(Z)
Cun「e.
For very accurate absolute measurements, it is essentialto preparethe standard specimens of materials to be characterizedandthe device/system must be calibrated forthe materials. However, whenthe realstandard
●
speclmenSare not aVaihble, other proper standard specimens, whose bulk acoustic properties are accurately measwedand whose LSAW velocities are quite close tothose for materials to tx: measured, Canbe employed
according tothe fonowng procedure.
Fromthe calculatedand measured values of VLSAW forthe temporary
standard specimensand using (5),the corresponding values of血sT(CalC.)
and血sT(meas.) Canbe calculatedandthe correction coefficientsthus obtained K(V)are defined as fonows:
K(V) = dzsT(CalC.)/dzsT(meas.).
-291
The calibrated values Az(calibrated) are obtained forthe measured values
Az(measured) forthe specimens to be corrected as:
Az(Calibrated) = K(V) ・ Az(measured). (8)
substitutingthe values Az(Calibrated) into (5),the absolute values of VLSAW are detemined forthe specimens.
The similarprocedures canbe taken for αLSAW・ Calculatingthe values
q)sT(CalC.)and q)sT(meas.) fromthe calculatedand measured values aLSAW forthe temporary standard specimens with(6),and definingthe following
correction coefficients K(a) as:
K(a) = q)sT(CalC.)/句sT(meas・) , (9)
the calibrated values句(calibrated) are obtained forthe measured values
q(measured) forthe specimens to be corrected as:
句(Calibrated) = K(a) ・句(measured) ・ (10)
Then, substitudngthe values q)(Calibrated) into (6),the absolute values of aLSAW a陀detemined forthe specimens・ h determiningthe叫(Calibrated)I the corresponding corrected values of VLSAW are emPloyed・
Tbis calibration method is discussed usingthe (loo)-【010】and (I ll)I
lii2] GGG specimens.When taking a (100)-[010】 GGG specimen to be measuredand a (ll 1)-【Ⅰ王2] GGG specimen asthe standard,the corrected results of the measured propagation characteristics atthe lyPicalfrequencies
of 150, 175, 200, 225,and 250 MHz are presented in Table V, together with the calculated results, uslngthe measured results ofthefrequency
dependences forthe two GGG crystals shown in Figs・ 9and lO・ It is
ー30-れeo.eZ 9NO'MM 9日ロ.MN 9No.MN 9NOJMN (%M.0+) TOtXS+れ+ (%M.0-) sIOtXS'NI (%M.〇⊥ S-OtX64NI (%M.I-) TOtXト.MtI (%寸.I-) 70tX等t-(%tき.0+) t-OtX96604t=-OtX8L80't 基.0+ (%90040+) 3-OtXOM80't 7-OtX8LSO.t 6T.0+ (%C書.0+) 3-OtX等80.I zIOtX8L80't tt.0+ (%otod+) 7-OtXt寸LOtt 8-OtXSLSO't 某.0+ (%寸tO.0+) 8-OtXOMLO+t 8-OtX8L80+t 等.0+ 寸0.寸卜eM 6t.寸卜ZM tt.寸トZM 寸M.寸トNM 9y寸卜eM 00.寸卜Ne 00.寸トeC (ち.寸卜NC 書.寸トZM OO'寸卜ee X付血 盟HM ≡ EjrlL! XML〕 9m6.NM れe60NN 寸M6eNN NM6.NZ SN6'NM (%6+0+) TOtX寸.6+ (%ed-) 70tX9.MI (%M.0+) TOtXL.Z+ (%M.OI) S-OtXS.MI (%Ld-) TOtXN.トー (%S書.0-) 8-OtXOト60't M-OtX9L80.I St00-(%れ暮.0-) 7-OtX等SOrt ?OtX9LSO+I St.0-(%coo+0-) z-OtXMO60.I N-OtX9LSqt 3-OtXt寸SOet zIOtX9LBqt 8-OtXさ804t 7-OtX9LSO.I 〓.0-(%90'〇+) 8T.0+ (%eto'〇+) 爪寸.0+ 寸8.M卜NM 寸8.MトNM t64MトNM Or寸トZM の寸.一声NM No.寸卜NM ZO'fLZe NOJ寸トNM ZO.寸トNM ZO'fLee XR 甫愚 書e MgL! 忌jrB I.OJ4 31 (a) aJqdtJJ3L 33tZaJaB宍H 召U凸毎月U 雪月扇U JhVSTb 93tnmBKI P3mOD tXnqn3PD (量JhYS1^ 曾出邑 btDnbaJd 1∵ ・● 3召冒巴貞】
.ttatq3aspqtn!tsEDD[N!!]・(TIT)3tPAqpaItuqP9tI-.6ds
DDD[OtO]・(Oof). CJOS3PSでatD眉でttOPC叫cdodJhVSlp873WO3Ptnp37qttDTCU・^atq芦clarifiedthatthis method is very effective forthe two different LFB
devices, not dnly for velocity calibration but also for attenuation calibration
( inthis broad frequency range・ Bythis calibration method・the absolute
accuracy is attained within txBtterthan±0・02% in velocity which is almost
the same asthat bythe system Calibration uslngthe real standard specimens・
and within±1-2% in attenuation,underthe similar estimation of the
measurement errors describedinSection V. hthis demonstration,the
LSAW velocities betweenthe temporary standard specimenand test speclmen Were Very Close, lessthan1 %・ Further experimental study
concemlngthe effectiveness forthe cases having considerable differencesin velocity, 1argerthan severalpercent, between temporary standard specimens and materials to be measured will be reported elsewhere l28]・
Becausethe measurement of q-SAW is done by amplitude
measurements, its measurement emrs are essentially largerthanthe
measurement errorsinvLSAW by phase measurements uslngtheinterference
method,and are sometimes estimated to be up to severalpercent to afew
tens ofpercent・ h addition tothe error causlng factors inthe VLSAW
measurement,the following factors also might be involvedinthe errors of
the (礼sAW Values: Water is treated as an ideal fluid inthetheoretiCal
Calculation of LSAW propagation characteristics, and accurate values of the attenuation cufficient for water inthe VHF range employedin
measurements bythe LFB system have not been obtained・ It canbe said
that it is impossible to obtain札sAW aS accurately as VLSAW andthat it is not
appropriate to usethe absolute values of札sAWalong withVLSAWinan
application of L用acoustic microscopy to determination of the elastic constants of bukandthin-film materials l3], 【41, 【10-13].
Homogeneous speclmenS Such as Siand Ge single crystals can be used
for system calibrationinthe different velocity range・inthe same way as
demonstrated here. However, highlyanisotropic materials witha large
ー32-number of independent acoustical physical constants should not be suitable
forthe- standard specimens.Asthe corrections associated withthe
mechmiCalZ stage andthe measurement model arethe common factors
subjected tothe system, GGG crystalsubstrates arethe more suitable
standard speclmenS forthe system calibration, satisfyingthe required
conditions as descritNBd in Section II.
Different spatial frequency distributionsofthe acoustic fields are
formed on a solid specimen by different LFB ultrasonic devices andalso at differcntfrequencies ll】, 【29]. Fromthe data obtained by measuringthe amplitude and phase of the V(I) curve for Teflon, on which no leaky surface acoustic waves are excited,the variations of the phas.e have been found to be directly related tothe measured values of LSAW velocity,and, then,the apparent frequency dependences of LSAW velocities, as seenin Figs. 9and 10, has been quantitatively explained l301・ It cantxt said, therefore,that such frequency dependences of LSAW propagation
characteristics result fromthe触quency dependence inthe performance of
LFB ultrasomic devices, depending uponthe sizeand shapeofthe ultrasonic transducer.the dimensions of the acoustic lens,thethickness and distribution of the acoustic antireflection coating layer,andthe ultrasonic frequency・ Nevertheless, it is necessarythat every propagation characteristic of LSAWs obtained at each frequency must be calibratedindividually forthe
device/system usedforthe absolute measurements・
ⅤⅡ. CONCLUSIONS
Inthis paper, a calibration method forthe LFB acoustic microscopy system uslng Standard specimens has been described・ Inthis method・ dle standard speclmenS, Whose elastic constantsand densities are measured with
highaccuracy, must be used. A study has been conducted on GGG single
crystal, which is considered to tx5 One Ofthe most suitable speclmenS・ The-33-standard has been glVen bythe velocities of bulk acoustic wavesand
densities measured for two crystalline planes of (loo) and (1 1 1) GGG as af
fLmCtion of temperaturearoundthe room temperature. Then,the LSAW propagation characteristics have been measured bythe LFB acoustic
microscopy system uslng two LFB acoustic lens devices witha cylindrical concave surface of 1-rrm radius inthe frequency range loo to 300MHz.
The apparent frequency dependences of LSAW velocityand attenuationare observed in measurements on a semi-infinite GGG specimen resulting from
the frequency characteristics of the ultrasonic devices: Calibration has been
demonstrated by companngthe measured results withthetheoretical
Calculadons of LSAW propagation characteristics, uslngthe measured elastic●
constantsand density of GGGandthe physicalconstants of water reported, resul血g inthe absolute accuracywithin±0.02% in velocityandaround ±0.2%inattenuation.
It is concludedthat calibration is necessaryinthe measurement of absolute values becausethe absolute values of LSAW propagation
characteristics depend onthe system used, especiallythe LFB ultrasonic
device employed, andthe operating frequency. nle accuracy Of attenuation values obtained byamplitude measurements is lowerthanthat of velocity values obtained by phase measurements frominterferenceintervalSinV(Z)
curves. TYIerefore,the velocities must be used for quantitative material characterization. However, attenuation canbe efficiently used for such a
case of determiningthe elastic constants of thin-filmmaterials by LFB acousticmicroscopy, utiliZingthe significant variations of attenuation near
the cut-off of leaky Sezawa waves and leaky pseudo-Sezawa waves l4]. With the use of the calibrated velocities, it is shownthat LFB acoustic microscopy
win tX practically applied to absolute surface characterization of wafersand
determination of elasdc constants of solidandthin-film materials, in which dle absolute values of velocitiesare essential.
-34-REFERENCES
ll] J. Kushibikiand N. Chubachi, ●●Materialcharacterization
byline-focus-beamacoustic microscope:'ⅢEE TranS・ Sonics Ultrason・, vol・ SU-32, pp.
189-212, Mar. 1985.
[2] J. Kushibikiand N. Chubachi, ''Acoustic microscopy for materials
characterization:fin Proc. ULLllaSOnics International 91 Conf., Butterword1-Heinemam, 0Xford, 1991, pp. 1-13.
[3] 1. Kushibiki, T. Ueda,and N. Chubachi, ●●Determination of elastic constants by
LFB acousdc microscope:'PITOC. IEEE UltTlaSOn. Symp., 1987, pp. 817-821. [4] J. Kushibiki, T. Ishikawa,and N. Chubachi, '.Cut-off characteriStics of leaky
Sezawa and pseudo-Sezawa wave modes forthin-filmcharacterization:. Appl.
Phys.Left., vol. 57, pp. 1967-1969, Nov. 1990.
[5] P. J. Bumett, G. A. D. Briggs, S. M.Al-Shukri, J. F. Duffy,and R. M. De La
Rue, I.Acoustic properties of protonヰXChanged LiNbO3 Studied usingthe
acoustic microscopy V(I) teclmique:'J. Appl. Phys., vol. 60, pp. 2517-2522,
1986.
[6] C. K. Jen, C. Neron, J. F. BussieFe, L. Li, R. Lowe,and J. Kushibiki,
''qlamCteriZation of claddedglass fitkrS uSmg aCOuStiCmicroscopy:. Appl・●
Phys.Left., vol. 55, pp. 2485-2487, Dec. 1989.
[7] C. K. Jen, Z. Wane, A. Nicolle, C. Neron, E. L. Adler,and I. Kushibiki,
''Acoustic graded-index lenses:'Appl. Phys.Lett., vol. 59, pp. 1398-1400, Sep・
1991.
-35-[8] C.耳. Jen, C・ Neron, A・ Shang, K・ Abe, L・ Bommell,and J・ KushibikiJ
・.Acoustic characteri21ation of silica glasses:'J.Amer・ Ceram・ Soc・, vol・ 76, pp・
712-716, 1993.
[9] M. Obata, H. Shimada,and T. Mihara, ''Stress dependence of leaky surface wave on PMMA by line-focus-beam acoustic microscope:I Exper・ Mech・, vol・
30, pp・ 34-39, Mar・ 1990・
llqr T. Miharaand M・ Obata, ''Elastic constant measurement by using
line-focus-beamacoustic microscope:'Exper. Mech., vol・ 32, pp・ 30-33, Mar・ 1992・ lll] J. 0. Kin, J. D・ Achenbach, P・ B・ Mirkarimi・ M・ Shirn・ and S・ A・ Bamett,
・・Elastic constants of single-crystaltransition-metalnitride films measured by
line-focus acoustic microscopy:'J・ Appl・ Phys・, vol・ 72・ pp・ 1805-1811・ Sep・
1992.
[12] J. 0. Kin, J・ D・ Achenbach, M・ Shinn・and S・ A・ Bamett・..Effective elastic
constants and acoustic properties of single-crystal TiNPQN superlattices.1・ J・ Mater. Res・, vol・ 7, pp・ 2248-2256, Aug・ 1992・
[13] Y.-C.Lee, J. 0. Kin,and J. D・ Achenbach, l'Acoustic microscopy
measurement of elastic constants and mass density,''mEE TranS・ Ultrason・・ Ferroelect・, Freq・ Contr・, vol・ 42, pp・ 253-264・ Marl 1995・
[14] J. Kushibiki, H. Takahashi, T. Kobayashi, and N・ Chubachi,..Quantitative
evaluation of elastic properties of LiTaO3 Crystals by line-focus-beam
acoustic microscopy:・ Appl・ Phys・Lett・, vol・ 58・ pp・ 893-895・ Mar・ 1991・
[15] J. Kushibiki, H. Takahashi, T. Kobayashi, and N. Chubachi, ( ''Characteri23tion of LiNbO3 Crystals by line-focus-beam acoustic
microscopy:. Appl. Phys'.Lett., vol. 58, pp. 2622-2624, June 1991・
[16] J. Kushibiki, T. Kobayashi, H. Ishiji, and N. Chubachi, ''Elastic properties
of 5-m01% MgO doped LiNbO3 Crystals measured by line-focus-beam
acoustic microscopy:'Appl. Phys.Lett., vol. 61, pp. 2164-2166, Nov.
1992.
[17] J. Kushibiki, H. Ishiji, T. Kobayashi, N. Chubachi, I. Sahashi,and T. Sasamata, ''Characterization of 36oYX-LiTaO3 Wafers by line-focus-beamacoustic
microscopy:'IEEE Trams. Ultrason., Ferroelect., Freq・ Contr・, vol・ 42, pp・
83-90, Jam. 1995.
llS] J. Kushibiki, M. Miyashita,and N. Chubachi, ''Quantitative characterization of
proton-exchanged layersinLiTaO3 0ptOelectronic devices by line-focus-beam
acoustic microscopy:'IEEE Photonics Teclmol.Left., vol. 8, pp・ 1516-1518,
Nov. 1996.
[19] T. Kobayashi. J. Kushibiki,and N. Chubachi, ''Improvement of measurement
accuracy of line-focus-tx:amacoustic microscope system:l Proc・ IEEE
ULLTTaSOn. Symp., 1992, pp. 739-742.
[20] J. Kushibiki, T. Wakahara, T. Kobayashi, and N. Chubachi, ''A calibration method of the LFB acoustic microscope system uslng isotropic standard specmens:'PTTOC. IEEE ULErlaSOn. Symp.. 1992, pp. 7 19-722・
ー37-(
[21] J. -Kushibiki, N. Akashi, T. Sannomiya, N. Chubachi,.and F. Dunn,.lVH印UHF
range bioultrasonic spectroscopy system and me血od,''IEEE Trams. Ultrason.,
Ferroelect., Freq. Contr., γol. 42, pp. 1028-1039, Nov. 1995.
[22] J. Williamsand J. Lamb, I.Onthe measurement of ultrasonic velocity in
solids:'J. Acoust. Soc. Amer., vol. 30, pp. 308-313, Apr. 1958.
[23] J. Kushibikiand M. Arakawa, ''Accurate measurepents of the acoustical
physicalconstants of nonpleZOelectric single crystals:'submitted for
publication.
[24] J. J. Camptxlland W. R. Jones, llPropagation of surface waves atthe boundary
between a pleZulectric crystaland afluid medium:'IEEE TranS・ Sonics Ultrason., vol. SU-17, pp. 71-76, Apr. 1970.
[25] W. K血1and K.-H. Mahrt,.lRecent results of absolute sound velocity
measurementsinpure waterand sea water at atmospheric pressure," Acustica,
vol. 35, pp. 154-164, 1976.
[26] J. M. M. Pinkerton, ●'The absorption of ultrasonic wavesinliquidsand its
relation to molecularconstitution:. Proc. Phys. Soc., vol. B20, pp. 129-141 ,
Feb. 1949.
[27] G. S. Kell, ''Density,thermalexpansivity, and compressibility of liquid water
from Oo to 150oC: correlationsand tables for atmospheric pressureand
saturation reviewedand expressed on 1968 temperature scale:'J. Chem. Eng・ Data, vol. 20, pp. 97-105, 1975.
-38-[28] J. Kushibikiand M. Arakawa, ''Calibration of the line-focus-beam acoustic
microscopy system uslng Several standard speclmeninthe velocity range
2500-6000 m/S:I submitted for 1)ublication・
[29] J. Kushibiki, Y. Matsumoto, and N. Chubachi, ''Effects of acoustic field
distribution of line-focus-beamon V(Z) curves:'inRep. Spring Meeting
AcousE. Soc. Jpn., pp. 661-662, Mar. 1983・
[307 'Y. Oho, J. Kushibiki,and N. Chubachi, ''Experimental study of construction
mechamism of V(I) curves obtained bythe line-focus-tx:amacoustic
microscope:'inTech. Rep. IEICE, γol. US94-51, pp・ 29-36, Sep・ 1994・
ー39-2. LiTaO3単結晶試料の作製と従来の手法による特性評価 2-1 まえがき LFB超音波顕微鏡によりLiTbO3単結晶の均質性を評価するためには、 LSAW速度 と化学組成比の関係を明らかにする必要がある。本章ではこれを実現するために 用意した単結晶とその基礎的な特性について示す。まず2-2節において、単結晶の 育成条件と形状について示す。次に結晶の均質性の評価に適した基板の作製につ いて述べる。 2-3節では、前節で用意した試料の基礎的な特性として、化学組成比 と密度を従来用いられている分析手法により評価する。 2-2 単結晶および基板の作製
単結晶の作製
叫単結晶のコングルエント組成は48.5Li20m01%付近のTa-richな領域に存在 する【1,2]。したがって、 LFB超音波顕微鏡により化学組成の評価を行なうには、 この付近におけるLSAW速度と化学組成比の関係を把握する必要がある。そこで 原料仕込時におけるLi20の含有率を48、 48.5、 49m01%とした3種類の皿03単結 晶と、市販の光学用LiTQ単結晶(コングルエント組成、 48.55Li20m01%)を用 意した.これらはC血dsb (CZ)法により結晶Y軸の方向に育成されているo各 結晶の形状を表2-1に示す。 以後、本論文では、原料仕込時におけるu20の含有率により、これら4種類の 結晶を区別する。基板の作製
用意した単結晶の均質性を評価するためには、結晶の育成方向あるいは直径方 向に対して並行に切り出した基板が望ましい。そこで図2-1に示すように、 ⅩCut、 Y{ut、およびZヾut基板を切り出した。各基板の概形を図2-2に示す。 Zkut基板は結 晶の育成方向および直径方向における均質性を1枚の基板上で評価するために用 いる。 Yic瓜基板は結晶の直径方向における均質性の評価に用いる他に、育成方向 における均質性を密度の分布として捉えるために用いる。 Ⅹヾut基板は結晶の育成 方向における均質性と結晶の平均的な密度を評価するために用いる。 基枚の作製において、 Ⅹ-cut基板および乙伽t基板はX線回折法により各面を正確 に測定して切り出した。 YJc瓜基板は、結晶の上端面がⅩ線回折法によりY面として-40-表2-1 uhO3単結晶の仕込組成比と形状 PttBpared(bmposidon 儉ength [TTLm] 認 ヨWFW" 蒙リ 「 u20 【mo1%】 彦 $ R 蒙 X 「 (1) 鼎や 52.00 田 77 (2) 鼎ゅS 51.50 田b 77 (3)* 鼎ゅSR 51.45 都 101 (4) 鼎偵 51.00 田r 77
+伽Ilmerdalop血al-grade肋03 CryStalwithCongruent composition・
-41-(T)
図2-1 LiTaq単結晶と試料の作製Xそ息
Y-cut
図2-2 基板の概形・42-正確に切り出されていることを利用し、この面を基準としてバンドソ一により複 数枚を同時に切り出した。 各基板の厚さは、バルク披速度の測定において必要な厚さを考慮して3-4血爪 とした。各基板の表面は光学研磨されている。
結晶面と試料面の不一致-先述のように、 Y血基板はX線回折法による面方位の測定を省略して切り出し たため、試料面と結晶面が-敦していない可能性がある。そこでⅩ線回折法によ りこれらのずれの程度を測定した。試料は各結晶のYlの基板とした。図2-3に結晶 面に対する試料両の傾き角および傾き方向を表わす座標系を示す。表2-2に測定結 果を示す。傾き角は0.Or∼0.12。と大きい。 Yヾ此基板はノミンドソ-で切り出してい るため、 Y2、 Y3の基板も同様のずれを有すると考えられる. lSAW速度やバルク 披速度の測定においてはこれらの影響を考慮する必要がある。 2-3 結晶の基礎的な特性の評価 一般に、コングルエント組成ではない融液から育成された結晶の化学組成比は、 融液の化学組成比とは-敦しない【1,2]。したがって、 2-2節で準備した4種類の は的単結晶の実際の化学組成比も原料仕込み時とは異なっていると考えられる○ そこで本節では、従来よく用いられてきたICP-JuS法やⅩRF法、 DIA法により化学 組成分析を行ない、これらの結晶の化学組成比を把撞する。また密度を測定し、 化学執成比との関係を求める。2-3-1化学組成分析
義塾
本節で行なう化学組成分析は就科の破壊を伴うため、 2-2節で示した結晶とは別 の4種類のU的単結晶を用いた。ただし、これらの結晶の原料仕込時における u20の含有率や結晶の育成方向は先の結晶と同じである。各結晶の中央部におけ る化学執成比を結晶の値として代表させるために、図2-4に示すように、結晶の上 部側端面より24.3 mmの位置においてYぺ此基板を切り出して分析用の試料とした. ICP-AES法とm法に用いる筑料はアルミナ製の磁器を用いて粉末にした0-43-図2-3 結晶面と試料面の間のずれを示す座標系 表2-2 Yd面における試料面と結晶面のずれ PrcpardLiPlmo1%] ク 芳Vx 「 8ldeg] 48.00 蔦 3偵3S" 0.112 4S.50 S C 0.104 48.55 (Congruent) 蔦 B ヲ 0.079 49.0 蔦3 纉 0.073
-44-図2-4 化学組成分析用のLiTaq単結晶と試料の切り出し位置
ー45-JCP-AES法による分析 ICP-AES法は検量線のダイナミックレンジが広いことや何種類もの元素を向時 に分析できること、倣量元素の検出が可能であることなど優れた点を有している。 特に他の手法では分析が困難であるUに対して直掛こ定量分析を行なえることは、 皿03の化学組成分析を行なう際に大きな利点となる. ICP-AES装置の基本的な構成を図2-5に示す。溶媒に溶かされた試料は霧吹きの 要領でアルゴンプラズマ中に導入される。試料に含まれている原子はプラズマに 助担されて固有の波長を持つ光を発する。この光を分光することで元素の特定を、 またその強度から含有率を定量することができる。 (-り試料の溶解と調整 寛科の溶解 ICP-AES法は固体試料をそのまま分析することは出来ないため、事前に適切な 溶媒に溶かす必要がある。しかしuTdhは溶けにくい物質であるためにこの処理 が難しい。このような難溶性の物質を溶かす手法としてBomb法(加圧溶解法)が ある。この手法は、粉末状の試料を図2-6に示すような耐圧容器の中に酸などの溶 媒と共に入れて完全に密閉する。この容器をオープンの中に設置して加熱すると、 容器内の圧力と温度が上昇して試料を溶解できる。本論文ではこの手法により試 料を溶解した。 耐圧容静内に入れる試料粉末の量は各結晶とも約20mgとした。溶媒は硫酸
012SO4) 5m2,硝酸(HNO3) 2.5 m2、 7ツ化水素酸帥) 2.5meの混酸である。
耐圧容掛まHFの使用を考慮してテフロン製のものを用いた。オープン内の温度は 1600Cとし、約18時間かけて溶解した。完全に溶解したことは目視により判断し た。そののち、溶液を別のテフロン製のピーカに移し、電熱器の上で濃やかに加 熟してHFとm03を溶液中から除去した。最後に、 Taの加水分解を防ぐために過 酸化水素水(H2Q)をlmL加えた。この様な手順により各結晶ごとに3つの試料 溶液を作製した。 ところで、 ICP-AES法では分析を精度良く行なうために内標準法【付録仰こよる 比較測定を行なうことが多い。本論文においてもこの方法を用いた。内標準元素 I山やThの発光に影響を及はさないイットリウム(Y)とした。全ての試料溶液は、 Yの内標準溶液を5mげっ加えたのちにメスフラスコに移し、蒸留水により50mL に希釈・秤量した。 ・46・
図2-5 ICP-AES装置の基本的な構成
-47-固定ねじ
図2-6 Bomb法用の耐圧容器の断面図
-48-壕準試料溶液の作製 分析は元素濃度と発光強度の関係である検量線を物差しとして実施する。そこ でこれを作製するために、分析対象となるLiとThの標準試料溶液を作製した【付鹿 A]。各溶液の濃度は0.10069Limg仙2および1.455 Tamghneさぁる。次に、これら の溶液から必要な量を分取してメスフラスコに入れたのち、 Yの内標準溶液を5mg 加えた。さらに、溶液に含まれるH2S04とH2Qの量が試料溶液と同じくなるよう に調整したのち、蒸留水により50mBに希釈・秤量した。このような手順により、 LiとTaに対してそれぞれ濃度を変えた5種類の標準試料溶液を用意した。これら を表2-3に示す。 (近)分析 -まず、定量分析の物差しとなる検量線を作製した。用意した標準試料溶液それ ぞれに対して発光強度を3回ずつ測定してその平均値を求めた。そして温度と発 光弛皮の関係を最小二乗法により二次曲線として求めた。その結果を図2-7に示す。 図の横軸は元素濃度を、縦軸は分析対象元素の発光強度/Yの発光強度を示す。得 られた検量線は直線性に優れており、 ICP-AES法のダイナミックレンジの広さを 示している。 この検量線を用いて未知就科溶液の濃度分析を行なった。測定は各溶液につき 3回ずつ行ない、その平均値を求めた。これらを酸化物の温度に換算した結果を 表2-4に示す。一般に、試料中の主元素に対するICPIAES法の測定分解能は0.1-1 md%程度である。したがって48.Omd偽の試料と49.0 md%の試料を区別すること はできていない。また、コングルエント組成の結晶のLiに対する分析値は仕込値 よりも0.8md%程度小さい。これはコングルエント組成の定義に反しており、得 られた数値に倍頼性がない。他の試料の分析値も真備より小さいと思われる。 分析を正確に行なえなかった原因は、皿03が難溶性の物質であることや、溶 解の程度の判断を目視に頼らざるを得ないことにあると思われる。したがって ICP-AES法によりUnO3単結晶の化学組成比を精密に分析することは困難であると 考える。
XRF法による分析
ⅩRF法は他の分析手法に比べて装置の安定性や測定精度に優れていると言われ ている。また分析対象として固体・粉末や液体といった訣料の状態を問わないこ とや何種類もの元素を同時に分析できること、微量元素の検出が可能であること-49-表2-3 ICP-ABS法による化学組成分析において用意した Liおよび「抱の標準試料溶液の濃度 GInqさntradonlmg/50me] Li 犯綴 Li-2 犯蔦2 u-4 由モR 0.柵 # 0.6041 繝 SR 1.0069 Ta 彦 モ Ta-2 彦 モ2 Ta,4 彦 モR 0.000 縱3 13.095 r紊c 21.$25
ー50->ト一SZuトZ一山≧ト<∝u∝ >トLSNuトNJu^llV正ut] 5 10 15 20 25 Ta CONCENTRATION lmg/50m[] o)) Taに対する検量線 図2-7 ICP-AES法による化学組成分析に用いる検量線
ー51-表2-4 ICP-AES法により分析した4種類の LiTaO3単結晶の化学執成比 rbpazdLi2O 【md%】 ヌ率VF6 V蹠& F u2P 彦 # R 【md%】 蒙 X 「 48.0 鼎r縱R 52.25 4S.5 鼎r繝2 52.17 48.55 鼎r縱b 52.24 49.0 鼎r縱 52.21
-52-など優れた点を有している。 分析装置の基本的な構成を図2-8に示す。 Ⅹ線が照射されると、試料中に含まれ る各元素の持つ電子が励起される。そのため、その電子の属していた軌道には壁 孔が生じる。その空孔-外殻の軌道に属する電子が遷移すると、これらの軌道問 のエネルギー差に相当する波長のⅩ線を放出する。このⅩ線は蛍光Ⅹ線と呼ばれ、 元素固有の波長を持つ。分光結晶は格子定数が既知であるのでBraggの回折条件に より元素の特定を、また蛍光Ⅹ線の強度から元素濃度の定量を行なうことができ る。 ところで、実際の分析に際しては物質に含まれている元素の相互干渉による蛍 光Ⅹ線の励起・吸収や試料の表面状態の影響を考慮する必要がある。そのため、 検量線の作製に必要な標準試料としては分析試料と構成元素や表面状態が同じで、 組成比が既知のものが望ましい。しかしこのような物質を準備することは困難で ある。 本研究においても標準試料を用意できなかったので化学組成比を直接に定量す ることはできない。そこで蛍光Ⅹ線強度の大小から化学組成の比較を試みた。 xRF法ではLiを分析できないのでTaと0を分析対象とした.化学組成の異なる4種 類の基板に対して25回の換り返し測定を行ない、待られた蛍光Ⅹ線強度の平均値 を求めた。結果を表2-5に示す。表内のGは25回の繰り返し測定における標準偏差 であり、 20は測定分解能に対応する。 Ta、 0ともに得られた強度の最大値と最小 値の差は測定分解能よりも小さい。したがって化学組成比の大小を議論すること はできない。
DTA法によるキュリー温度の測定と化学組成分析
強誘電体においてキュリー温度は強誘電相から常誘電相への転移点にあたり、 化学執成比と密接な関係にある。これまで、 U的単結晶の開発においてYml血 らはそのキュリー温度と化学組成比の関係を検討している【3].またMiya2aWaらや satoらはキュリー温度の測定からコングルエント組成の決定を試みている【1, 2]。 m法はキュリー温度を測定する手法の一つである。この手法は、物質が物理 的変化あるいは化学的変化を起こすときにその内部に発生する熟変化を、試料と 基準物質との温度差として検出する。測定装置の基本構成を図2-9に示す。粉末状 にされた試料は基準物質とともに熱的に均一な電気炉内に設置される。これらは 電気炉により一定の速度で加熱あるいは冷却される。この時、これらの温度差-53-試料
図2-S XRF装置の基本的な構成
表2-5 XRF法により測定した4種類のLiTaO3単結晶 のTaと0に対する蛍光Ⅹ線強度 PtcpardLi20 lmolY] 薄蹤V 宥 Ta lk甲S] 霧7 8 「 4S.0 塔C2縱r 1.0043 48.5 塔C2繝b 1.0050 48.55 塔CB r 1.0059 49.0 塔C2纉 1.0062 h4ax.DiJrezcnce 0.0019 2cF R 0.0070 -55・
図2-9 DT臓置の基本的な構成
-56-(示差熟)を熱電対により電圧の形で検出する。示差熟を時間の関数として措い たものは示差熟曲線と呼ばれる。強誘電体は常誘電相-と相転移する際に吸熱反 応をともなうため、図2_10に示すように示差熱はいったん低くなる。この極小点 が現われた時の試料温度をもってキュリー温度とする。図2二11はuTh03に対して 測定した示差熟曲線の例【41である。LiTa03では明確な極小点は得られない.その ため、矢印で示した曲線の立ち上がりを極小点とした。 ( i ) DTA法の測定精度 文献【4]によると、 Ⅰ叫に対するキュリー温度の測定の再現性は士0.8 oC程度で ある。この理由として次のようなことが考えられる。まず、前述のように示差熟 曲線に明確な壌小点が現われないためにキュリー温度の決定精度が悪い。また図 2-1Tのように示差熟曲線はわずかに波打っているためにその立ち上がり点の決定 に影響を及ぼす。したがって、 DIA法のキュリー温度に対する測定精度は±1.00C 程度と考える。 (ii)キュリー温度の測定 測定は各組成の試料粉末を3つに分けて、各々について2回ずつ行なった。そ して、各執成毎に平均値を求めた。その結果を表2-6に示す。キュリー温度はUの 含有率が増えるにつれて単調に高くなる。 48.5 m01%の試料と48.55 m01%の試料に 対するキュリー温度の差は、LiTh03に対するキュリー温度の測定精度±1.OoCと同 程度である。したがって、これら2つの試料をキュリー温度から区別することは 難しい。しかし、 48.0、 48.5 (または48.55) 、 49.0m01%の3つの試料に対しては キュリー温度の差が5-6oCと大きく、化学組成比の相違を充分に判別できている と考える。 ( iii )化学組成比への換算 satoらは図2-12のように日払03のキュリー温度と化学組成比の関係を検討してい る【2]。国中のStarhgMadalは結晶の原料であるLi2C03とTa2句の粉末をある比率 で混合したのちに焼結させたものである。したがってこれらの化学組成比は既知 である。 StardJlg M血alに対する直線を用いて表2-6に示したキュ1) -温度をLi20
濃度に換算した。その結果を表2-7に示す。 48.5 m01%および48.55 m01%の結晶に対 しては仕込値と分析値が測定誤差内で一致している。一方、 48.0 m01%の結晶の実 際の化学組成比は48.38士0.03Li20 m01%、 49.0 m01%の結晶は48.67±0.03Li2O mo1%
とコングルエント組成のほう-近づいている。これらより、結晶はコングルエン
-57-図2-10 キュリー温度の決定方法 I,;'立法:篭 Ii 劔劔 綿 カツ ツ 剪 二1 i I !L 凵 i 白 Ⅲl .轡苧雫j 劔劔 I I 鳴 I 亦 F 白 ツ 鳴 = time 図2-ll LiTaqに対する示差熟曲線
ー58-表2-6 m法により測定した4種類の
単結日のキ
urm03早符晶のキュリー温皮
hpadLi20 W&剖FVラ VラGW&2
【mo1%】 エ8 「 48.0 鉄澱縒 48.5 田 縒 4S.55 田 "絣 49.0 田 r纈
-59-0.0 1 -59-0.0 2 -59-0.03 -59-0.0 4
X
LilーXTal+Ⅹ03
図2-12 LiTb03における化学組成比とキュリー温度の関係【2]
ー60-表2-7 表2-6に示したキュリー温度と 図2-12の換算直線から得た4種類の 皿03単結晶の化学組成比 P陀padLi20 ヌ率VDニ 【mo1%】 蒙 X 「 48.0 鼎ゅ3 「 2 4S.5 鼎ゅS モ 2 48.55 鼎ゅS( モ 2 49.0 鼎ゅcx贊 2
-61-ト組成に近づくように育成されることがわかる。ここで得た値を2-2節で用意した 4種類のLiTaO3単結晶それぞれのLi20温度として代表させるo 2-3-2 密度の測定 密度は化学組成比を反映する六ラメータである。本節では2-2節で作製した各結 晶の密度を測定して化学組成比との関係を明らかにする。
空気による浮力の影響を補正したアルキメデスの原理
密度の測定はアルキメデスの原理に基づいて行なう。本研究では一般に知られ てい るこの度理に空気の浮力に対する補正を導入してさらに高精度に測定を行なっ た。図2-13に密度測定の模式図を示す。図中のpは試料の密度、 Vは試料の体積、 MAは空気中における試料の重さ、 Mwは水中における試料の重さ、 pwは水の密度、 pAは空気の密度を示す。 hh、 Mwは次のように表わされる。 MA=P・Ⅴ一PA・V Mw=p・Ⅴ-pw・Ⅴ 式(2-1)の右辺第二項が空気の浮力に対する補正項である。式(2-1)、 (2-2)からVを 消去すると、次式が得られる。p-&pw -&pA (2-3)
すなわち、叫かMw、 pw、 pAを測定することにより式(2-3)から試料の密度pを 求めることができる。 MAとMwは精密電子天秤を用いて測定する。 pwはMwの測定 の際に用いる純水の温度を熟電対とデジタルボルトメーターにより測定して文献 [5]から求める。 pAはMAの測定時における気圧と気温および湿度を測定して文献 【6】から求める。測定結果
2-2節で用意した4種類の肌03単結晶それぞれの平均的な密度を測定する。こ の試料としてはZk氾t基板が望ましいが、その重量が精密電子天秤の測定制限重量 よりも重いために用いることはできなかった。そこで、 Ⅹヾut基板を試料として測 定を行なった。測定結果を表2-8に示す。また図2」14にu20濃度と密度の関係を示-62-(a)空気中における試料の重さの測定
O))水中における就科の重さの測定
図2-13 密度測定の模式図
ー63-表2-8 化学組成比の異なる4種類のLiTaO3単結晶に対する 密度の測定結果 PrepazdLiP ヌ率VDニ Density 【mo1%】 蒙 X 「 lkg/m3] 48.0 鼎ゅ3 モ 2 7463.2±0.3 4S.5 摘2經 7 2 7460.6±0.3 48.55 鼎ゅS( モ 2 7460.4±0.2 49.0 鼎ゅcx モ 2 7457.9±0.2
-64-0 6 4 7, ruP己と一SNu凸 48.4 48.5 48.6 48.7
Li20 CONCENTRATION lmol%]
48.8
図2-14 UW3単結晶の密度の化学組成比依存性
ー65-す。図中の直線は最小二乗法による近似直線であるo u20濃度が大きくなると雫 度は相.4 OCg/m3)/mo1%の割合で単調に小さくなる。 2-4 あとがき 本章では、 LFB超音波顕微鏡により光学用uTも03単結晶の均質性を評価する手 法を確立するために必要な試料の作製と、その基礎的な特性である化学組成の評 価を行なった。 まず化学組成比を変えた4種類の結晶を作製した。また、これらの結晶よりそ の均質性を評価するための基板を作製したoつぎにICP-AES法、 xRF法、 UIA法に より結晶の化学組成比の評価を行なった。その結果、結晶はコングルエント組成 に近づくように育成されることがわかった。また、本試料に対してICP-AES法と XRF法の測定分解能は不十分であったが、 DTA法は優れた分解能を示した。した がって、 m法はuM3の化学組成評価において有用であると考える。また、各 結晶の密度を測定して化学組成比との関係を明らかにした。